evan.goetz@LIGO.ORG - posted 15:52, Tuesday 18 April 2017 - last comment - 06:11, Friday 28 April 2017(35640)
Turned off Pcal camera ethernet adapter -- maybe mitigates a ~1 Hz comb?
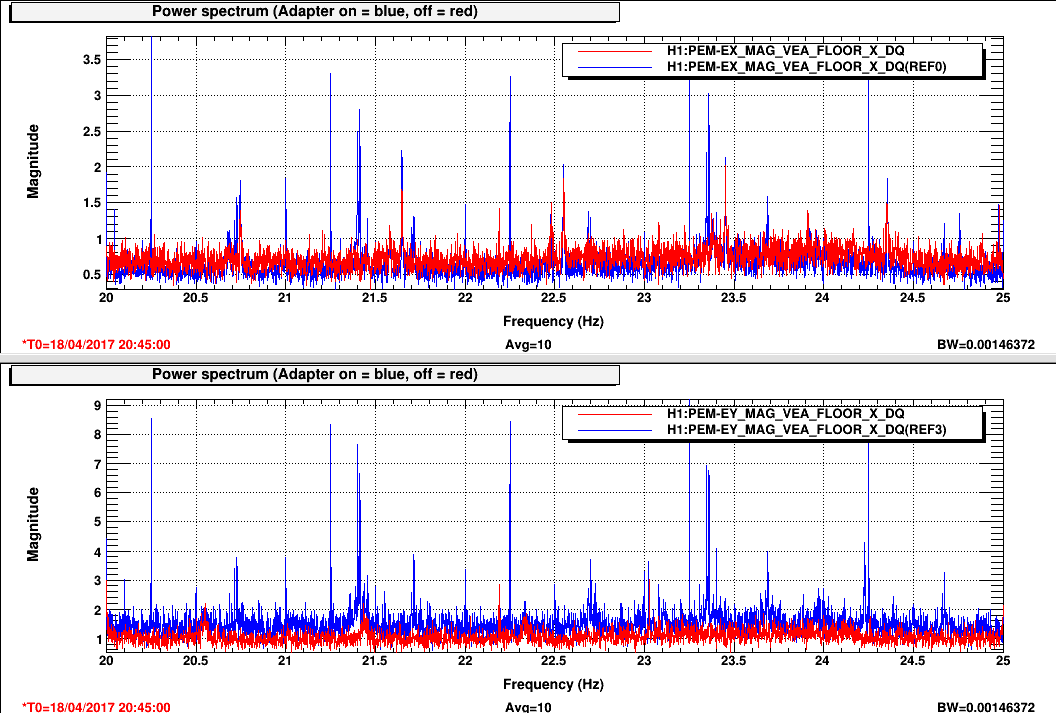
Evan G., Robert S.

Looking back at Keith R.'s aLOGs documenting a changes happening on March 14 (see 35146, 35274, and 35328), we found that one cause seems to be the shuttering of the OpLev lasers on March 14. Right around this time, 17:00 UTC on March 14 at EY and 16:07 UTC at EX, there is an increase in line activity.

The correlated cause is Travis' visit to the end station to take images of the Pcal spot positions. The images are taken using the Pcal camera system and needs the OpLevs to be shuttered so that a clean image can be taken without the light contamination. We spoke with Travis and he explained that he disconnected the USB interface between the DSLR and the ethernet adapter, and used a laptop to directly take images. Around this time, the lines seem to get worse in the magnetometer channels (see, for example, the plots attached to Keith's aLOG 35328).

After establishing this connection, we went to the end stations to turn off the ethernet adapters for the Pcal cameras (the cameras are blocked anyway, so this active connection is not needed). I made some magnetometer spectra before and after this change (see attached). This shows that a number of lines in the magnetometers are reduced or are now down in the noise.

Hopefully this will mitigate some of the recent reports of combs in h(t).

We also performed a short test turning off another ethernet adapter for the H1 illuminator and PD. This was turned off at 20:05:16 18/04/2014 UTC and turned back on at 20:09:56 UTC. I'll post another aLOG with this investigation as well.
Images attached to this report
Comments related to this report
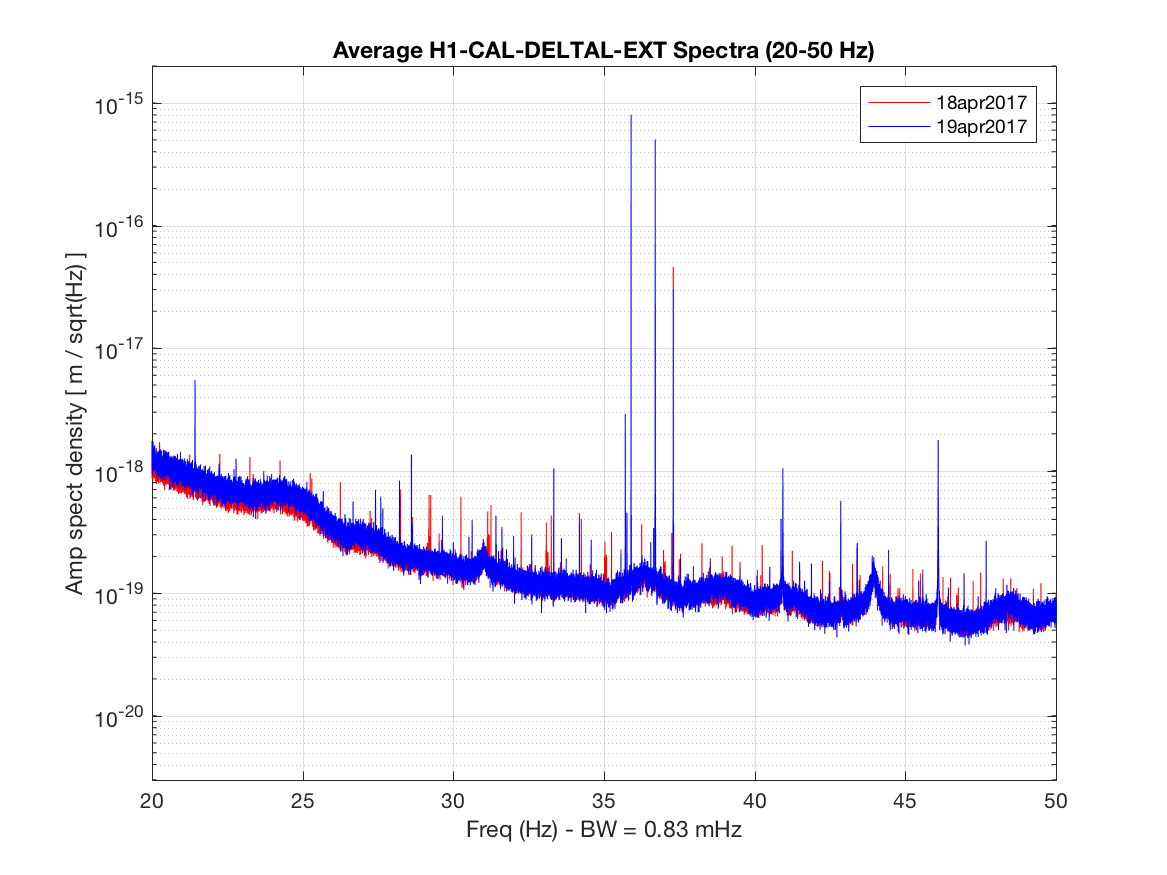
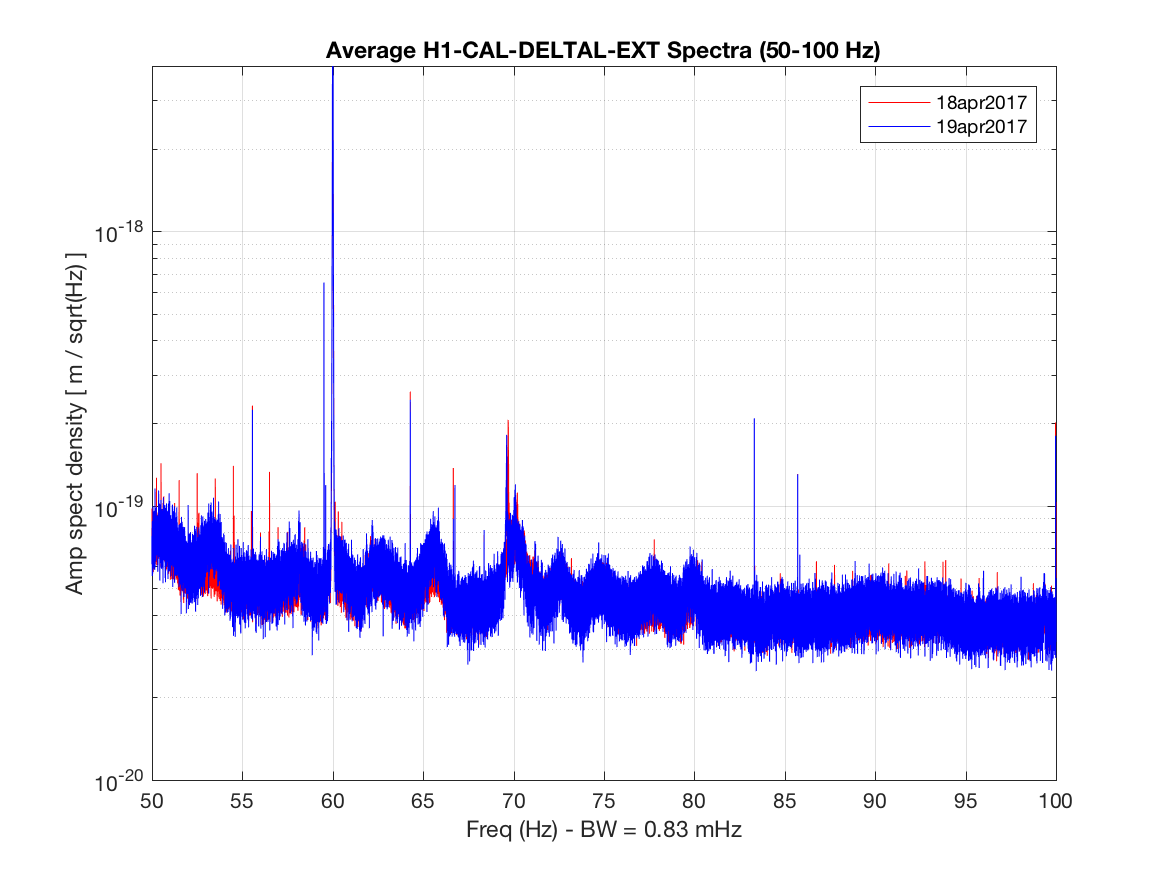
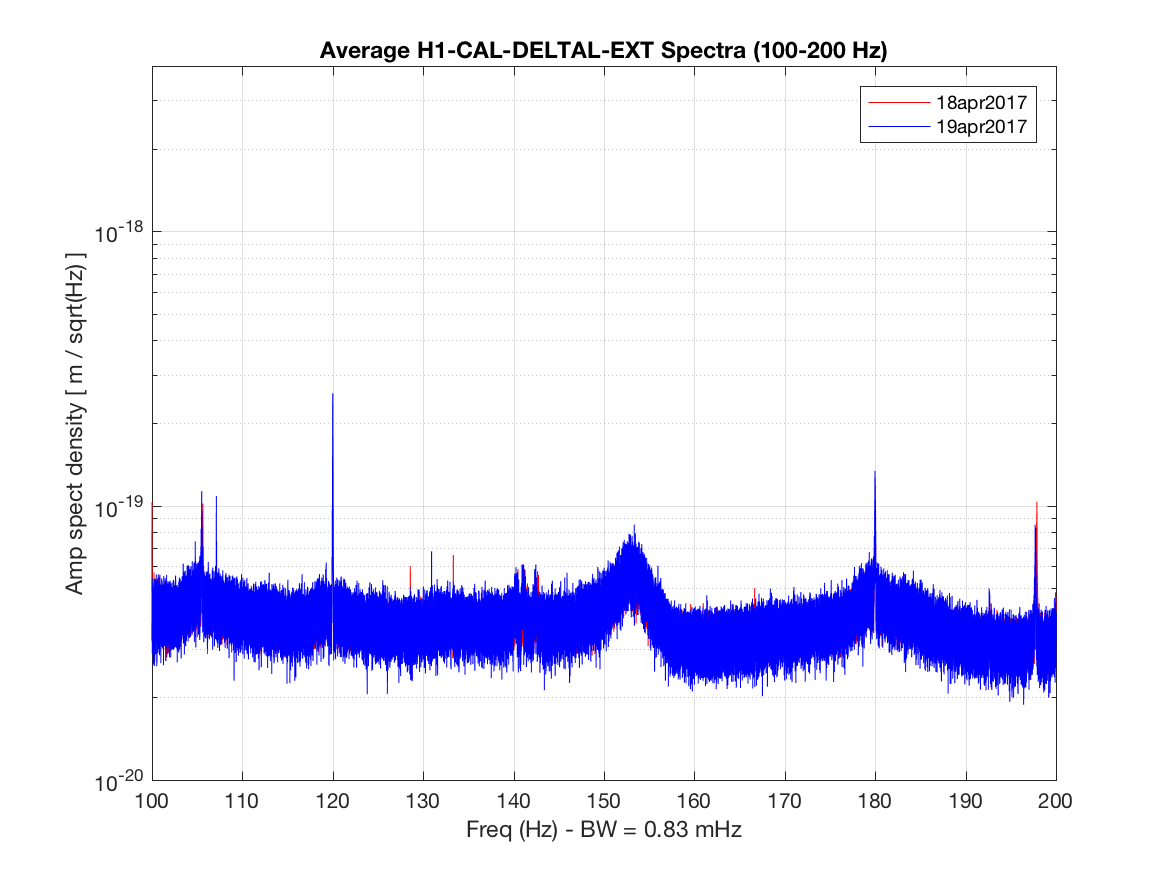
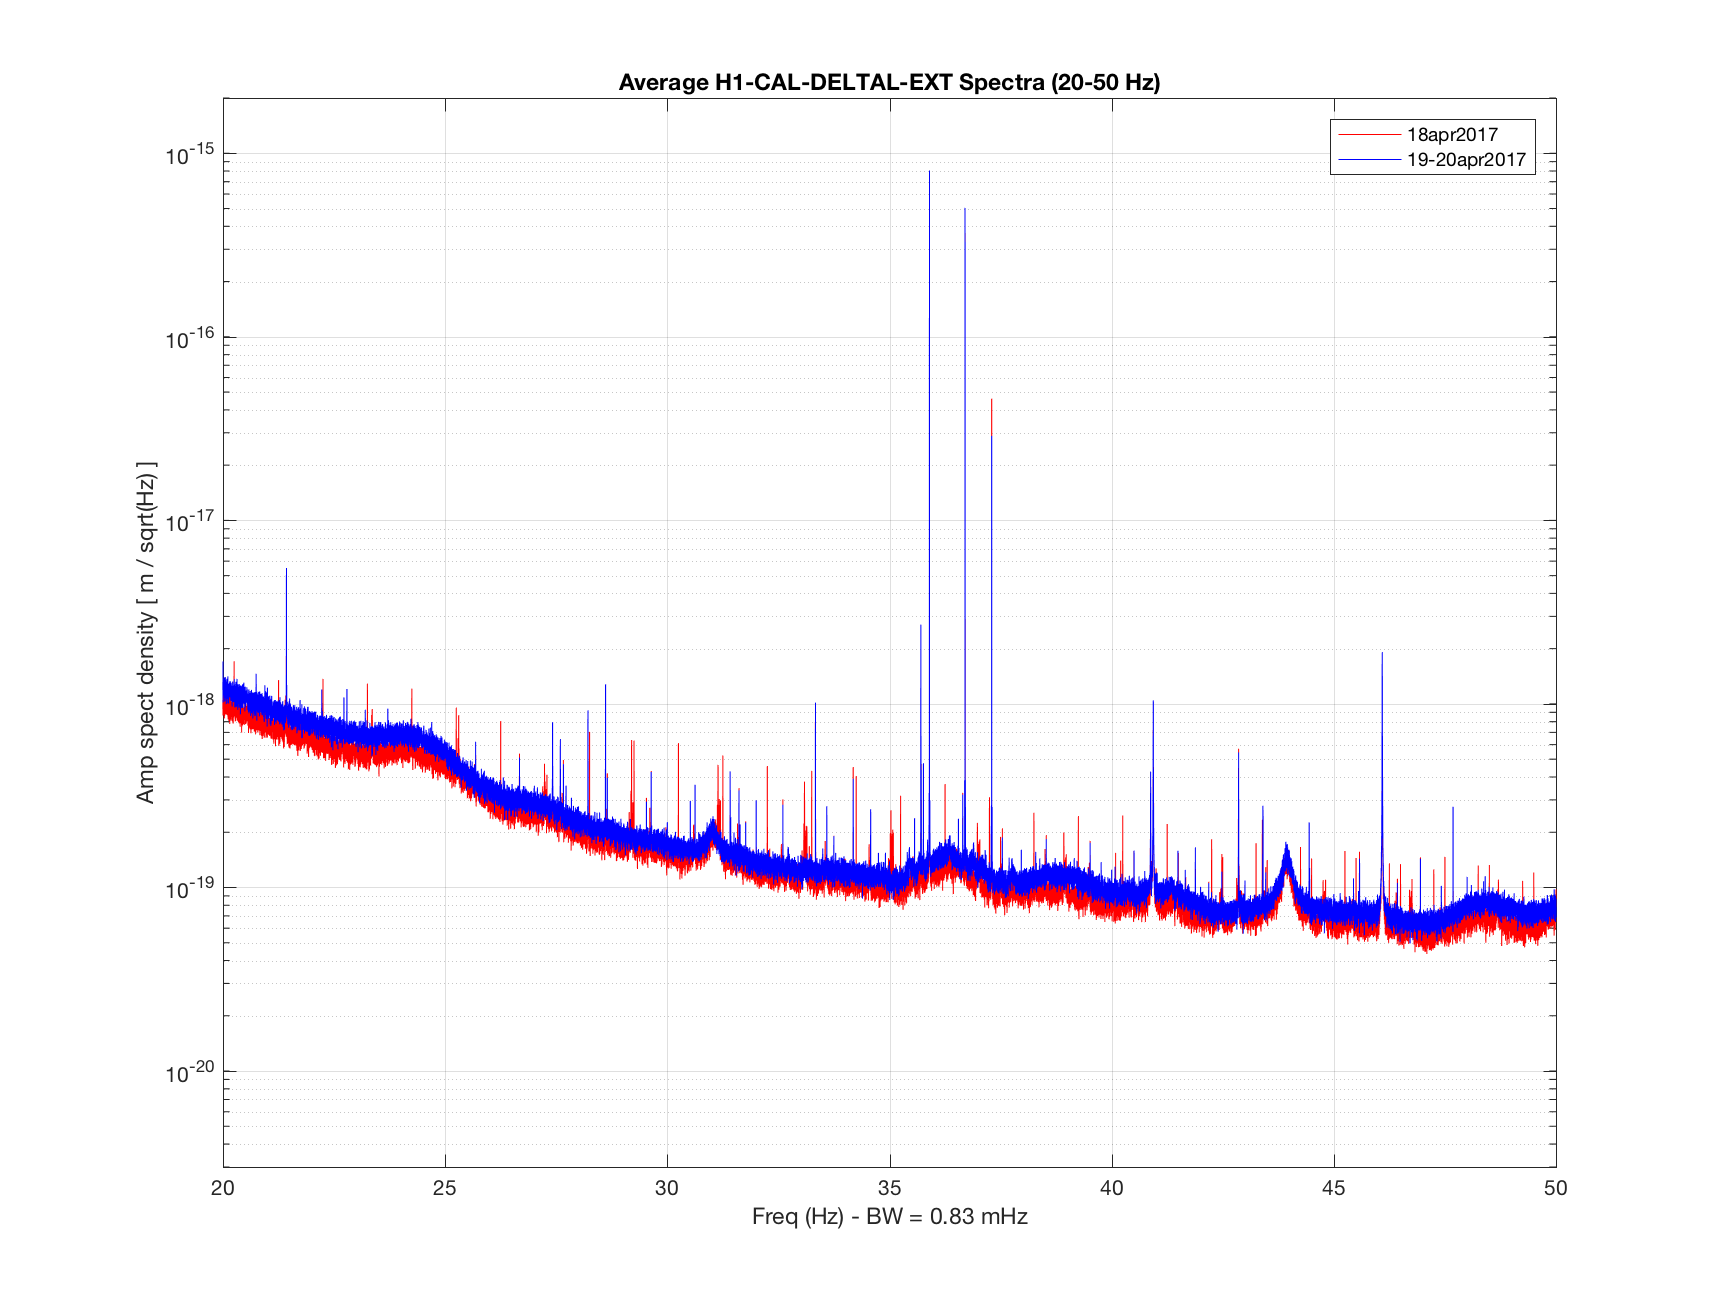
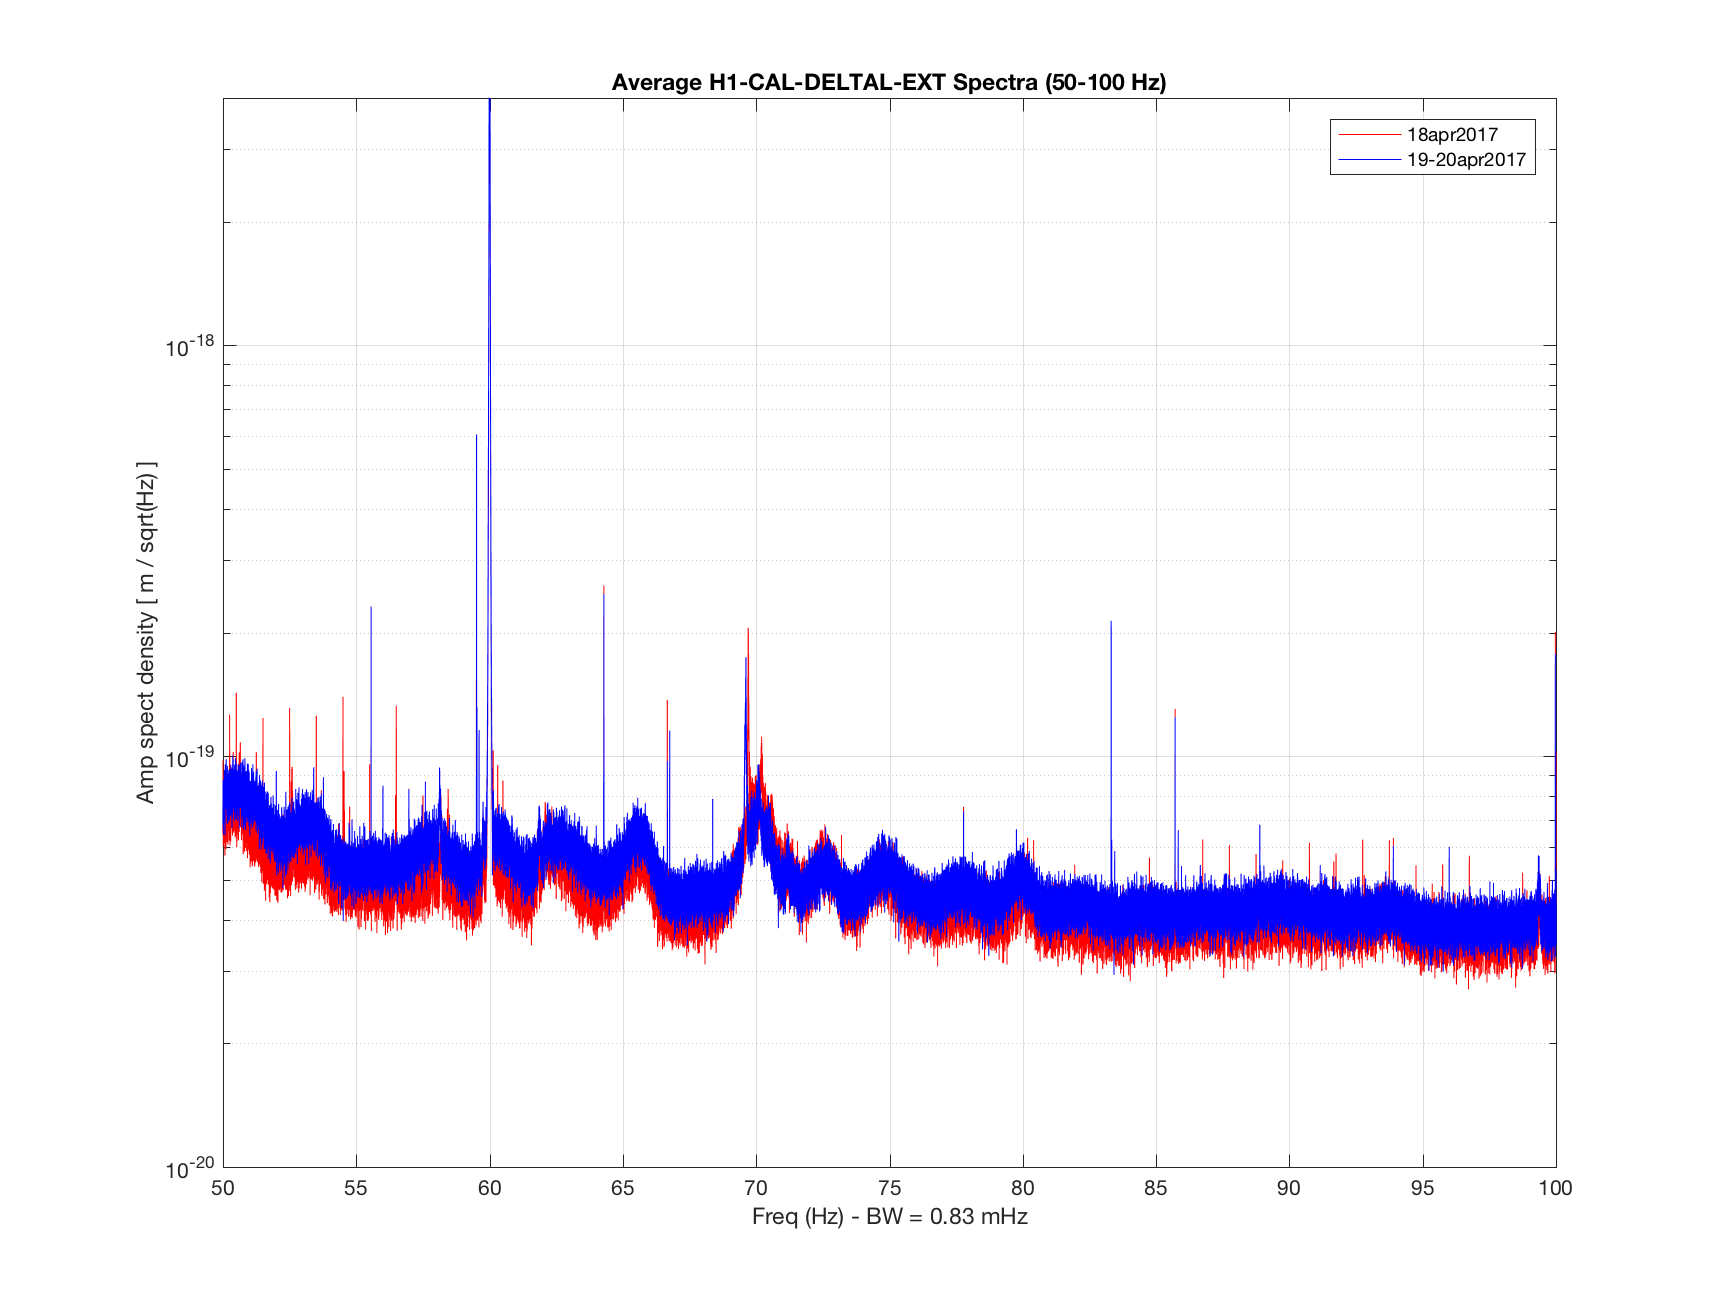
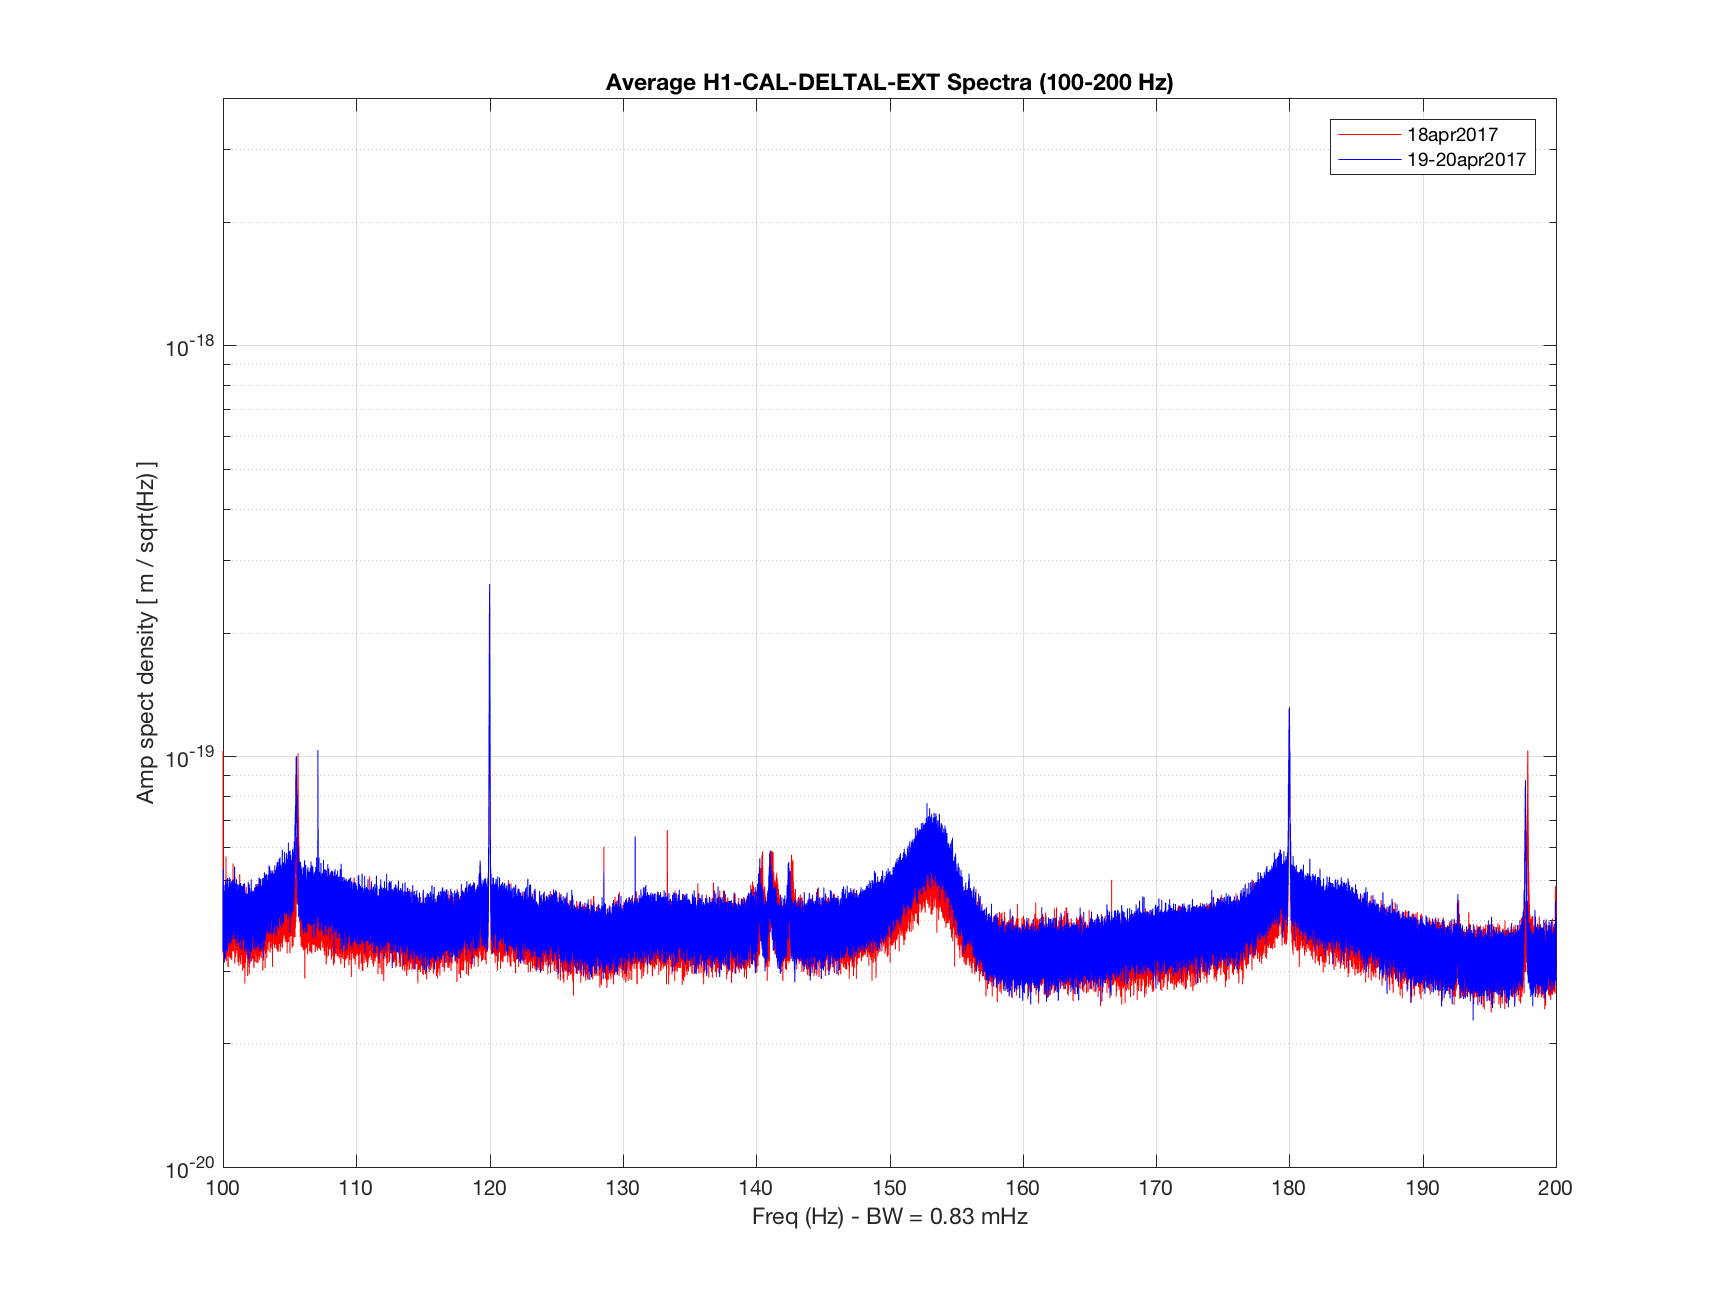
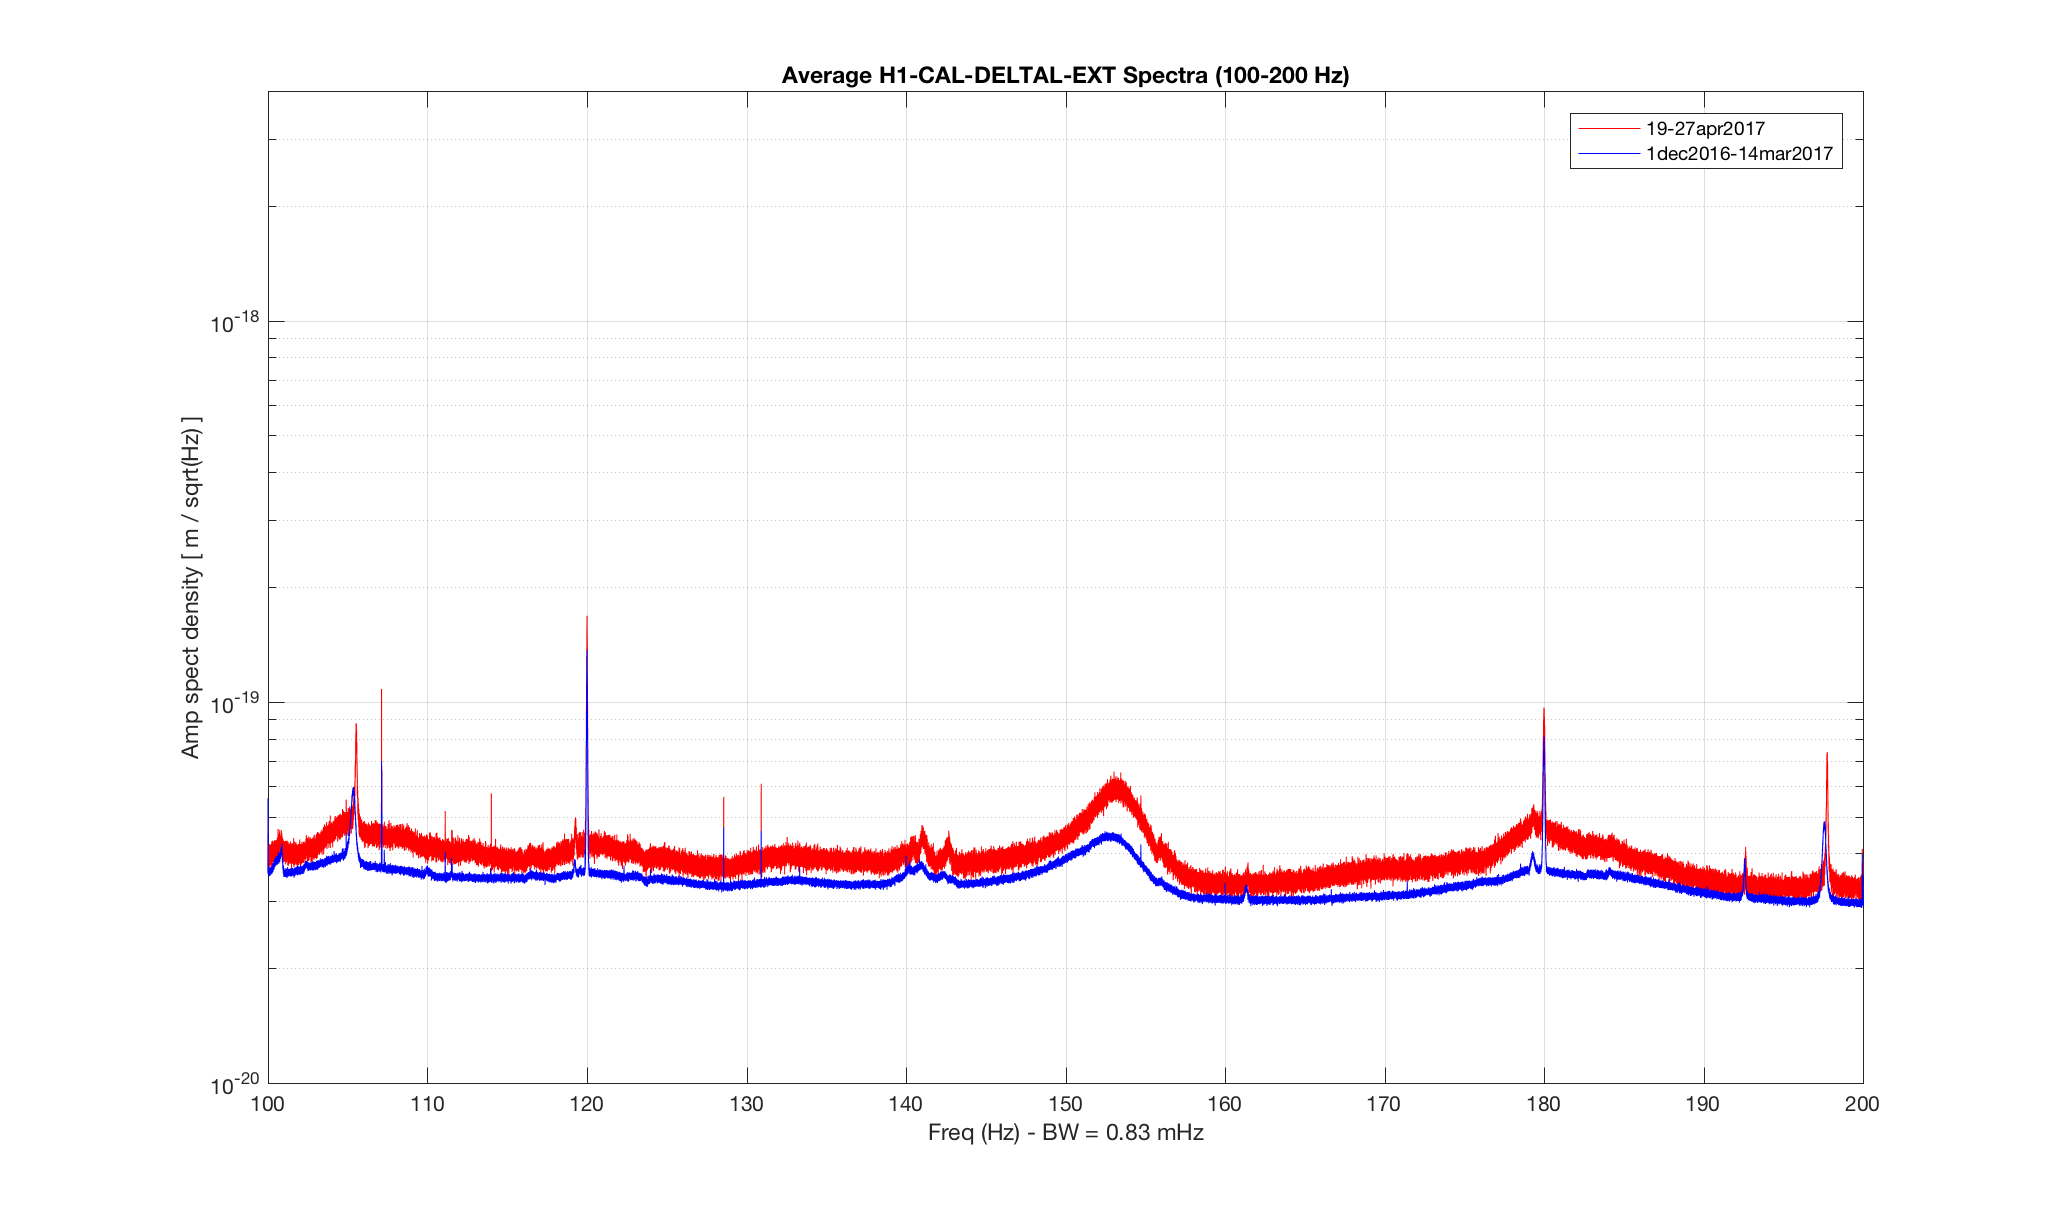
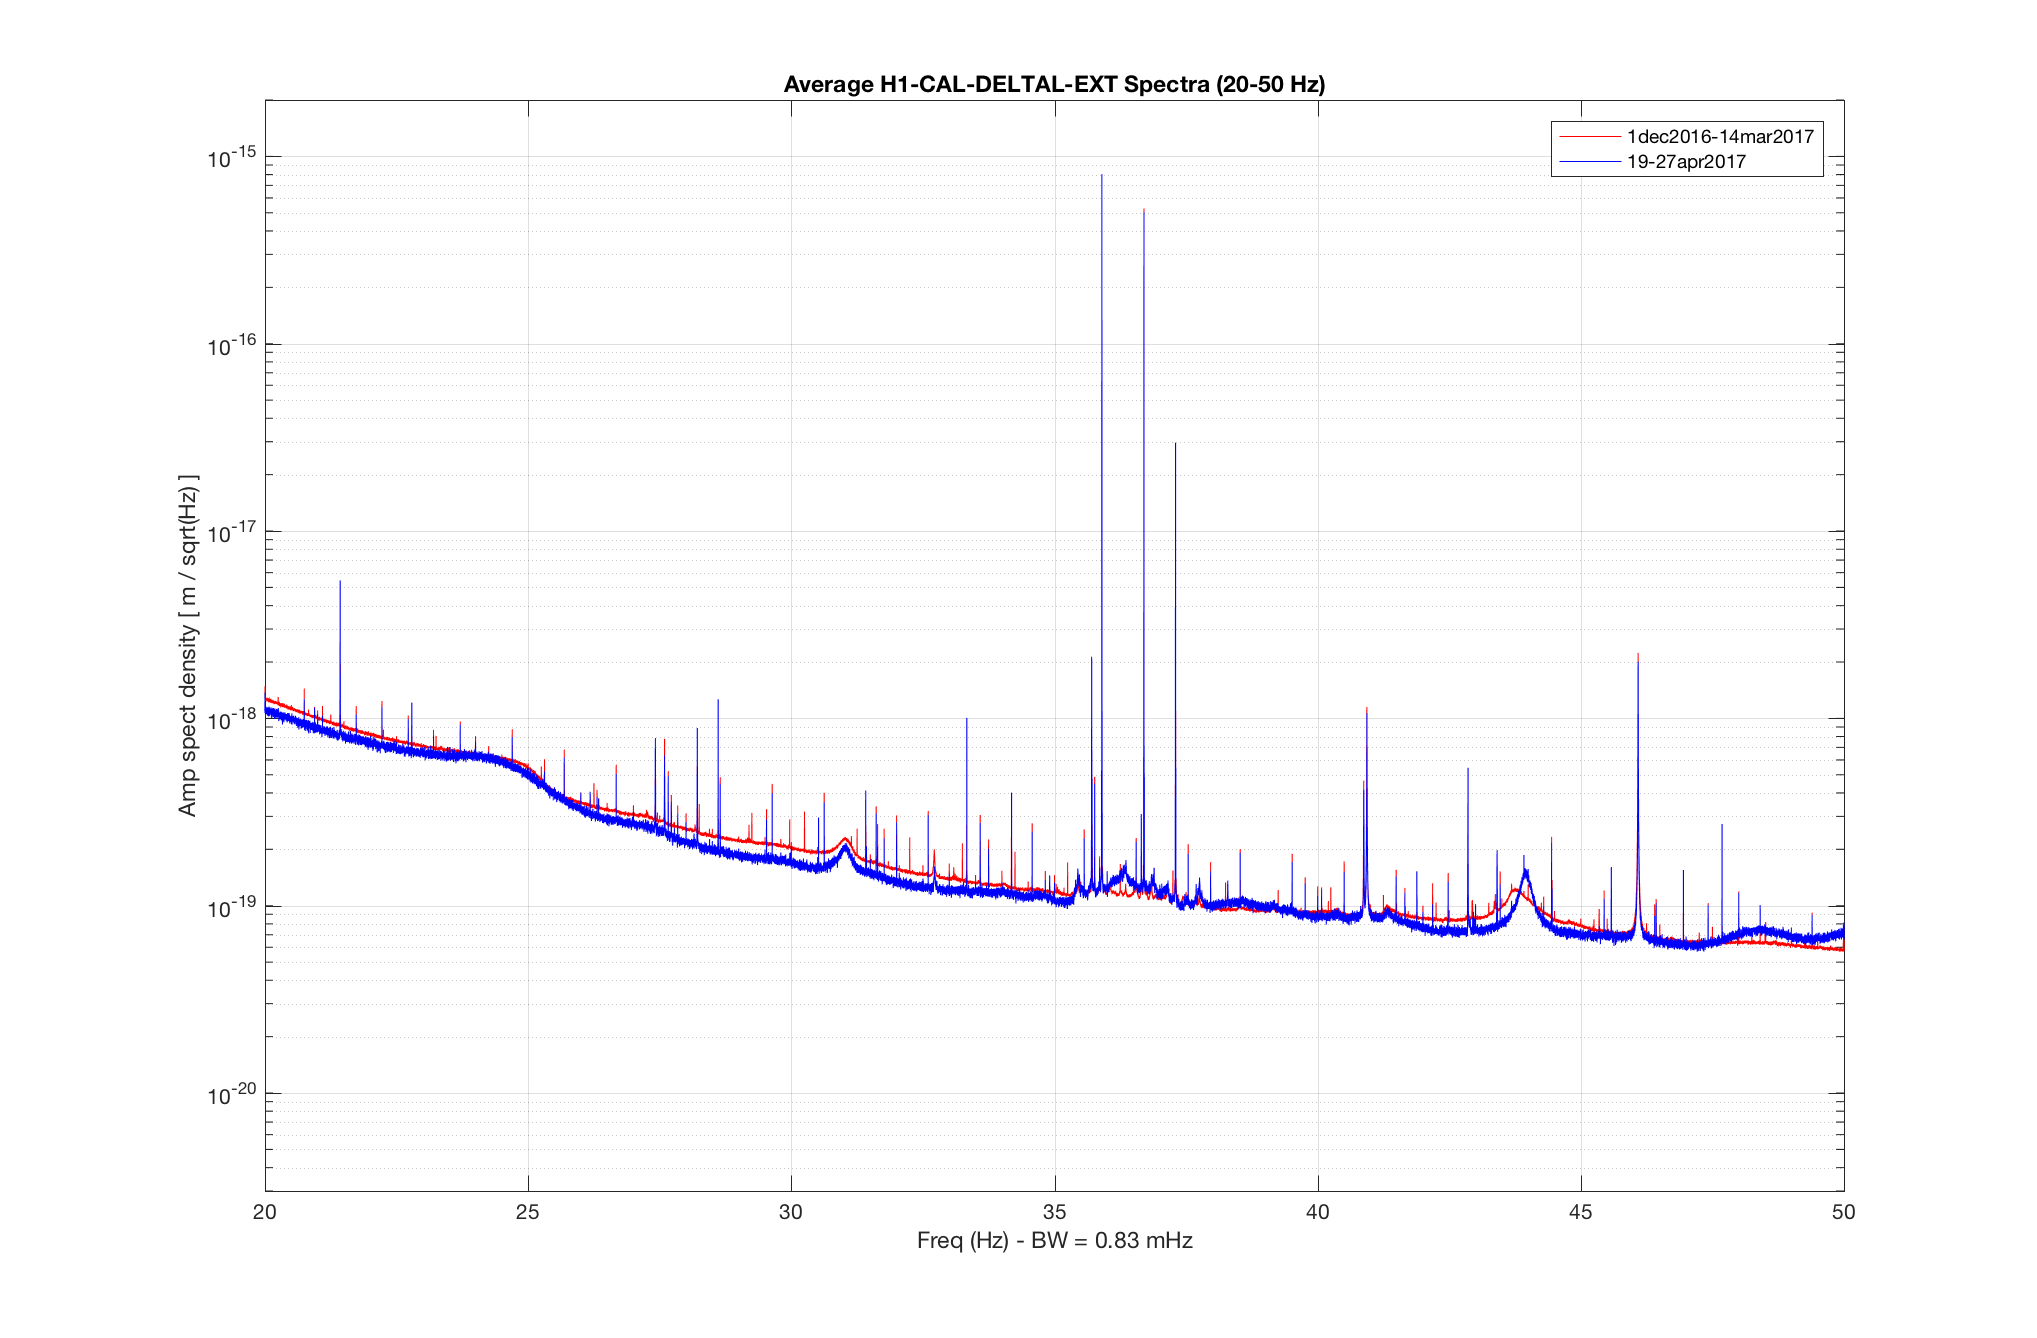
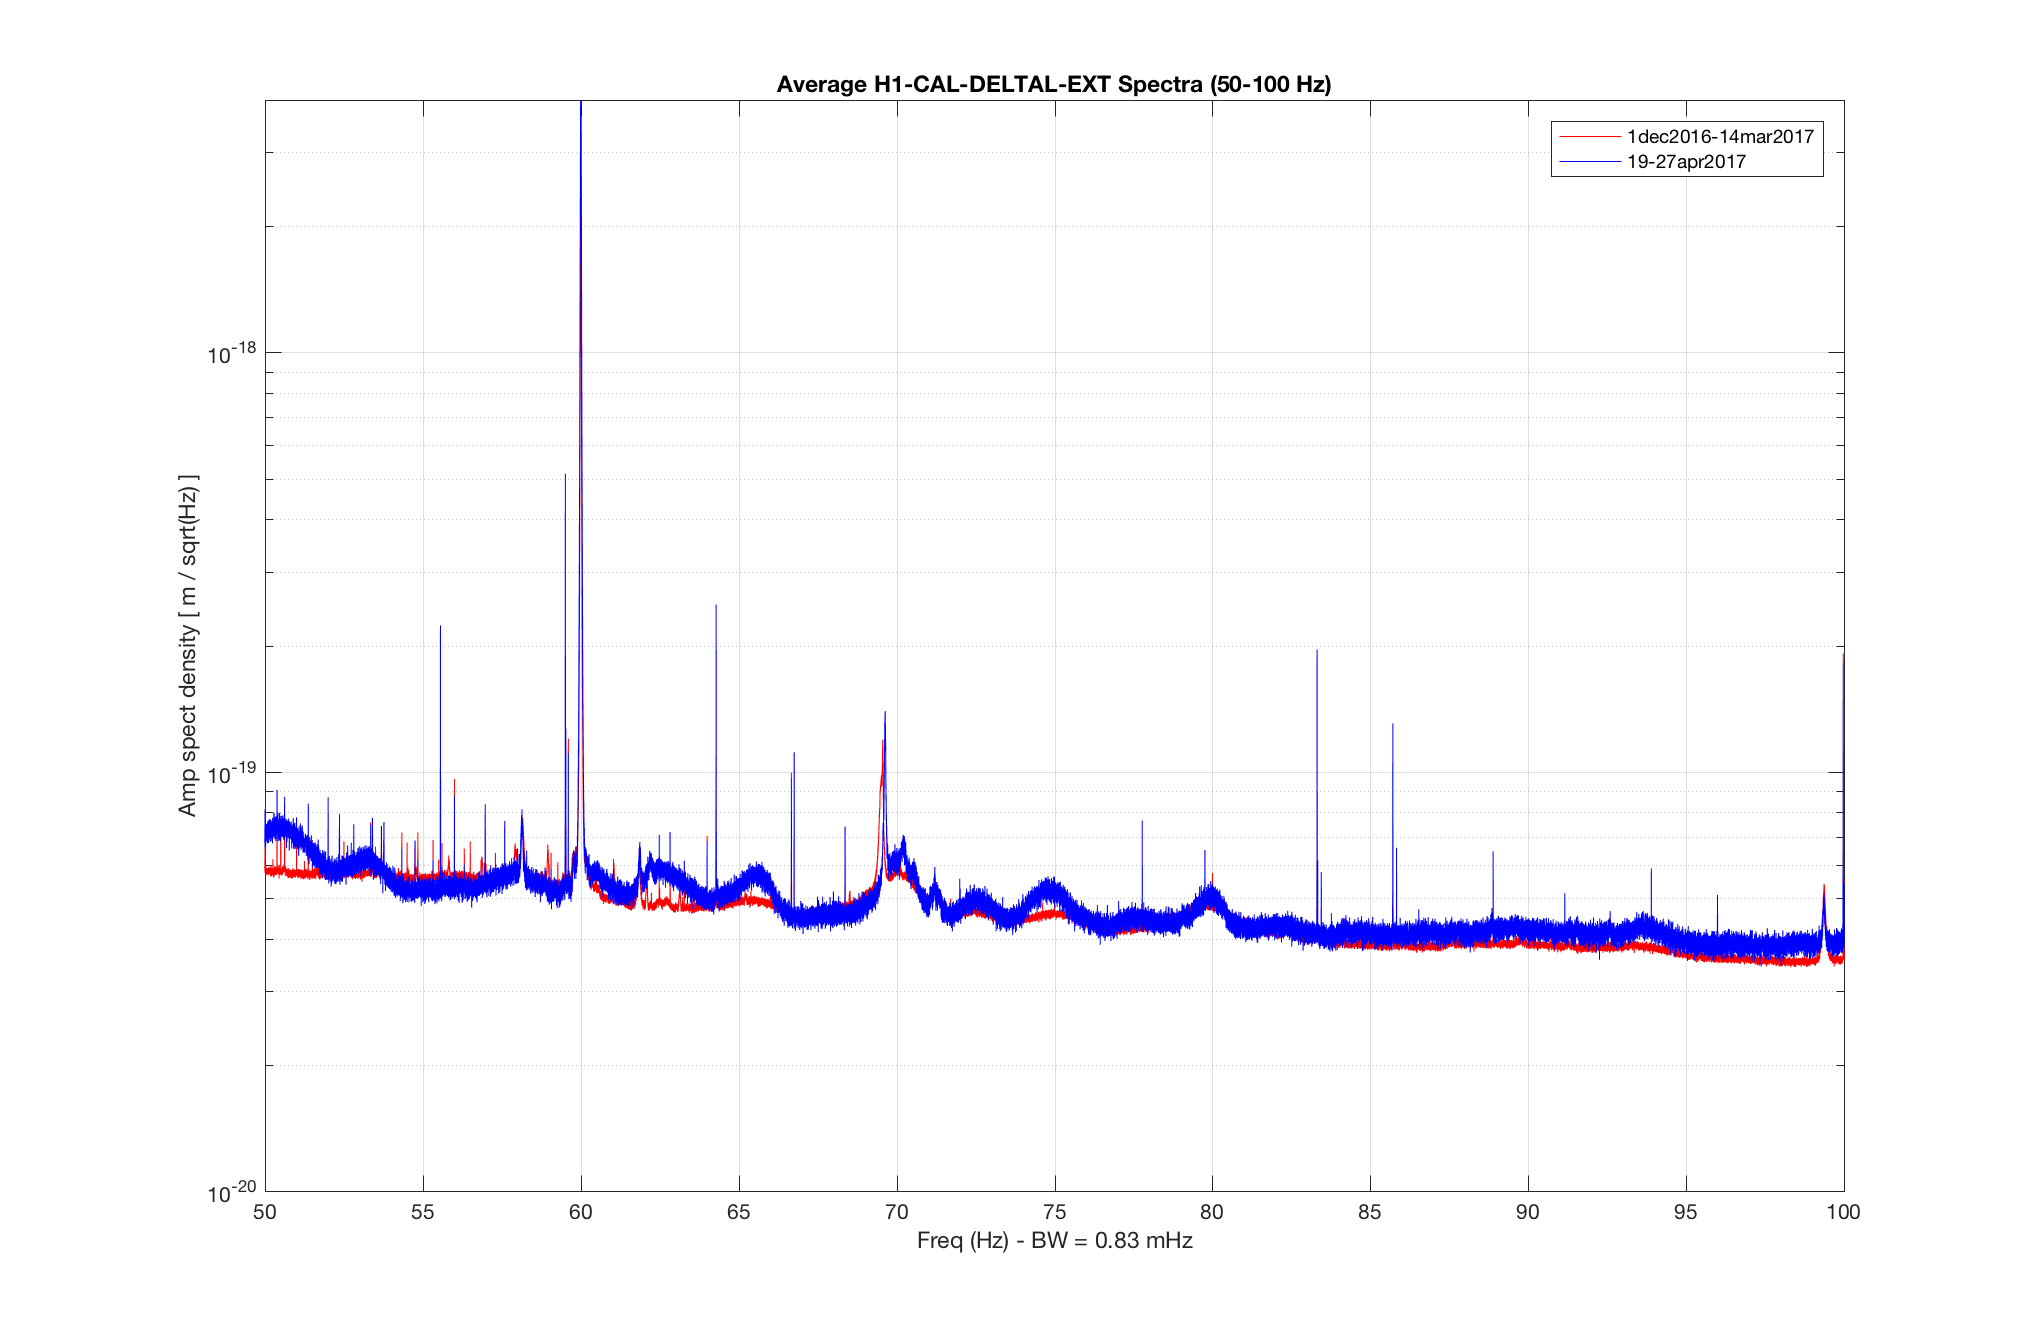
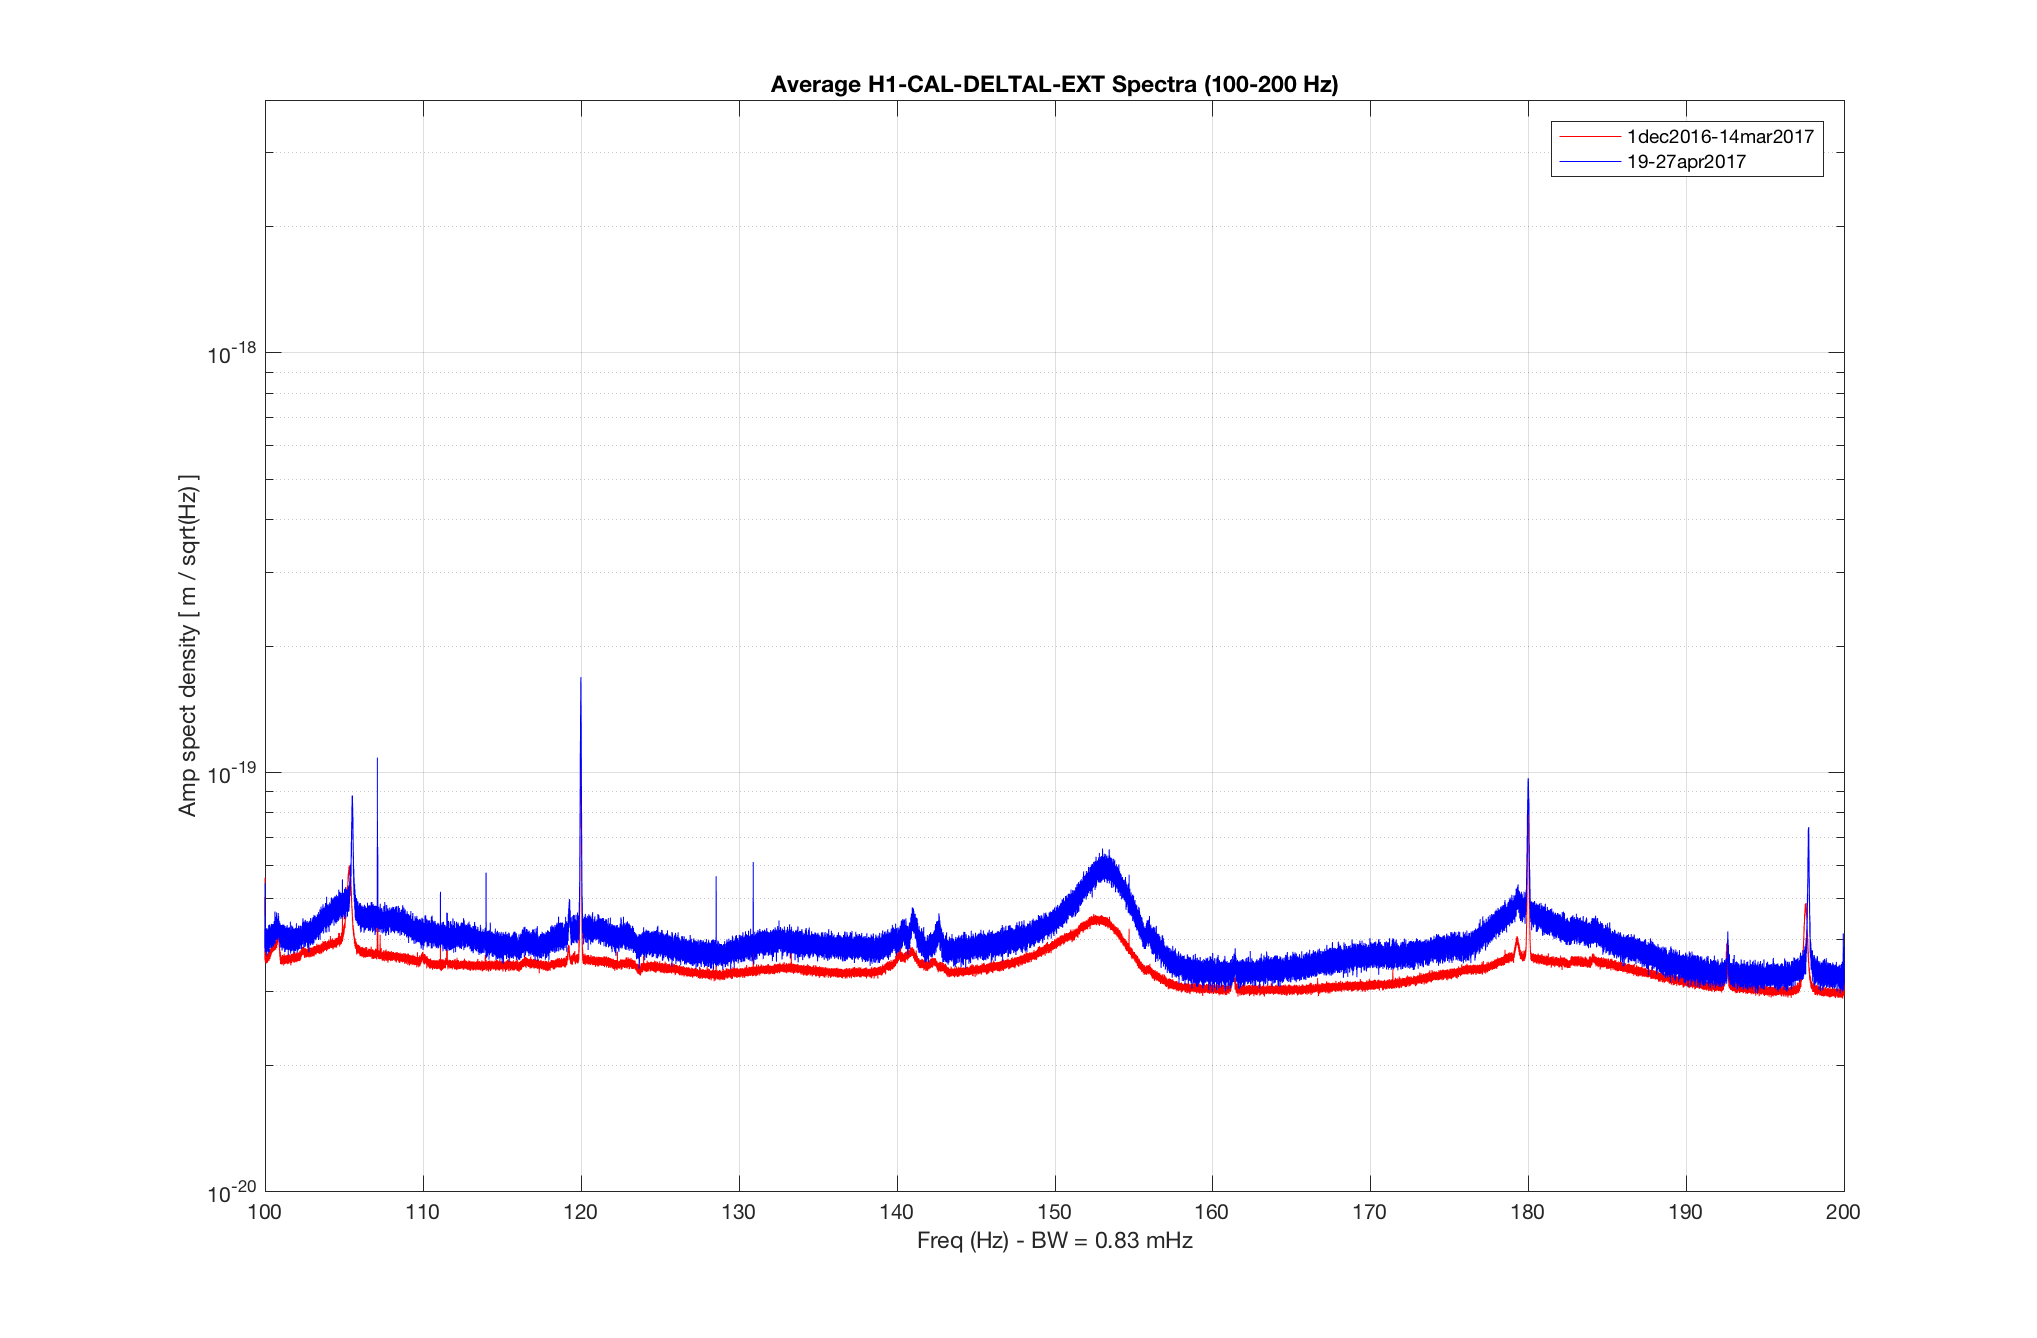
Good work! That did a lot of good in DARM. Attached are spectra in which many narrow lines went
away or were reduced (comparing 22 hours of FScan SFTs before the change (Apr 18) with 10 hours of
SFTs after the change (Apr 19). We will need to collect much more data to verify that all of the
degradation that began March 14 has been mitigated, but this first look is very promising - many thanks!

Fig 1: 20-50 Hz
Fig 2: 50-100 Hz
Fig 3: 100-200 Hz
Images attached to this comment
Attached are post-change spectra using another 15 hours of FScan SFTs since yesterday. Things continue to look good.

Fig 1: 20-50 Hz
Fig 2: 50-100 Hz
Fig 3: 100-200 Hz
Images attached to this comment
Correction: the date is 18/04/2017 UTC.
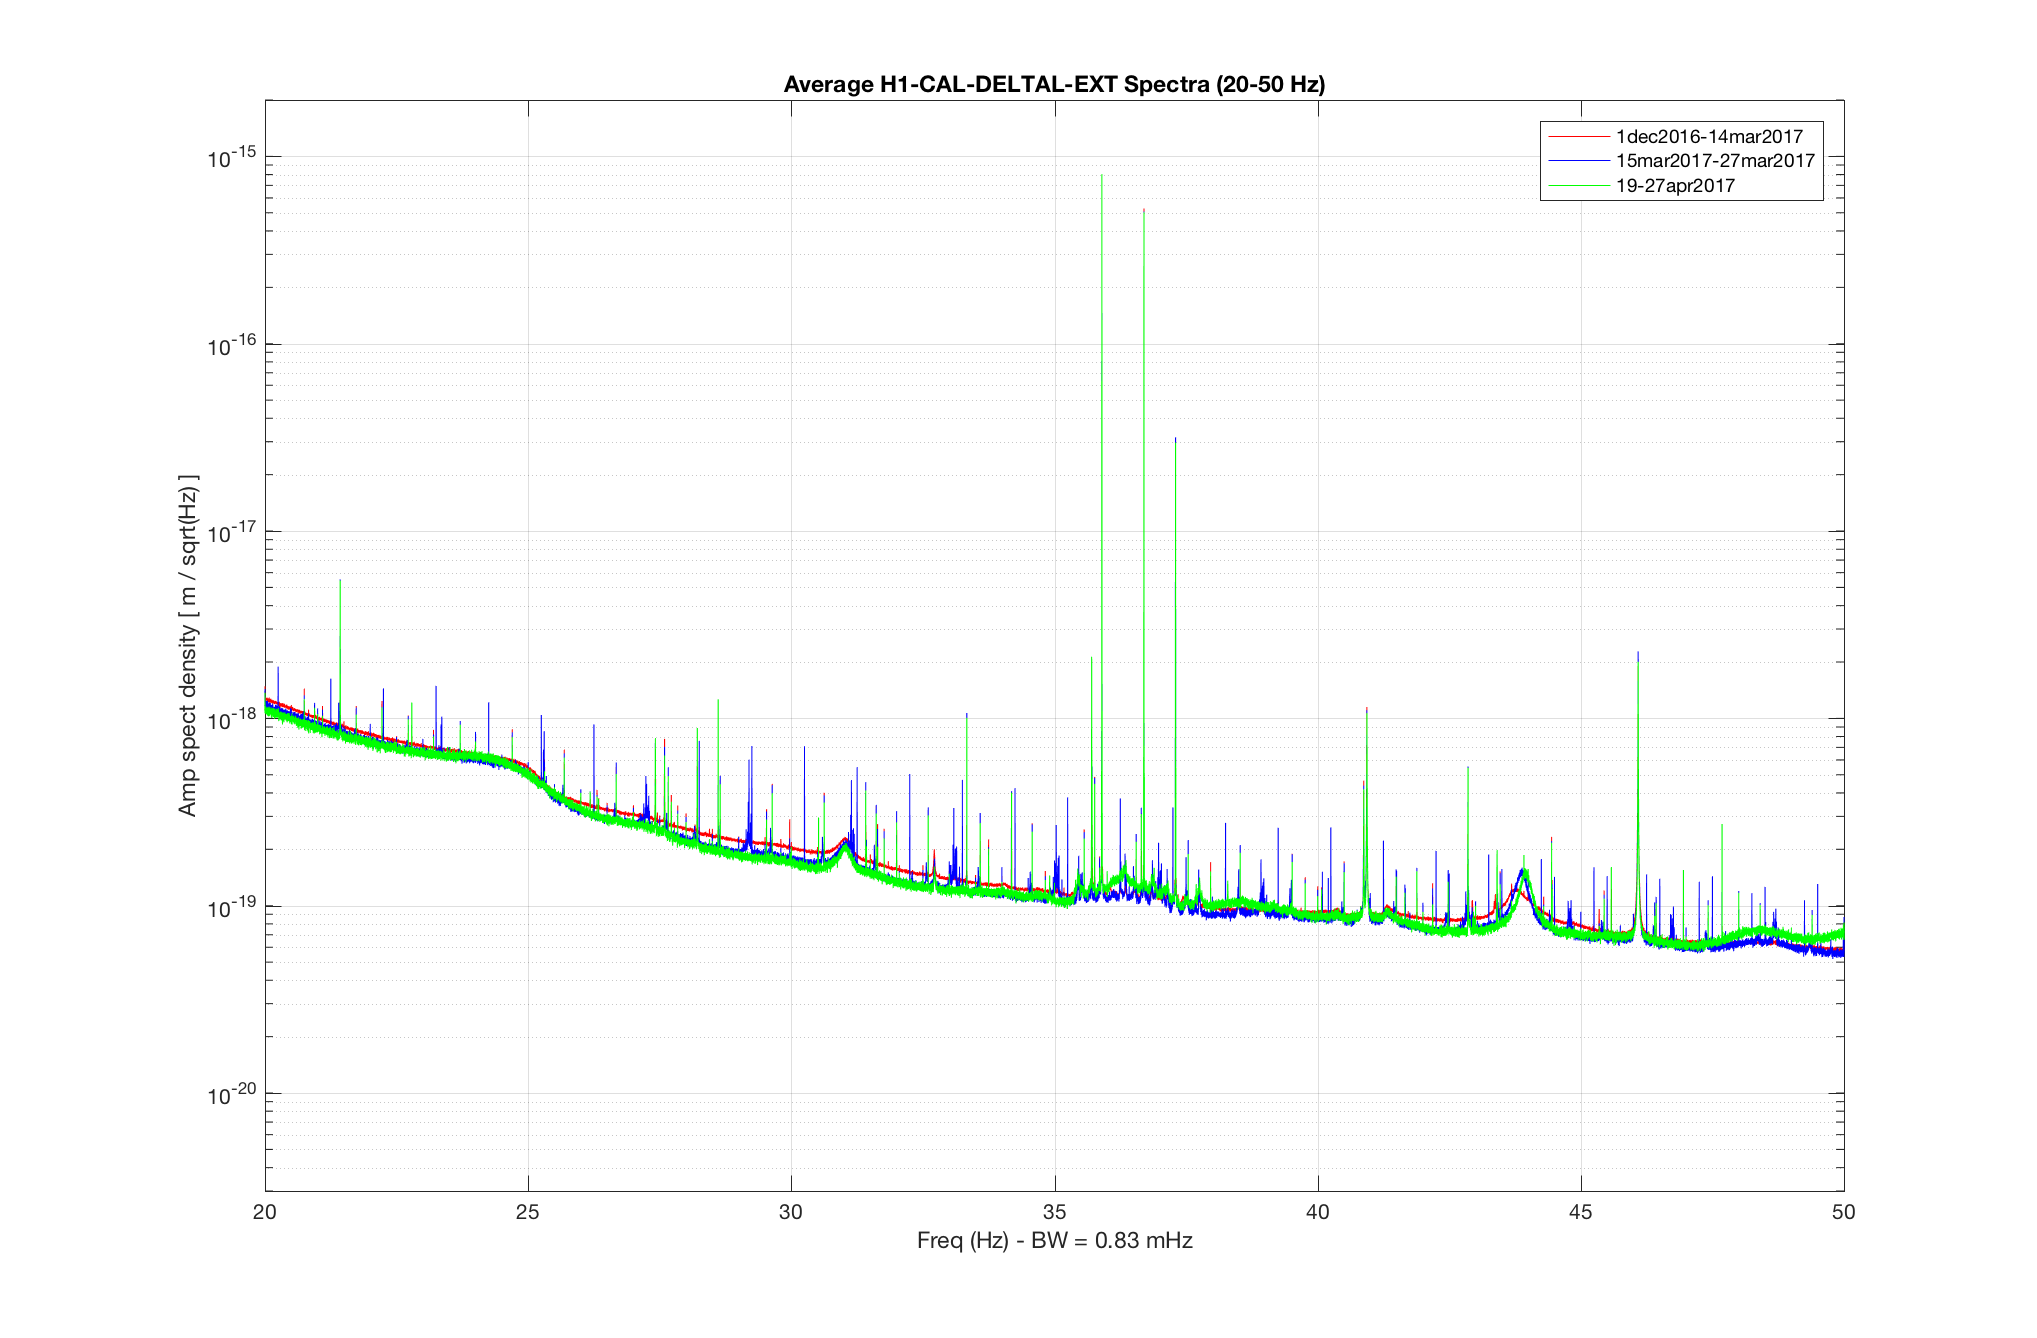
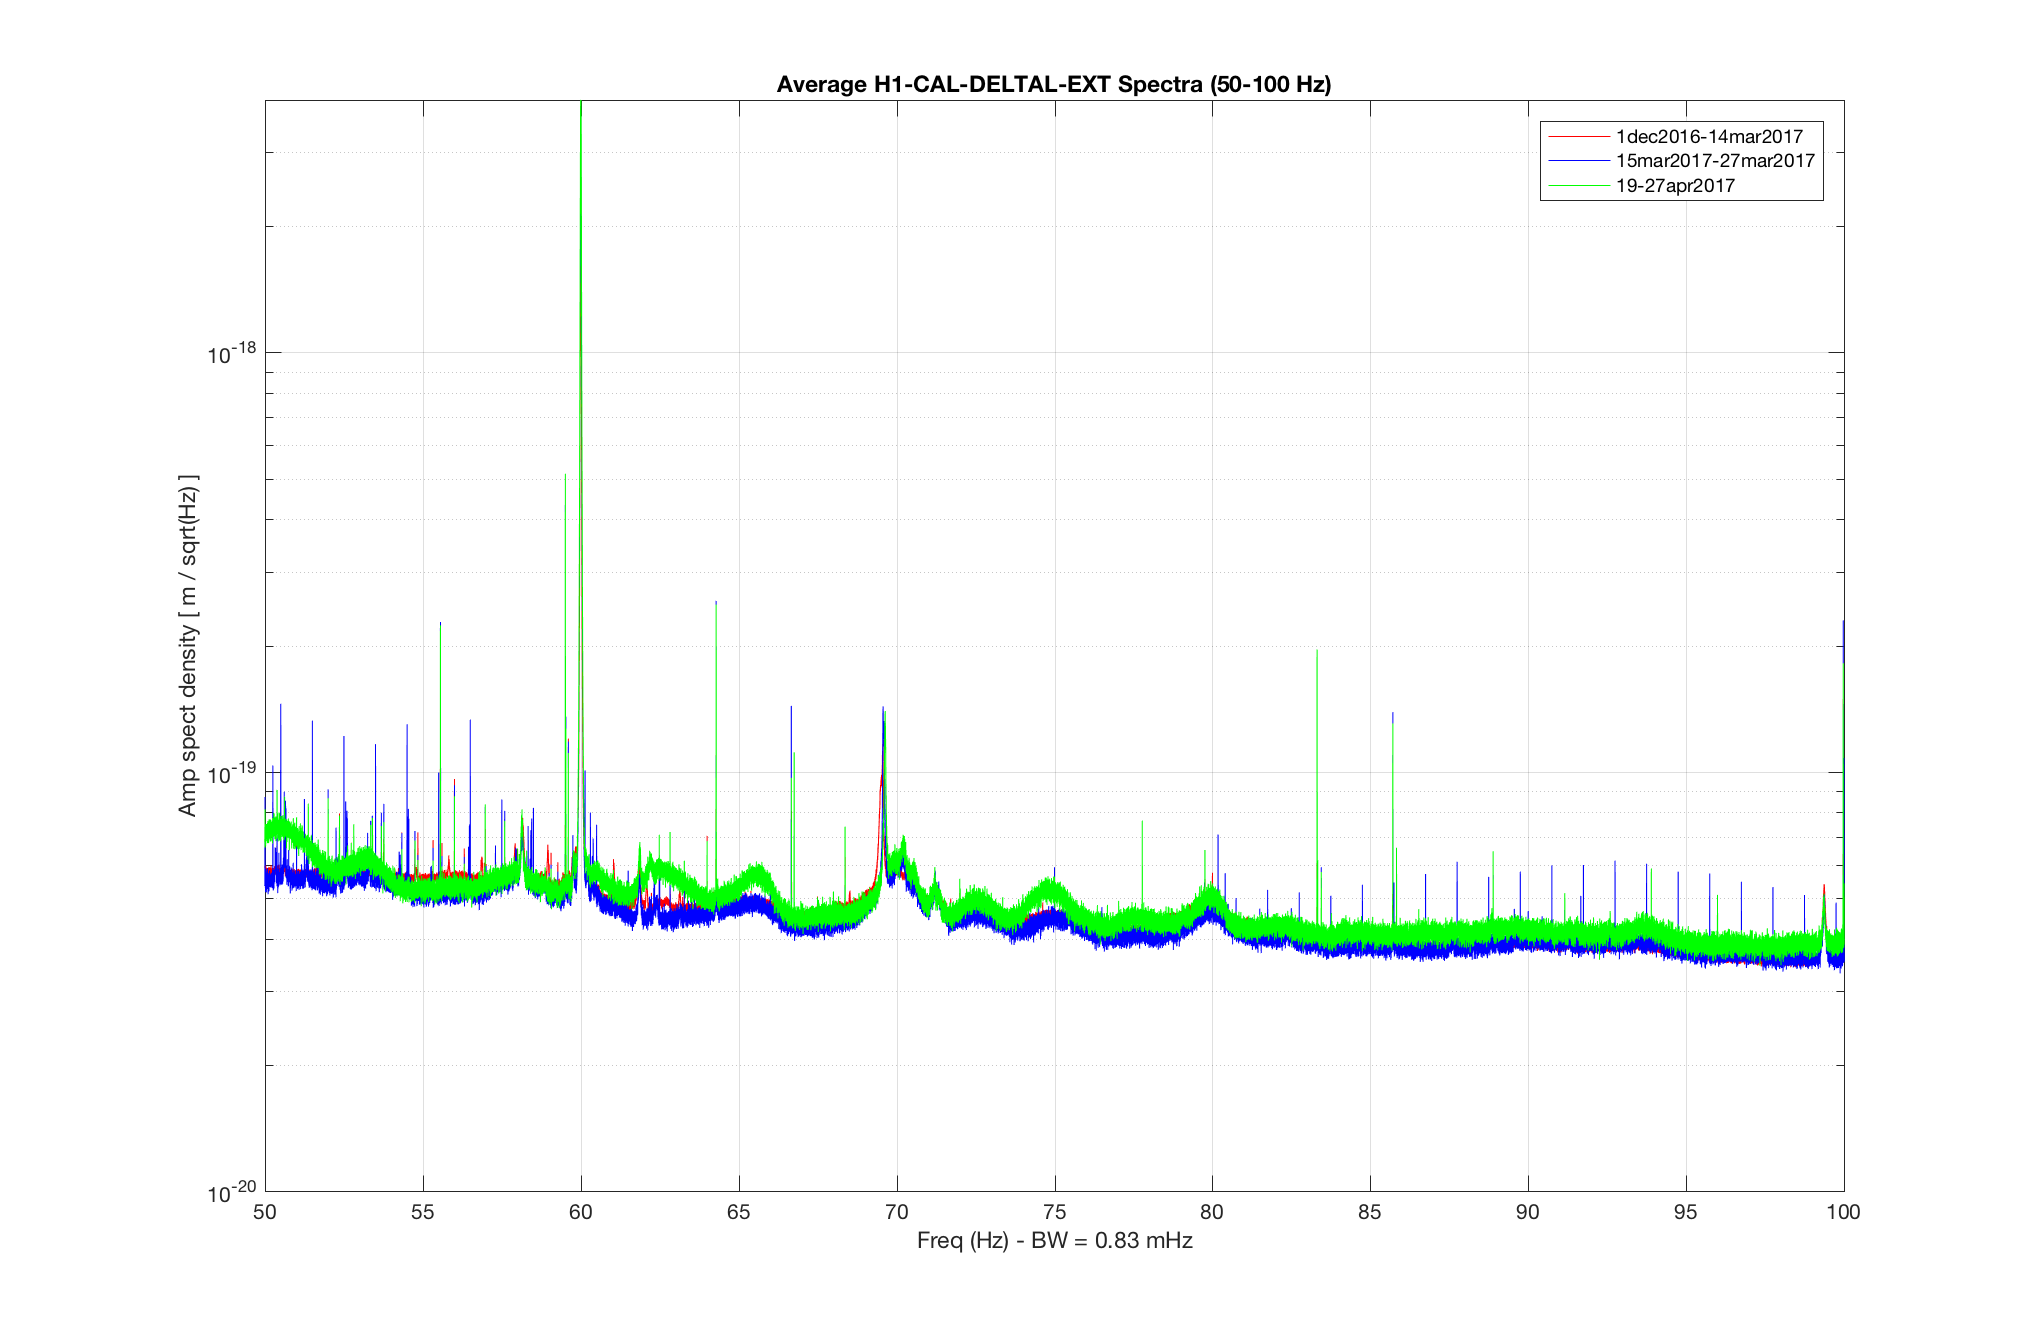
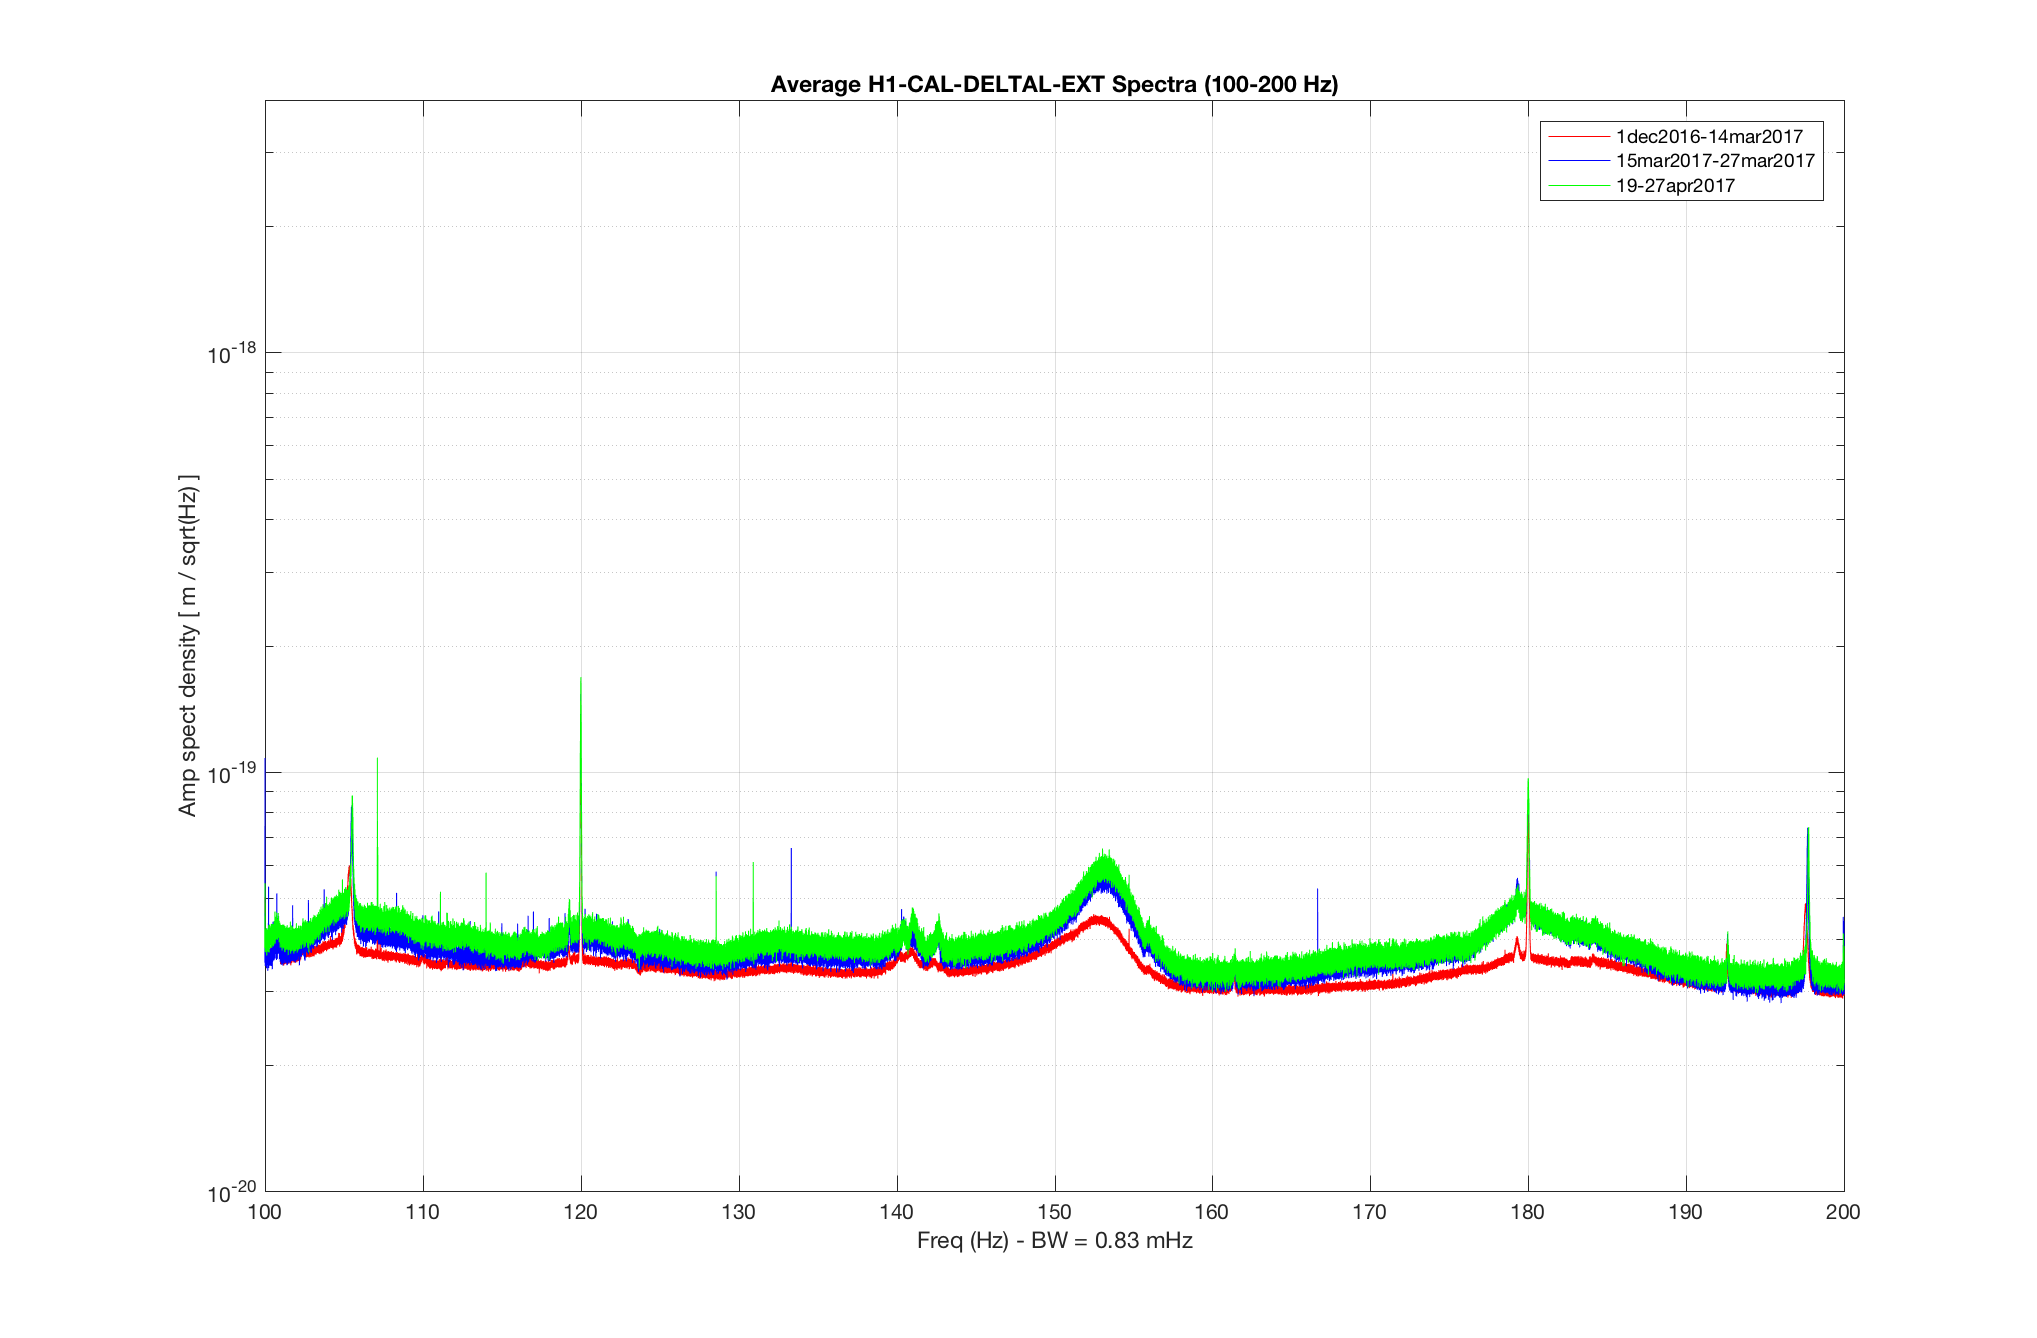
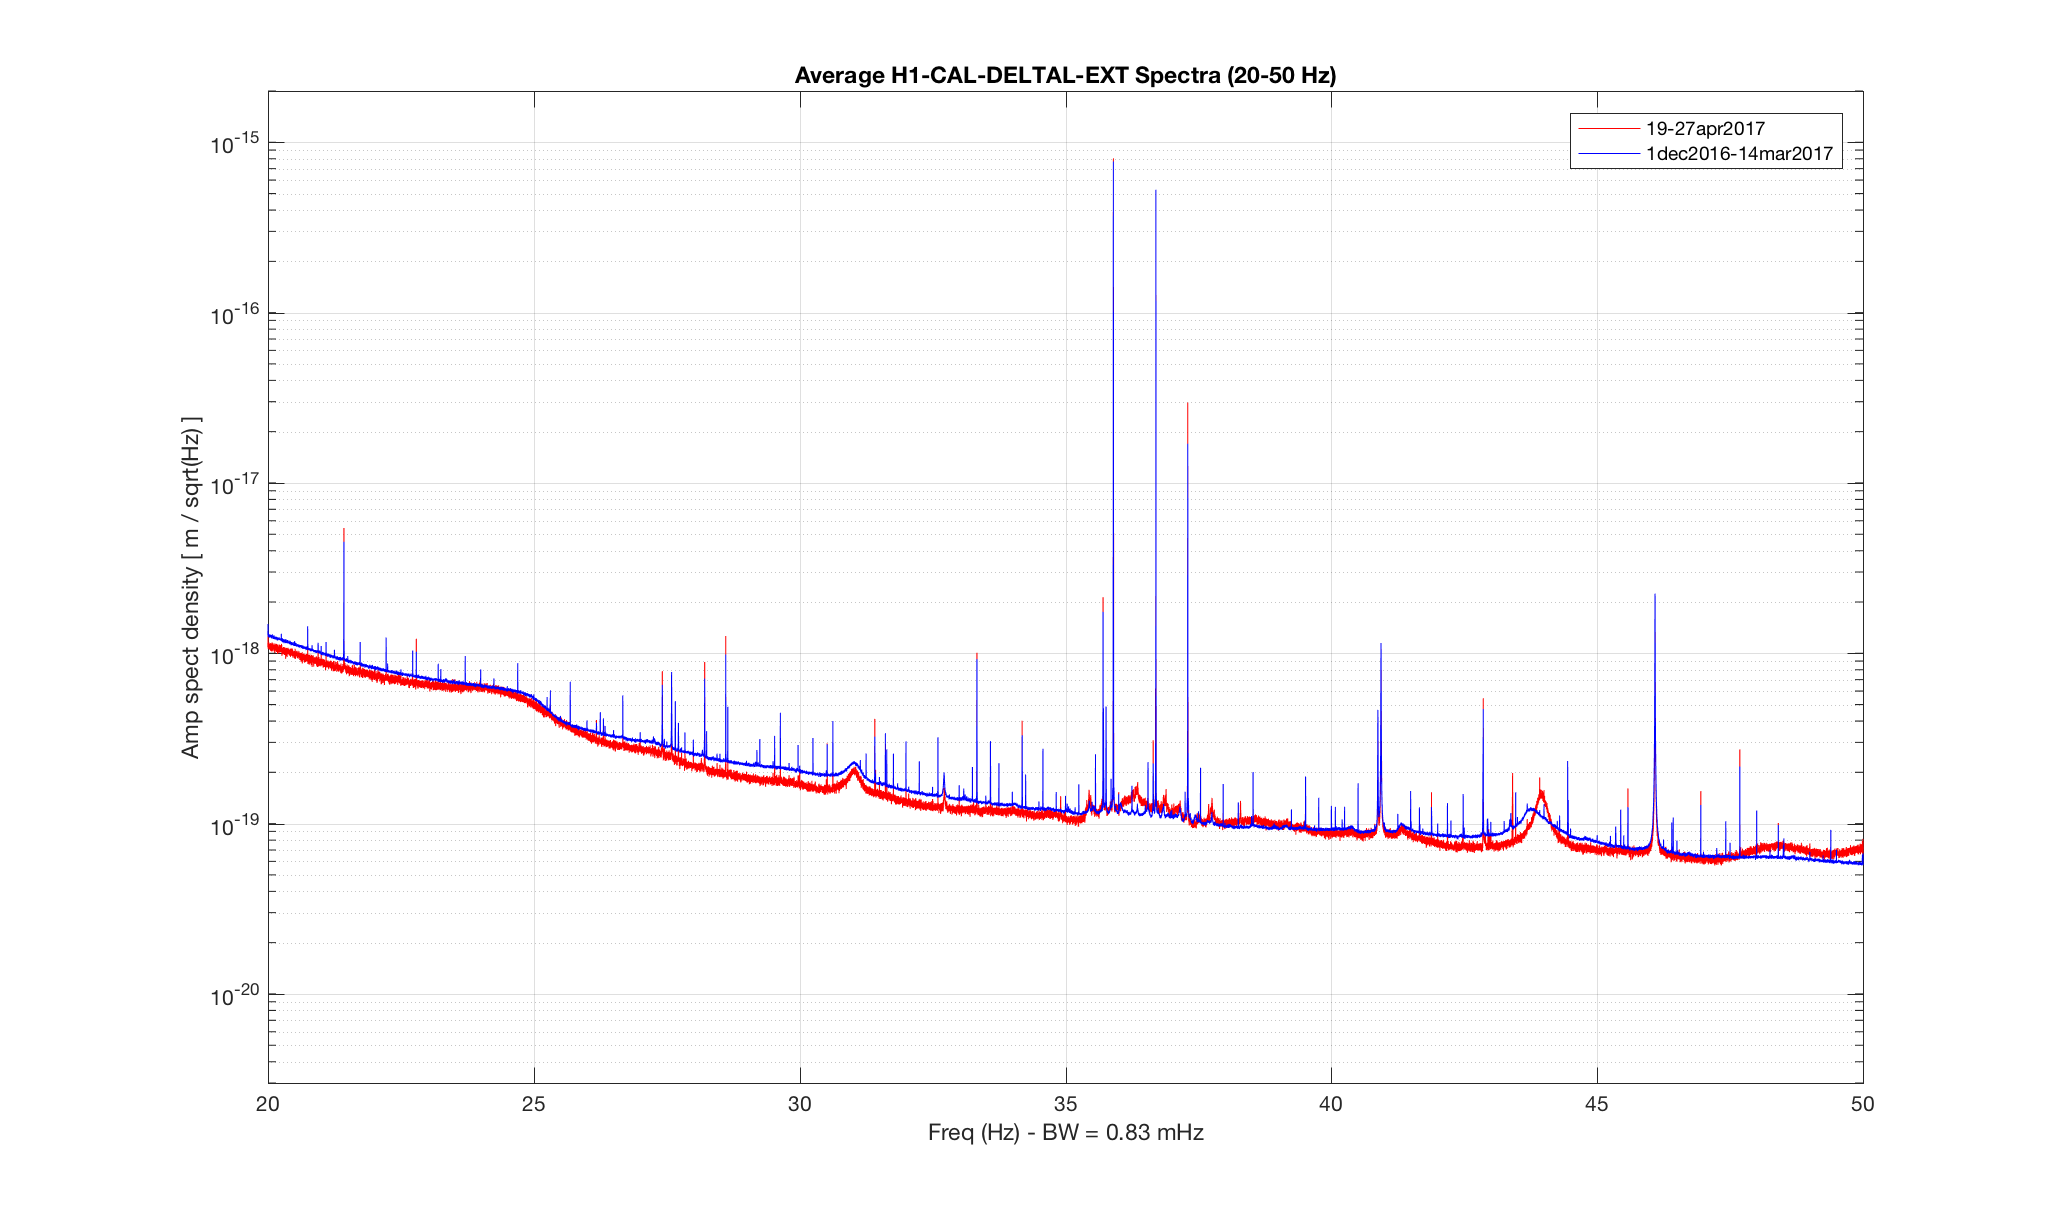
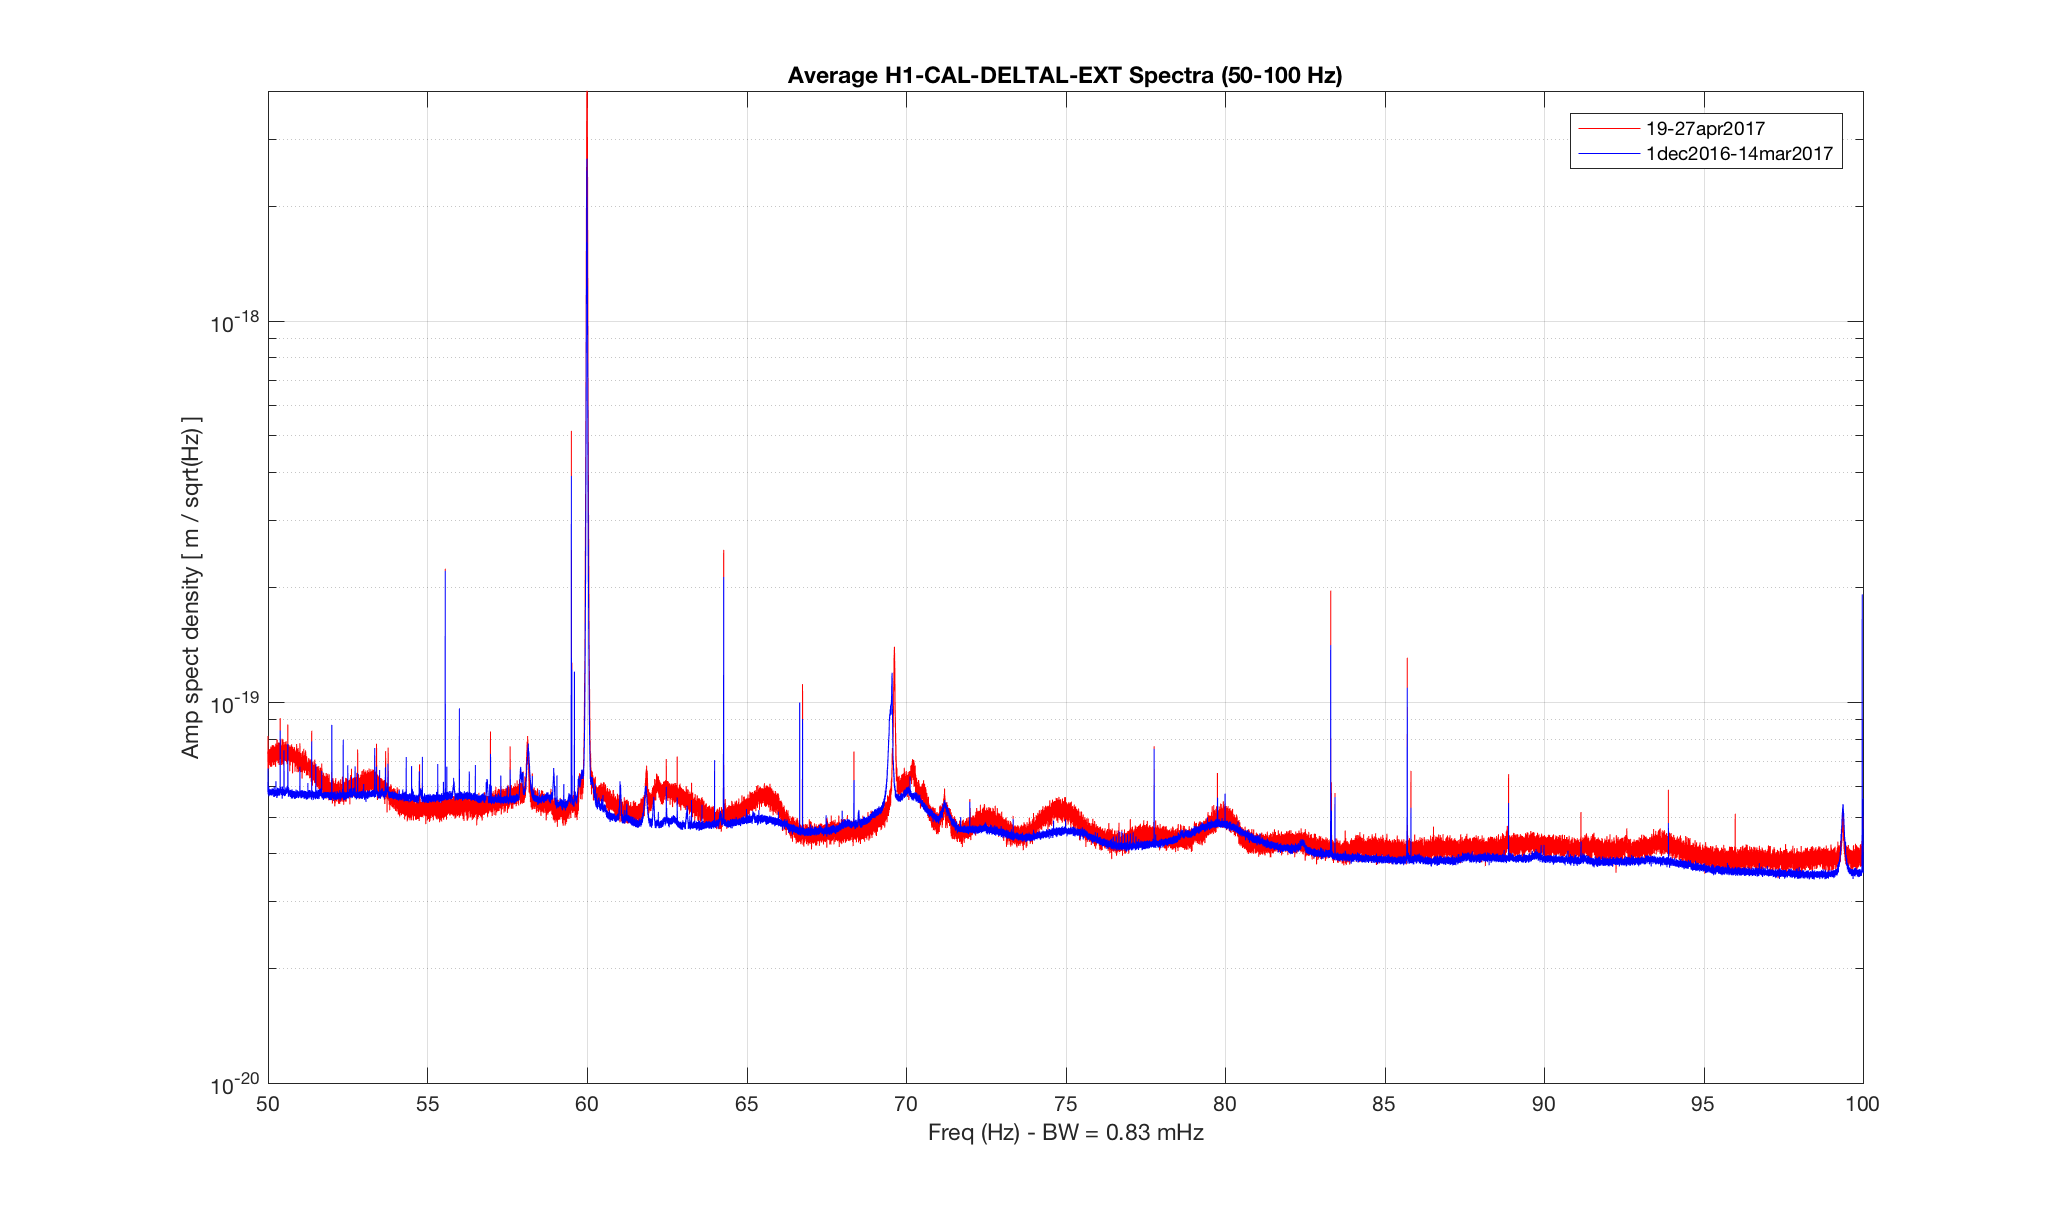
Another follow-up with more statistics. The mitigation from turning off
the ethernet adapter continues to be confirmed with greater certainty.
Figures 1-3 show spectra from pre-March 14 (1210 hours), a sample of
post-March 14 data (242 hours) and post-April 18 (157 hours)
for 20-50 Hz, 50-100 Hz and 100-200 Hz.

With enough post-April 18 statistics, one can also look more closely at
the difference between pre-March 14 and and post-April 18. Figures 4-6
and 7-9 show such comparisons with different orderings and threrefore
different overlays of the curves. It appears there are lines in the post-April 18
data that are stronger than in the pre-March 14 data and lines in the earlier
data that are not present in the recent data. Most notably, 1-Hz combs
with +0.25-Hz and 0.50-Hz offsets from integers have disappeared.

Narrow low-frequency lines that are distinctly stronger in recent data include these frequencies:

21.4286 Hz
22.7882 Hz - splitting of 0.0468 Hz
27.4170 Hz
28.214 Hz
28.6100 Hz - PEM in O1
31.4127 Hz and 2nd harmonic at  62.8254 Hz
34.1840 Hz
34.909 Hz (absent in earlier data)
41.8833 Hz
43.409 Hz (absent in earlier data)
43.919 Hz
45.579 Hz
46.9496 Hz
47.6833 Hz
56.9730 Hz
57.5889 Hz
66.7502 Hz (part of 1 Hz comb in O1)
68.3677 Hz
79.763 Hz
83.315 Hz
83.335 Hz
85.7139 Hz
85.8298 Hz
88.8895 Hz
91.158 Hz
93.8995 Hz
95.995 Hz (absent in earlier data)
107.1182 Hz
114.000 Hz (absent in earlier data)

Narrow low-frequency lines in the earlier data that no longer appear include these frequencies:

20.25 Hz - 50.25 Hz (1-Hz comb wiped out!)
24.50 Hz - 62.50 Hz (1-Hz comb wiped out!)
29.1957 Hz
29.969 Hz


Note that I'm not claiming change points occurred  for the above lines on March 14 (as I did for the
original set of lines flagged) or on April 18. I'm merely noting a difference in average line strengths
before March 14 vs after April 18. Change points could have occurred between March 14 and April 18,
shortly before March 14 or shortly after April 18.
Images attached to this comment
To pin down better when the two 1-Hz combs disappeared from DARM,
I checked Ansel's handy-dandy comb tracker and found the answer immediately.

The two attached figures (screen grabs) show the summed power in the teeth of those combs.
The 0.5-Hz offset comb is elevated before March 14, jumps up after March 14
and drops down to normal after April 18. The 0.25-Hz offset comb is highly
elevated before March 14, jumps way up after March 14 and drops down to normal
after April 18.

These plots raise the interesting question of what was done on April 18 that
went beyond the mitigation of the problems triggered on March 14.

Figure 1 - Strength of 1-Hz comb (0.5-Hz offset) vs time (March 14 is day 547 after 9/15/2014, April 18 is day 582)

Figure 2 - Strength of 1-Hz comb (0.25-Hz offset) vs time
Images attached to this comment

