sheila.dwyer@LIGO.ORG - posted 19:48, Friday 16 June 2017 (36957)
POP spot move improves DARM
While LLO was down we took a few minutes to continue the POP spot scan that I started yesterday. (36920) I left the spot in the lower jitter location.
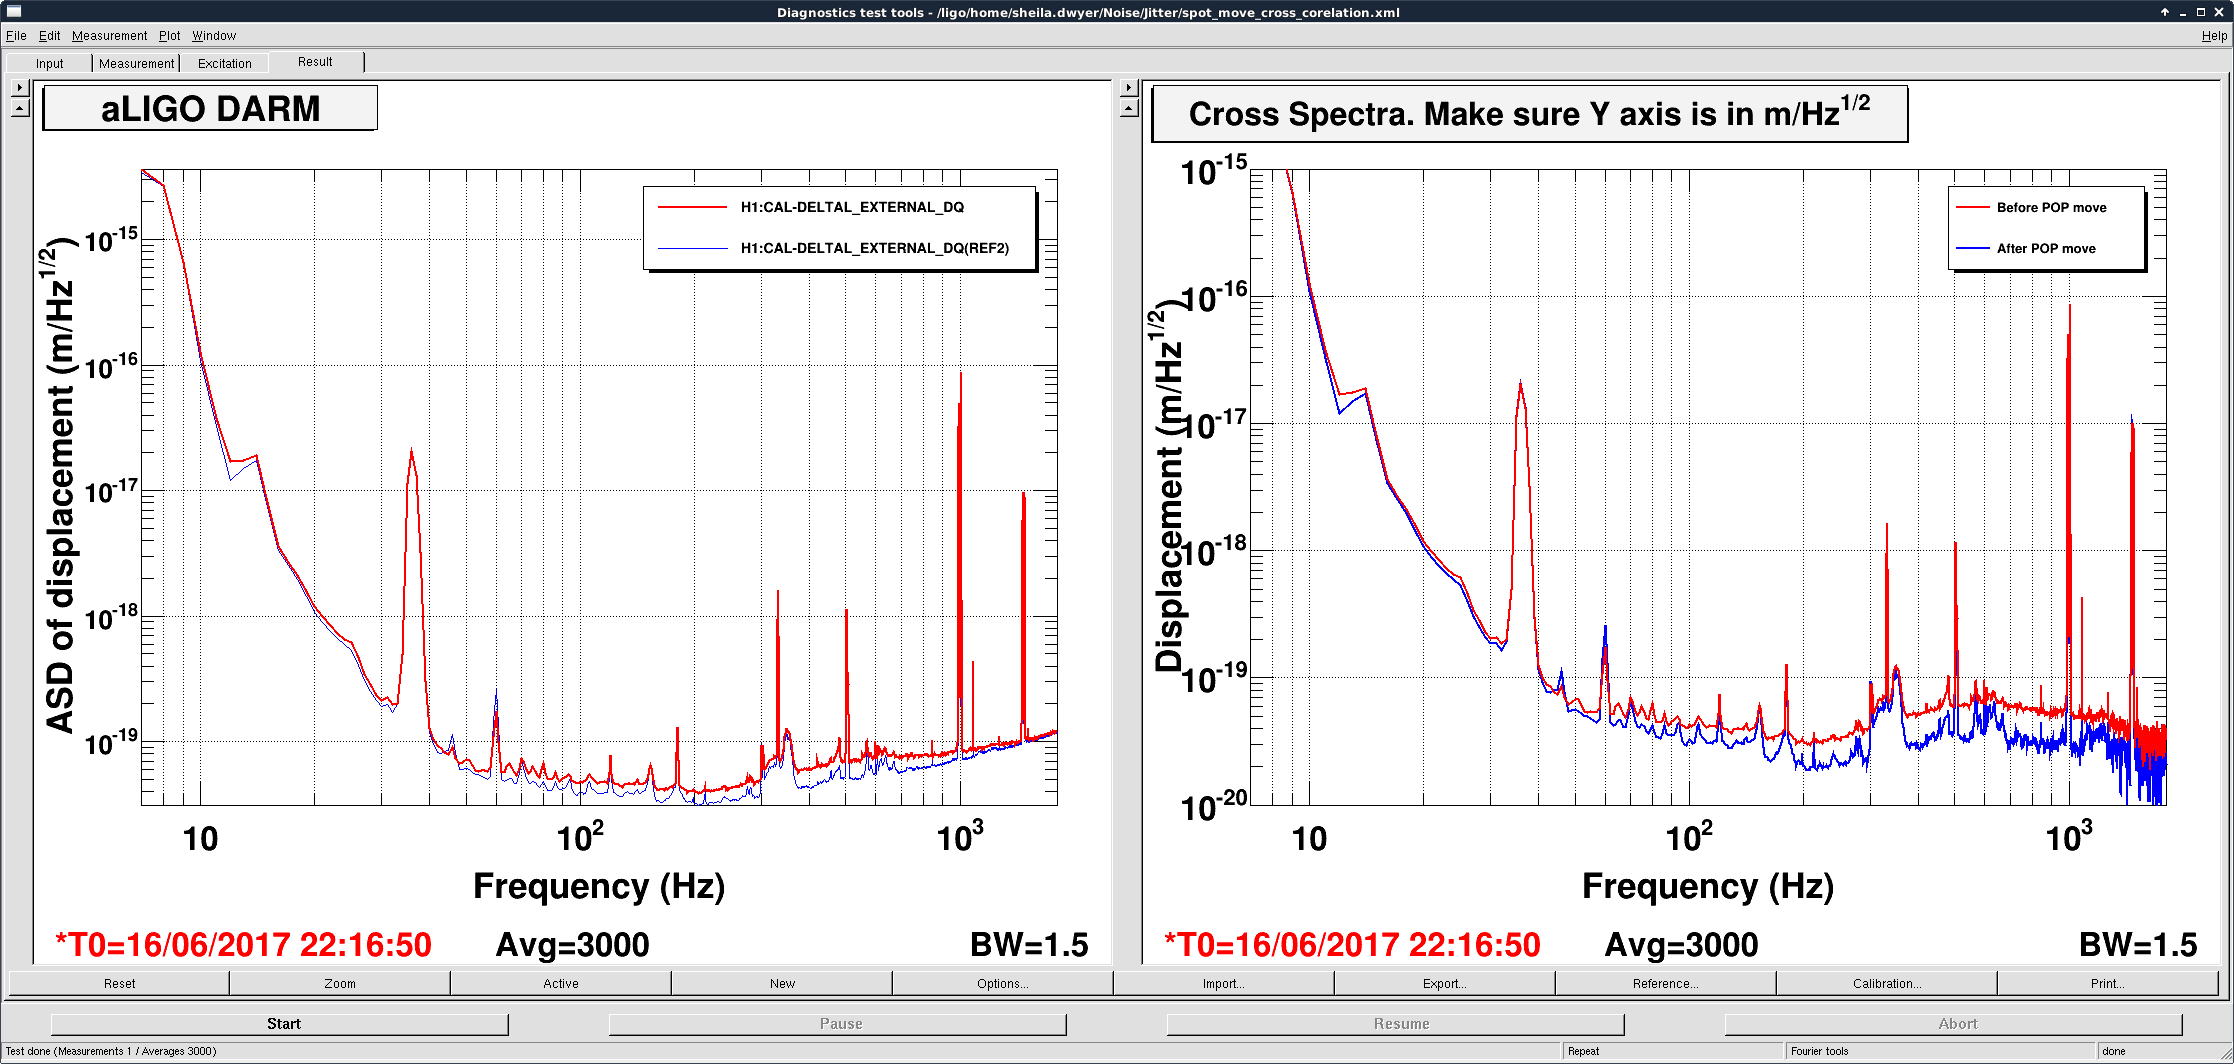
- The first attached screenshot shows the improvement in the DARM spectrum and the DCPD cross correlation from today's POP move. It appears that the NS range is about 10 Mpc better, but the seismic environment is also changing.(EQ arriving, winds dying down).
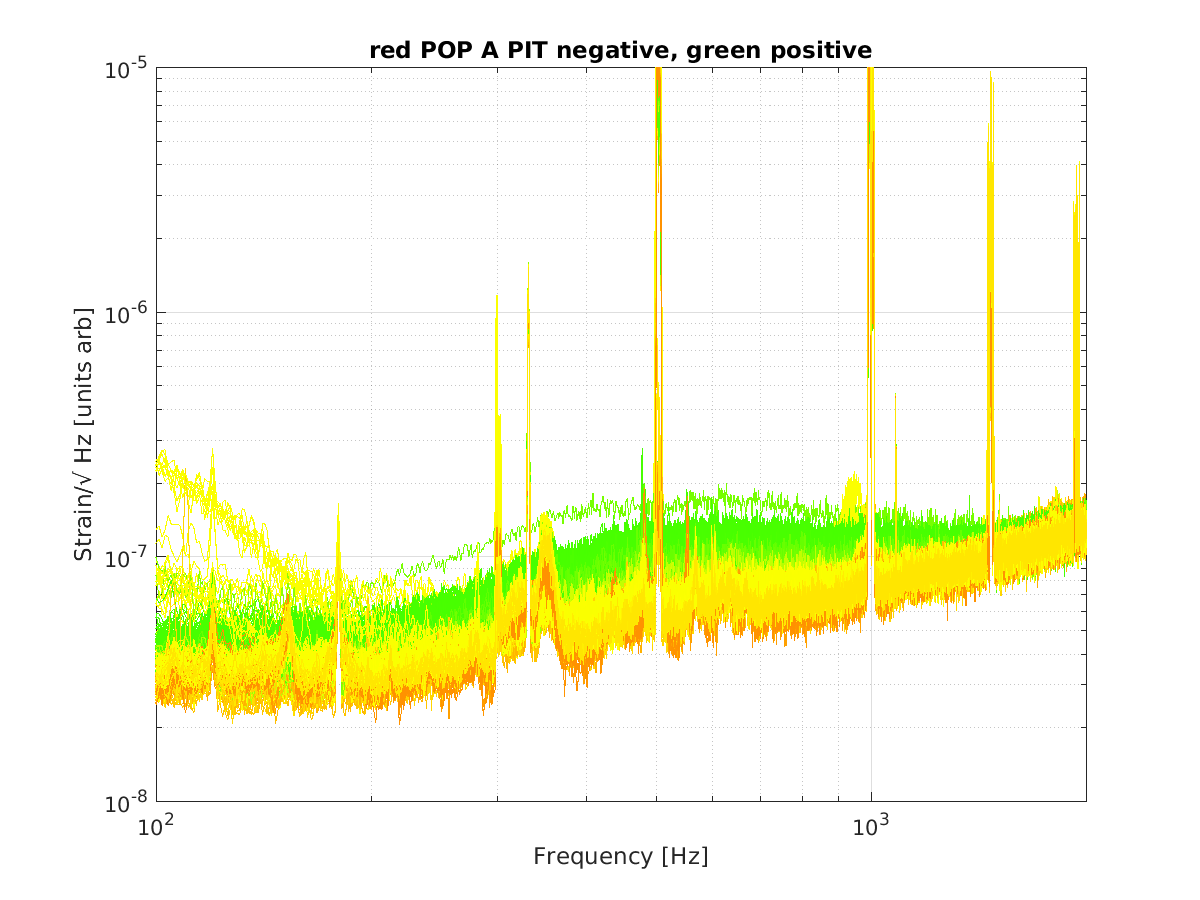
- I downloaded data from 6 times when I moved the POP position in the last two days, and took spectra every 20 seconds during the moves. The second attachment gives you an idea of the variety of spectra we can get by moving the position, the color scale is set so that a spectra taken when POP A pit was 1 would be red, and a spectra taken at +- would be green. The same plot for yaw is less dramatic.
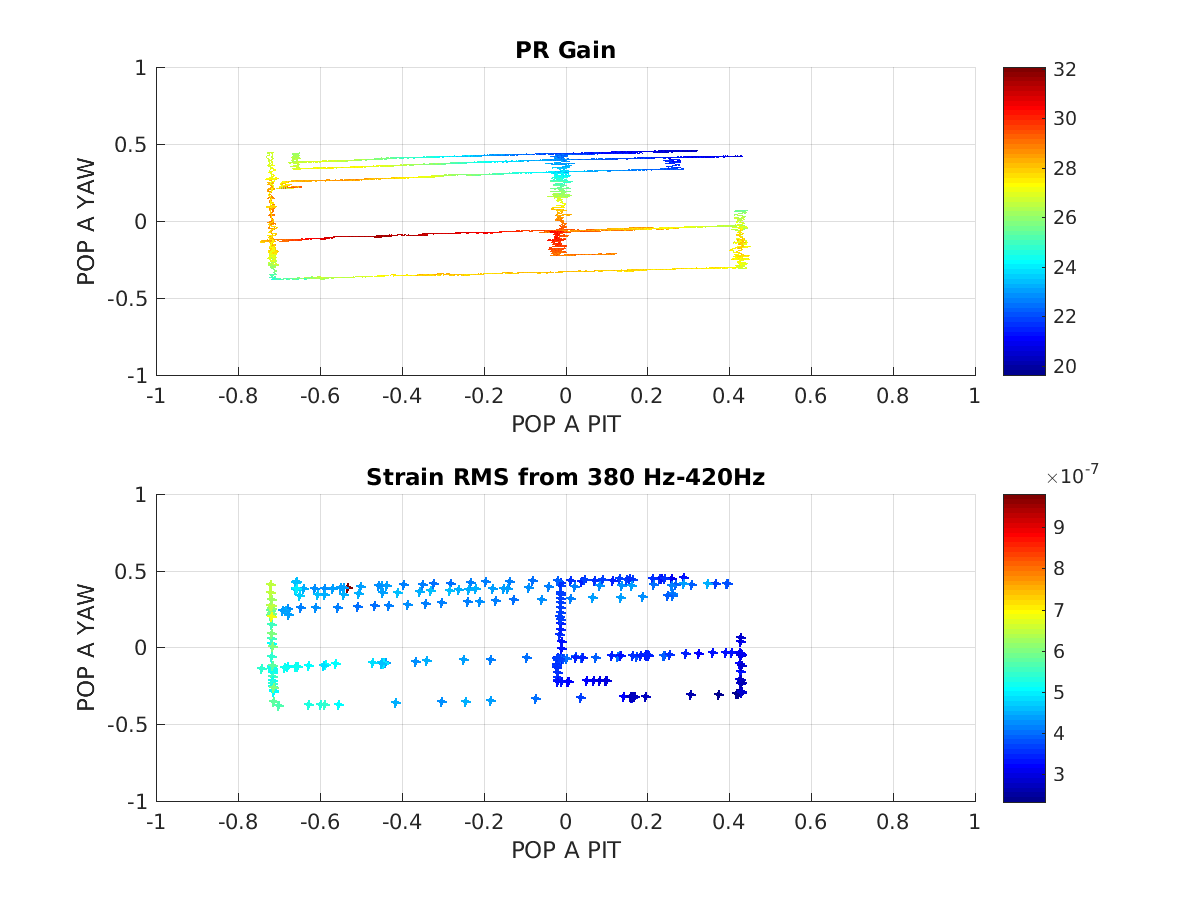
- The third attached plot shows the recycling gain, and the strain rms around 400 Hz (which is dominated by the noise which is coherent with the bullseye), plotted against the position on POP A. During todays short commissioning break we started roughly in the center of the QPD and moved to 0.15 in pit and -0.2 in YAW. We may be able to reduce the broad jitter coupling to DARM further by moving further in this direction, at the cost of somewhat lower recycling gain.
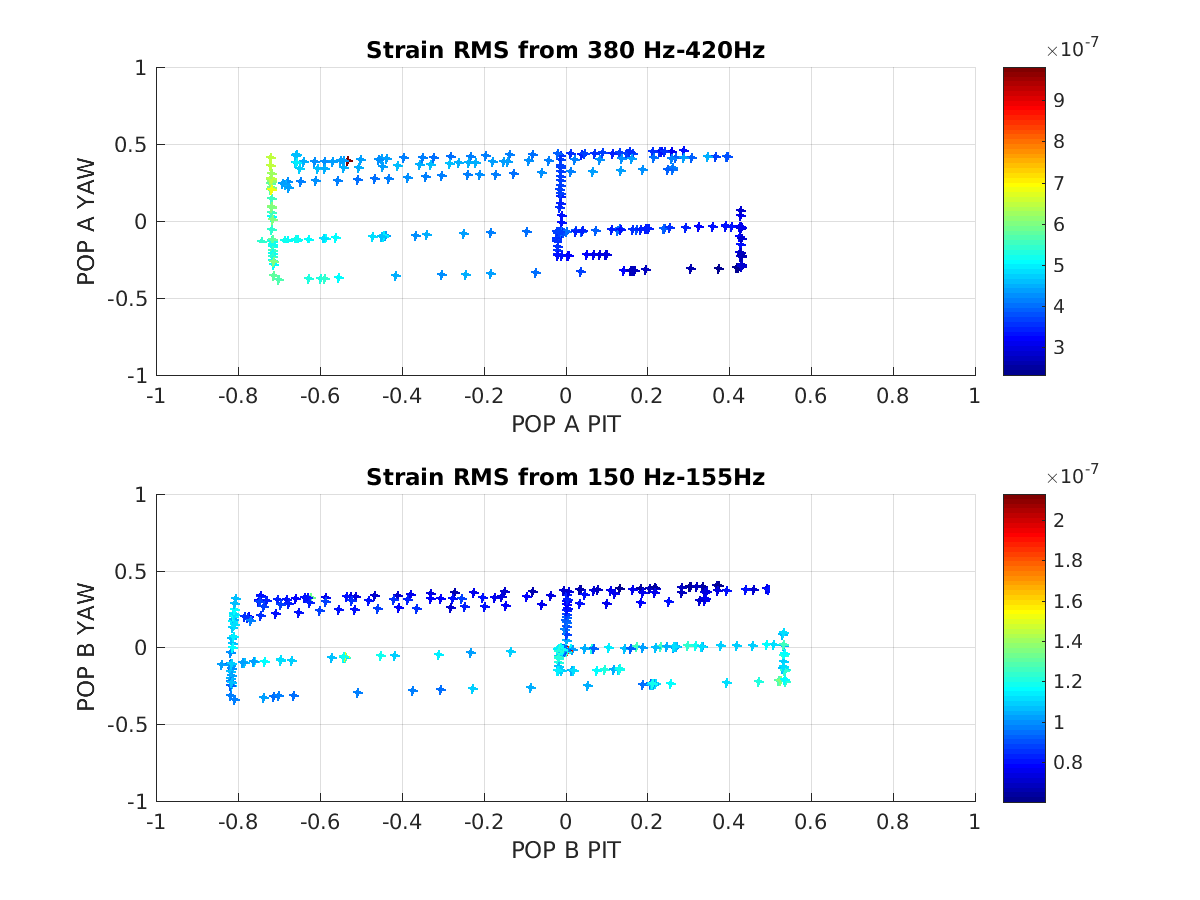
- The 4th attachment is a similar plot but allows you to compare the broad jitter peak (RMS around 500 Hz) to one of the jitter peaks that is from a structure on the PSL and best seem using the IMC WFS DC. The spot position which is best for the braod jitter isn't the same as what is best for the peak.
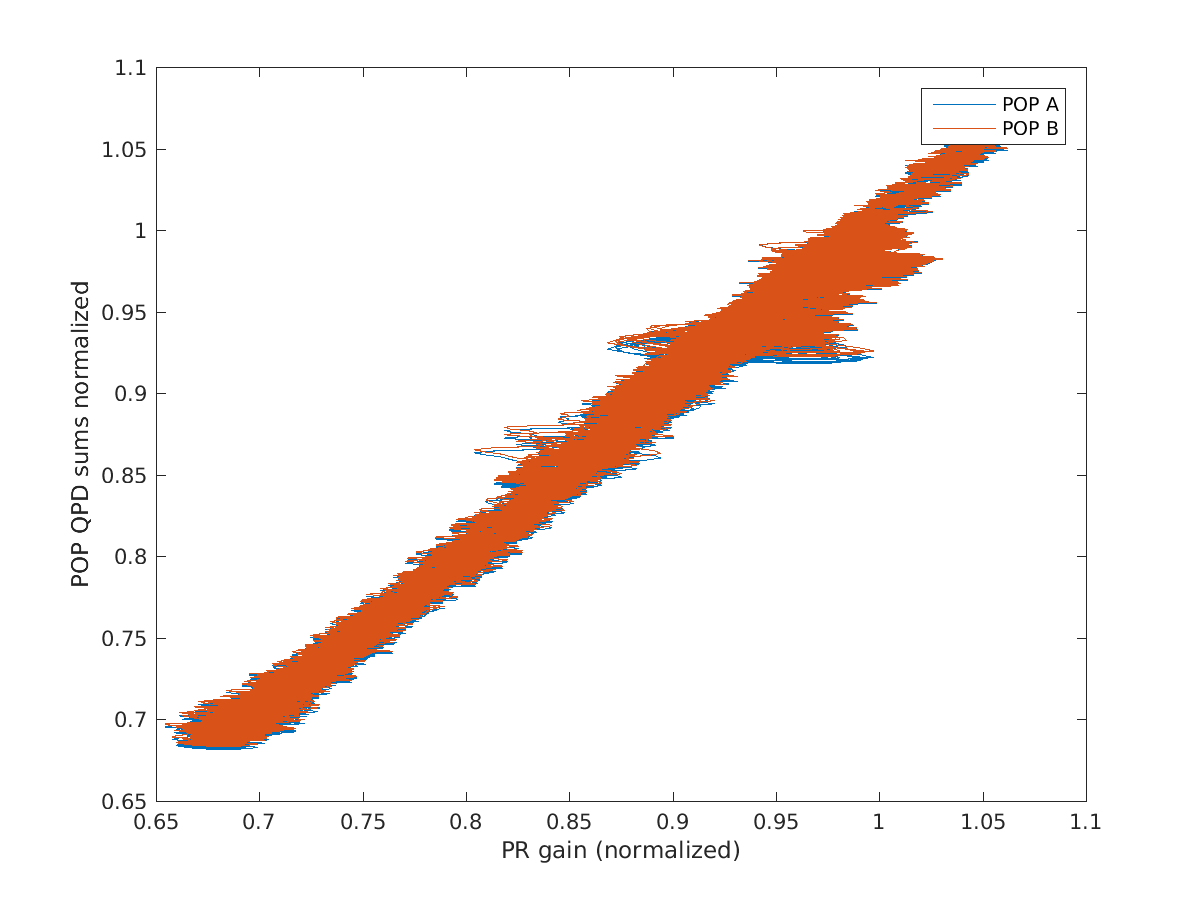
- In the 3rd and 4th plots you can see that in different locks, we got different results for similar POP positions for both PR gain and the strain RMS. We are trying to use the QPD in loop to keep our jitter coupling and PR gain the same from lock to lock. At LLO, they have used a dither on PR2 or PR3 instead of the POP QPD for this degree of freedom, because they had seen clipping on the POP QPD path. The third attachment shows that we do not have clipping in this path, with a scatter plot of the normalized POP A and POP B sums vs recycling gain. We might want to think about trying the dither anyway.
We have made A2L measurements at some of these points and this data can be added to these plots.
Images attached to this report
Non-image files attached to this report
