On 21 Jan 2014, the EPICS gateways were removed in favor of directly specifying the network broadcast addresses using the EPICS_CA_ADDR_LIST environment variable, as described in entry 9400. This eliminates the problem of MEDM displays being slow to respond to IOC reboots, etc., at the expense of additional network traffic. In the original setup, the gateway acts as a proxy for CA channel broadcasts and data streams, such that the gateway can reduce the traffic load for individual IOCs (the gateway can maintain a channel connection, and then fan out the data to clients as required). In the current configuration, clients broadcast and connect to individual IOCs directly; of particular interest is the change in the amount of broadcast traffic.
The Short Version
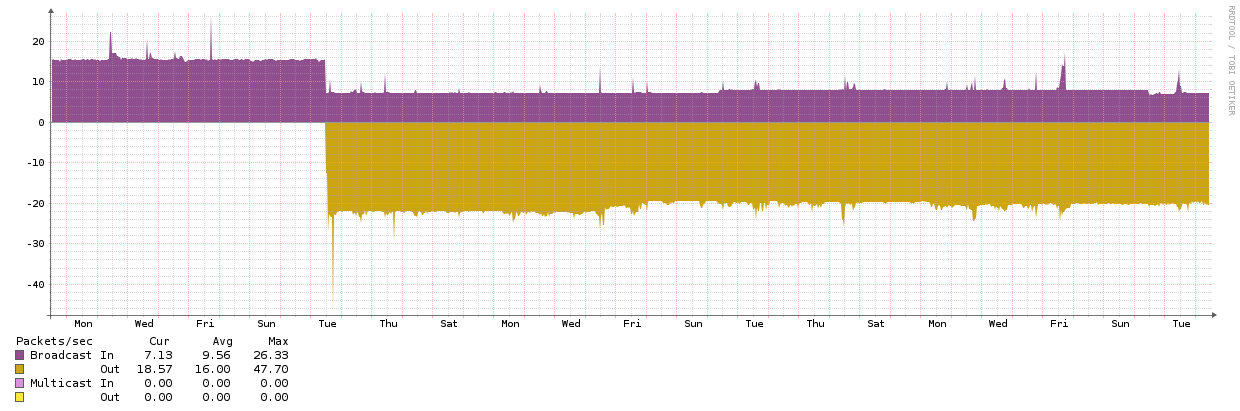
The current broadcast traffic on the H1FE network is approximately double what it was when the EPICS gateway was in place. For peak traffic, the change was from 300k to 500k bits/s (75k to 200k bits/s for avg traffic). As a percentage of the total bandwidth available between the core switch and the H1FE switch (1Gbps), this is a change from 0.03% to 0.05% peak utilization. Measured in packets/sec, the rate also essentially doubled from ~10 pps to ~20pps. This should not represent a significant additional traffic burden; however it has made more evident some potential flaws with the model switches used for the front ends, for which work is ongoing. This analysis is based solely on the broadcast traffic rates, which is the primary concern at hand.
Vlan101 Interface as a Barometer for Traffic Analysis
The core switch performs L3 routing for the CDS network. As such, the vlan interface for VLAN 101 (the FE network) is an ideal point to monitor changes in traffic. With the gateway in place, this interface will receive the CA beacons from the gateway. With the gateway removed, CA beacons will traverse this interface to reach the front end computer. Note that the majority of the broadcast traffic comes from the hourly autoburt runs; while the gateway proxies connections, it appears to re-broadcast for channel names anyway.
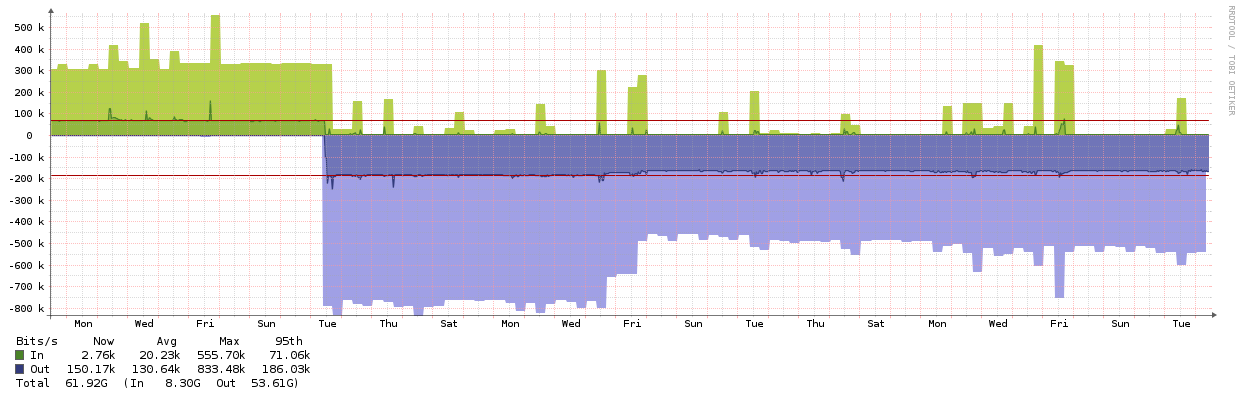
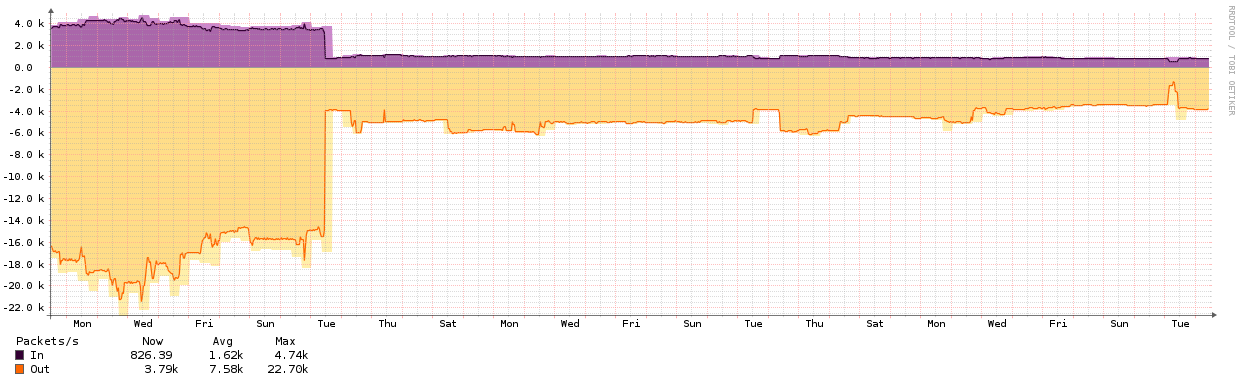
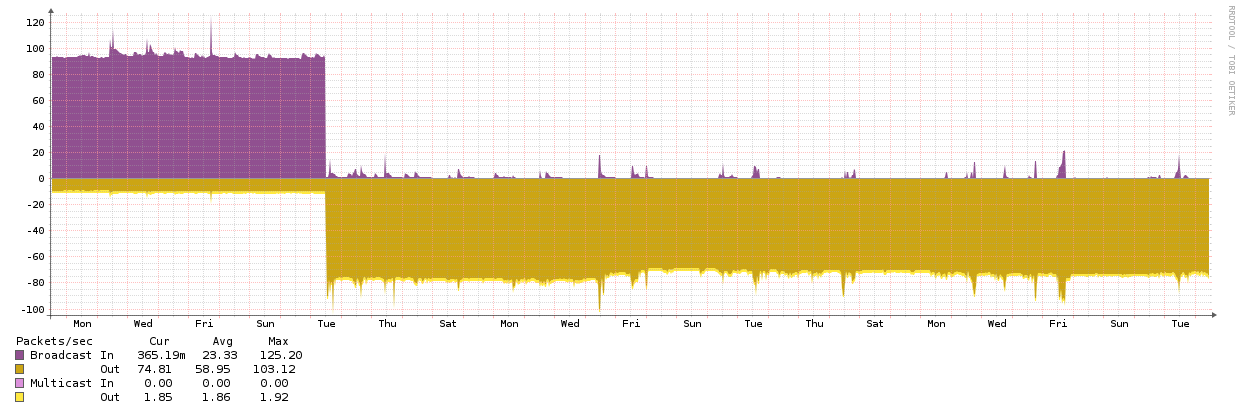
The attached plots for Vlan101 show that the broadcast traffic flow inverts on the 21st as expected. The subsequent relative drop in traffic levels a week and a half later corresponds to a cleanup of the autoburt request files that eliminated invalid/non-existent channels, hence reducing the broadcast rate.
vlan101-bits.png: Vlan101 traffic rate in bits.
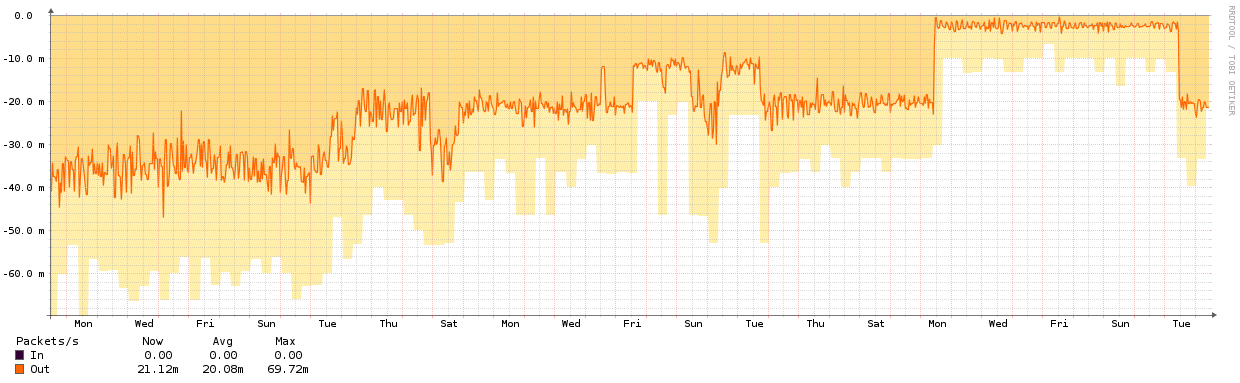
vlan101-unicast.png: Vlan101 traffic in unicast packets.
vlan101-non-unicast.png: Vlan101 traffic in broadcast/multicast packets.
Plot times are between 2014-01-12 10:49:59 PST to 2014-02-19 10:49:59 PST. The range is an arbirary choice, other than including the region of interest. Light infill represents max peak traffic, dark infill average traffic.
cdsegw0 Interface Statistics
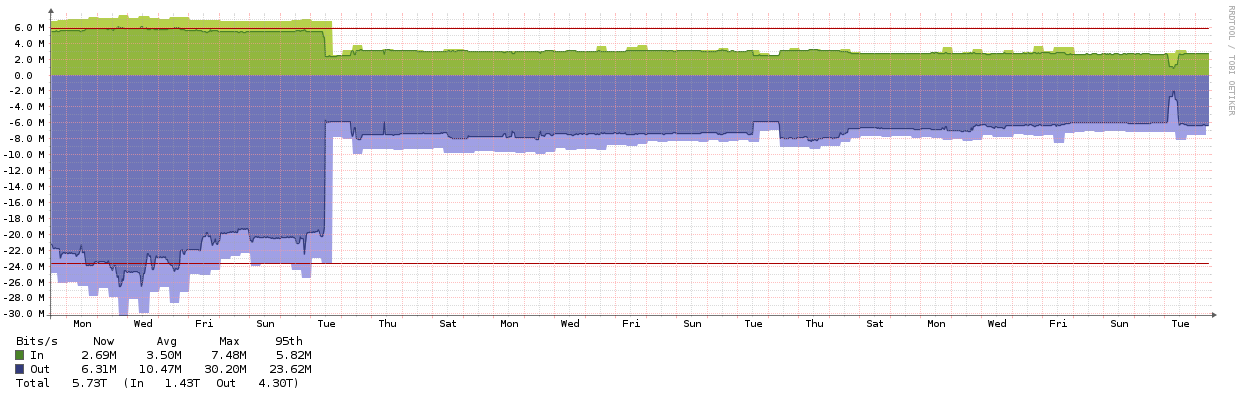
As a check, plots for cdsegw0 (the EPICS gateway) show a corresponding change in traffic. The two interfaces cannot be compared directly, as the physical interface for cdsegw0 includes traffic from vlans 101,105, and 106. However, the relative traffic changes match.
cdsegw0-bits.png: Vlan101 traffic rate in bits.
cdsegw0-unicast.png: Vlan101 traffic in unicast packets.
cdsegw0-non-unicast.png: Vlan101 traffic in broadcast/multicast packets.
Plot times, traces are as described above for Vlan101.