john.worden@LIGO.ORG - posted 14:49, Tuesday 01 April 2014 - last comment - 15:22, Tuesday 01 April 2014(11114)
YEND Pumpdown
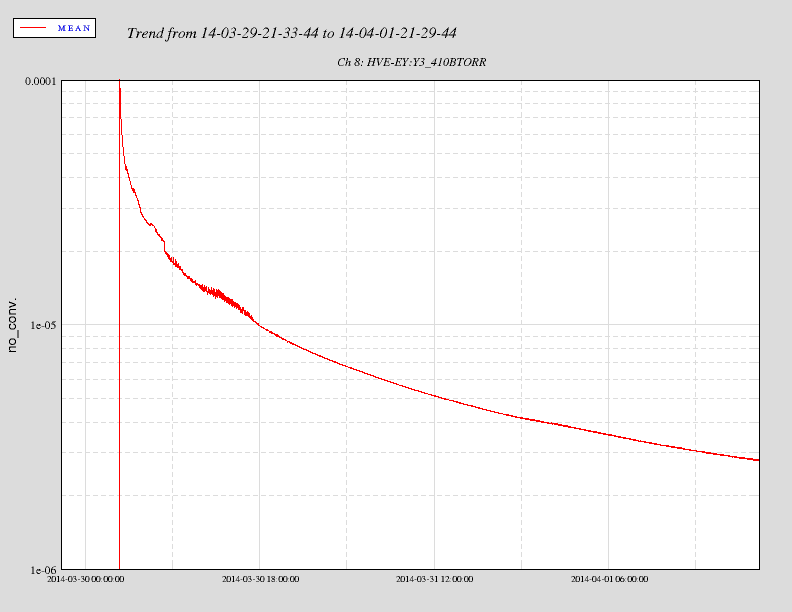
Here is the status of the YEND pumpdown.
Roughing started at 18:20 utc on the 29th The cold cathode(PT410B) trace begins at 3:40 utc on the 30th.
See attached PT410B data.
For reference here is the XEND data from January - https://alog.ligo-wa.caltech.edu/aLOG/index.php?callRep=9154
Images attached to this report
Non-image files attached to this report

Comments related to this report
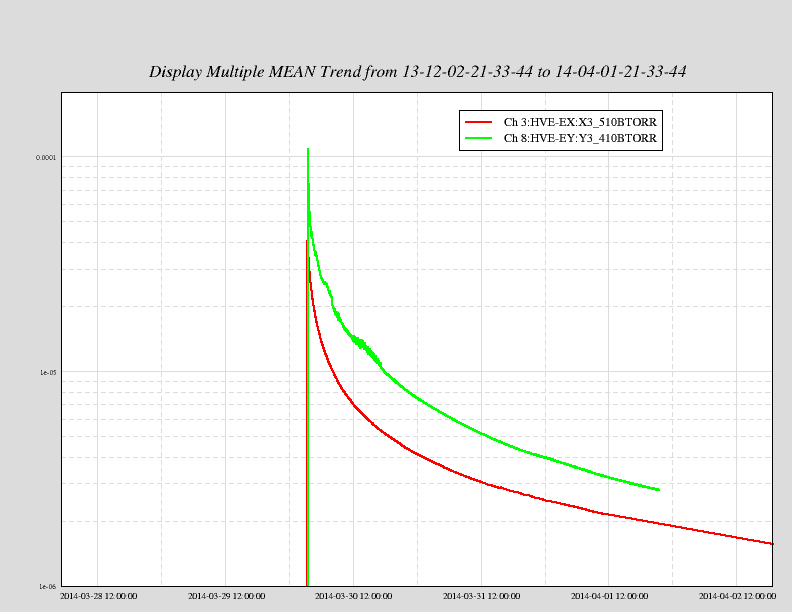
Data viewer allows me to offset a data set by 120 days in order to display both the X and Y pumpdowns together.
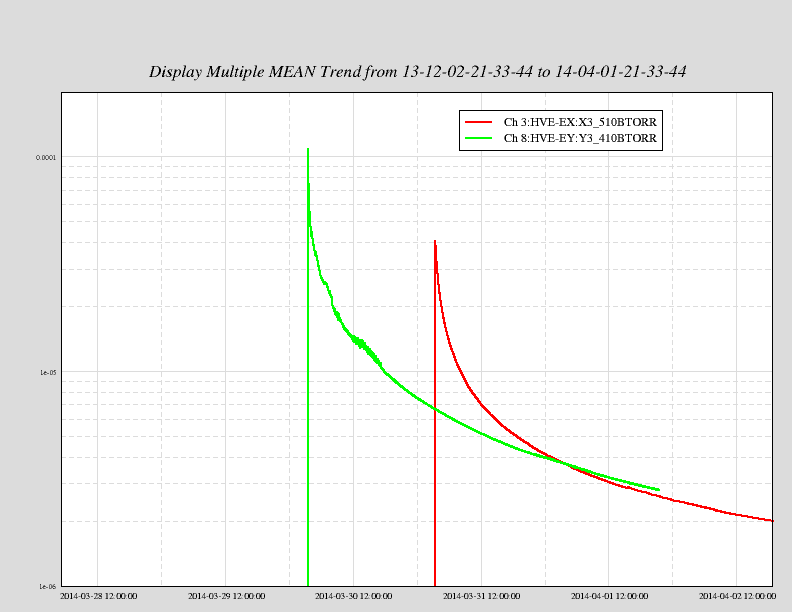
At first glance it looks like YEND (green) is slower than XEND(red) - however, not shown is the pause during roughing of XEND. Correcting for this delay lines up the two curves as shown in the second plot.
The correction on the plot is 1 day while the delay in roughing was approximately 18 hours.
Images attached to this comment