stefan.ballmer@LIGO.ORG - posted 13:02, Wednesday 09 April 2014 - last comment - 15:51, Thursday 10 April 2014(11244)
ETMX BSC ISI Performance
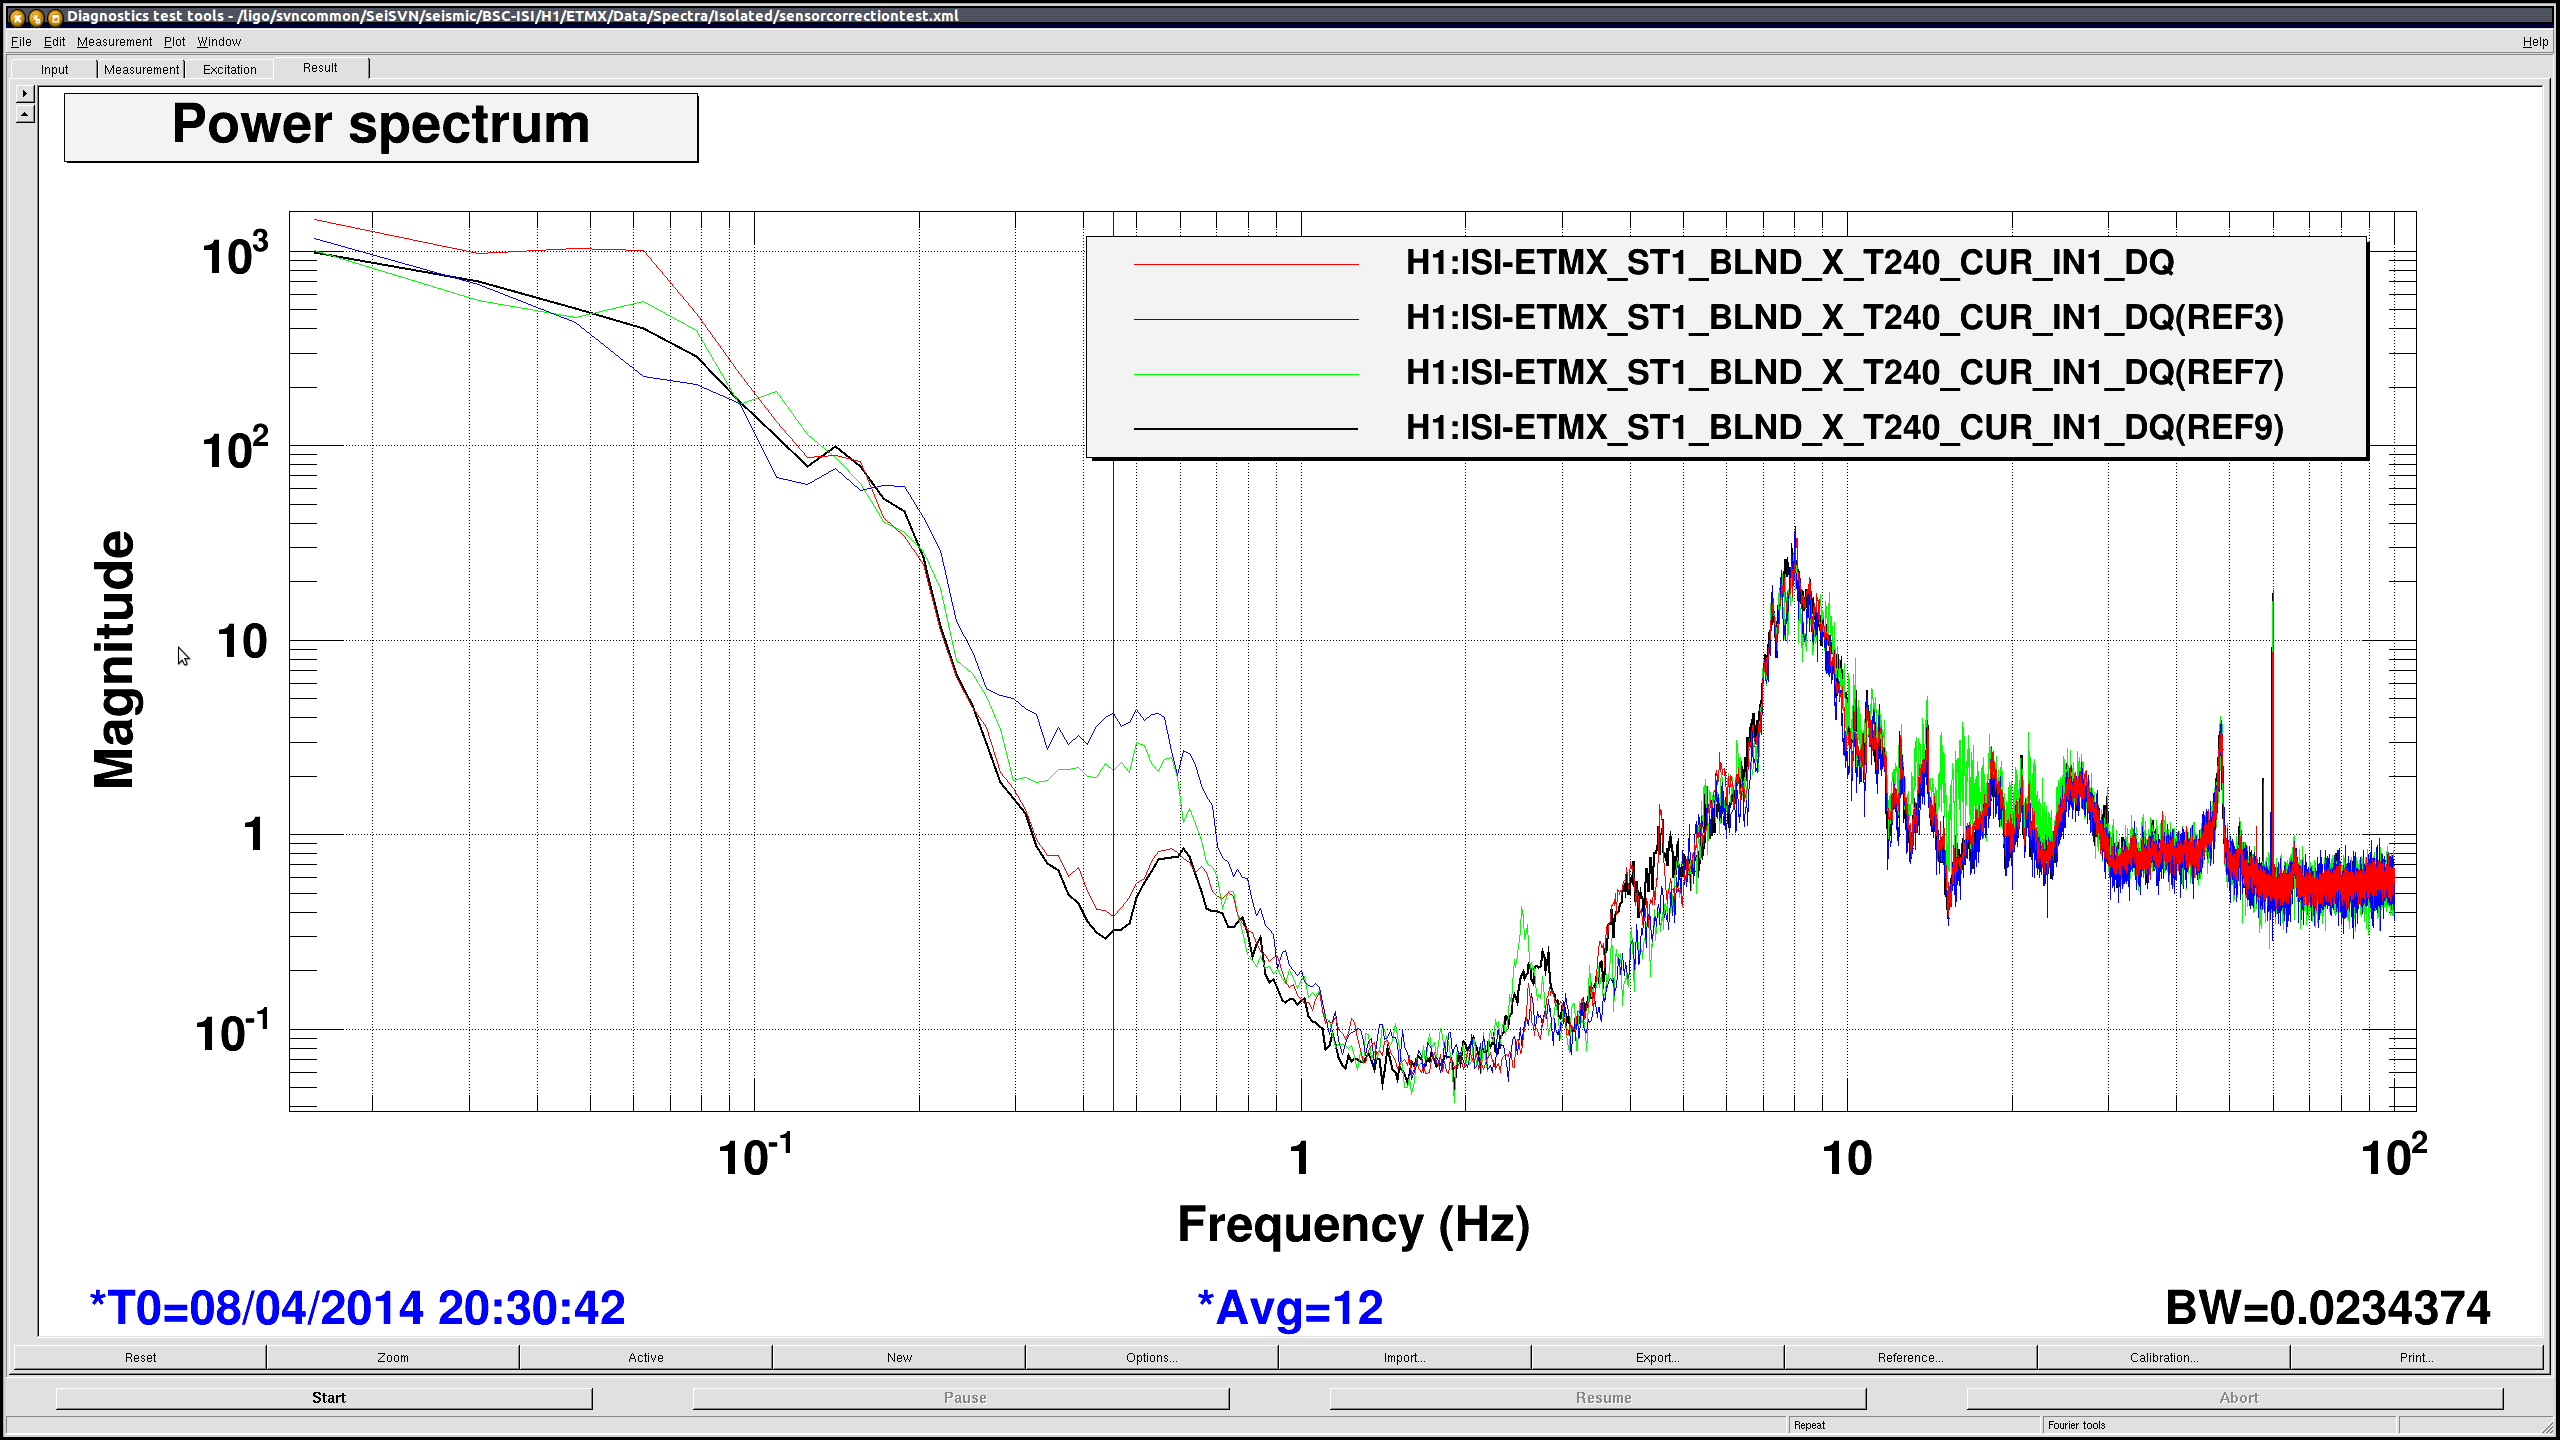
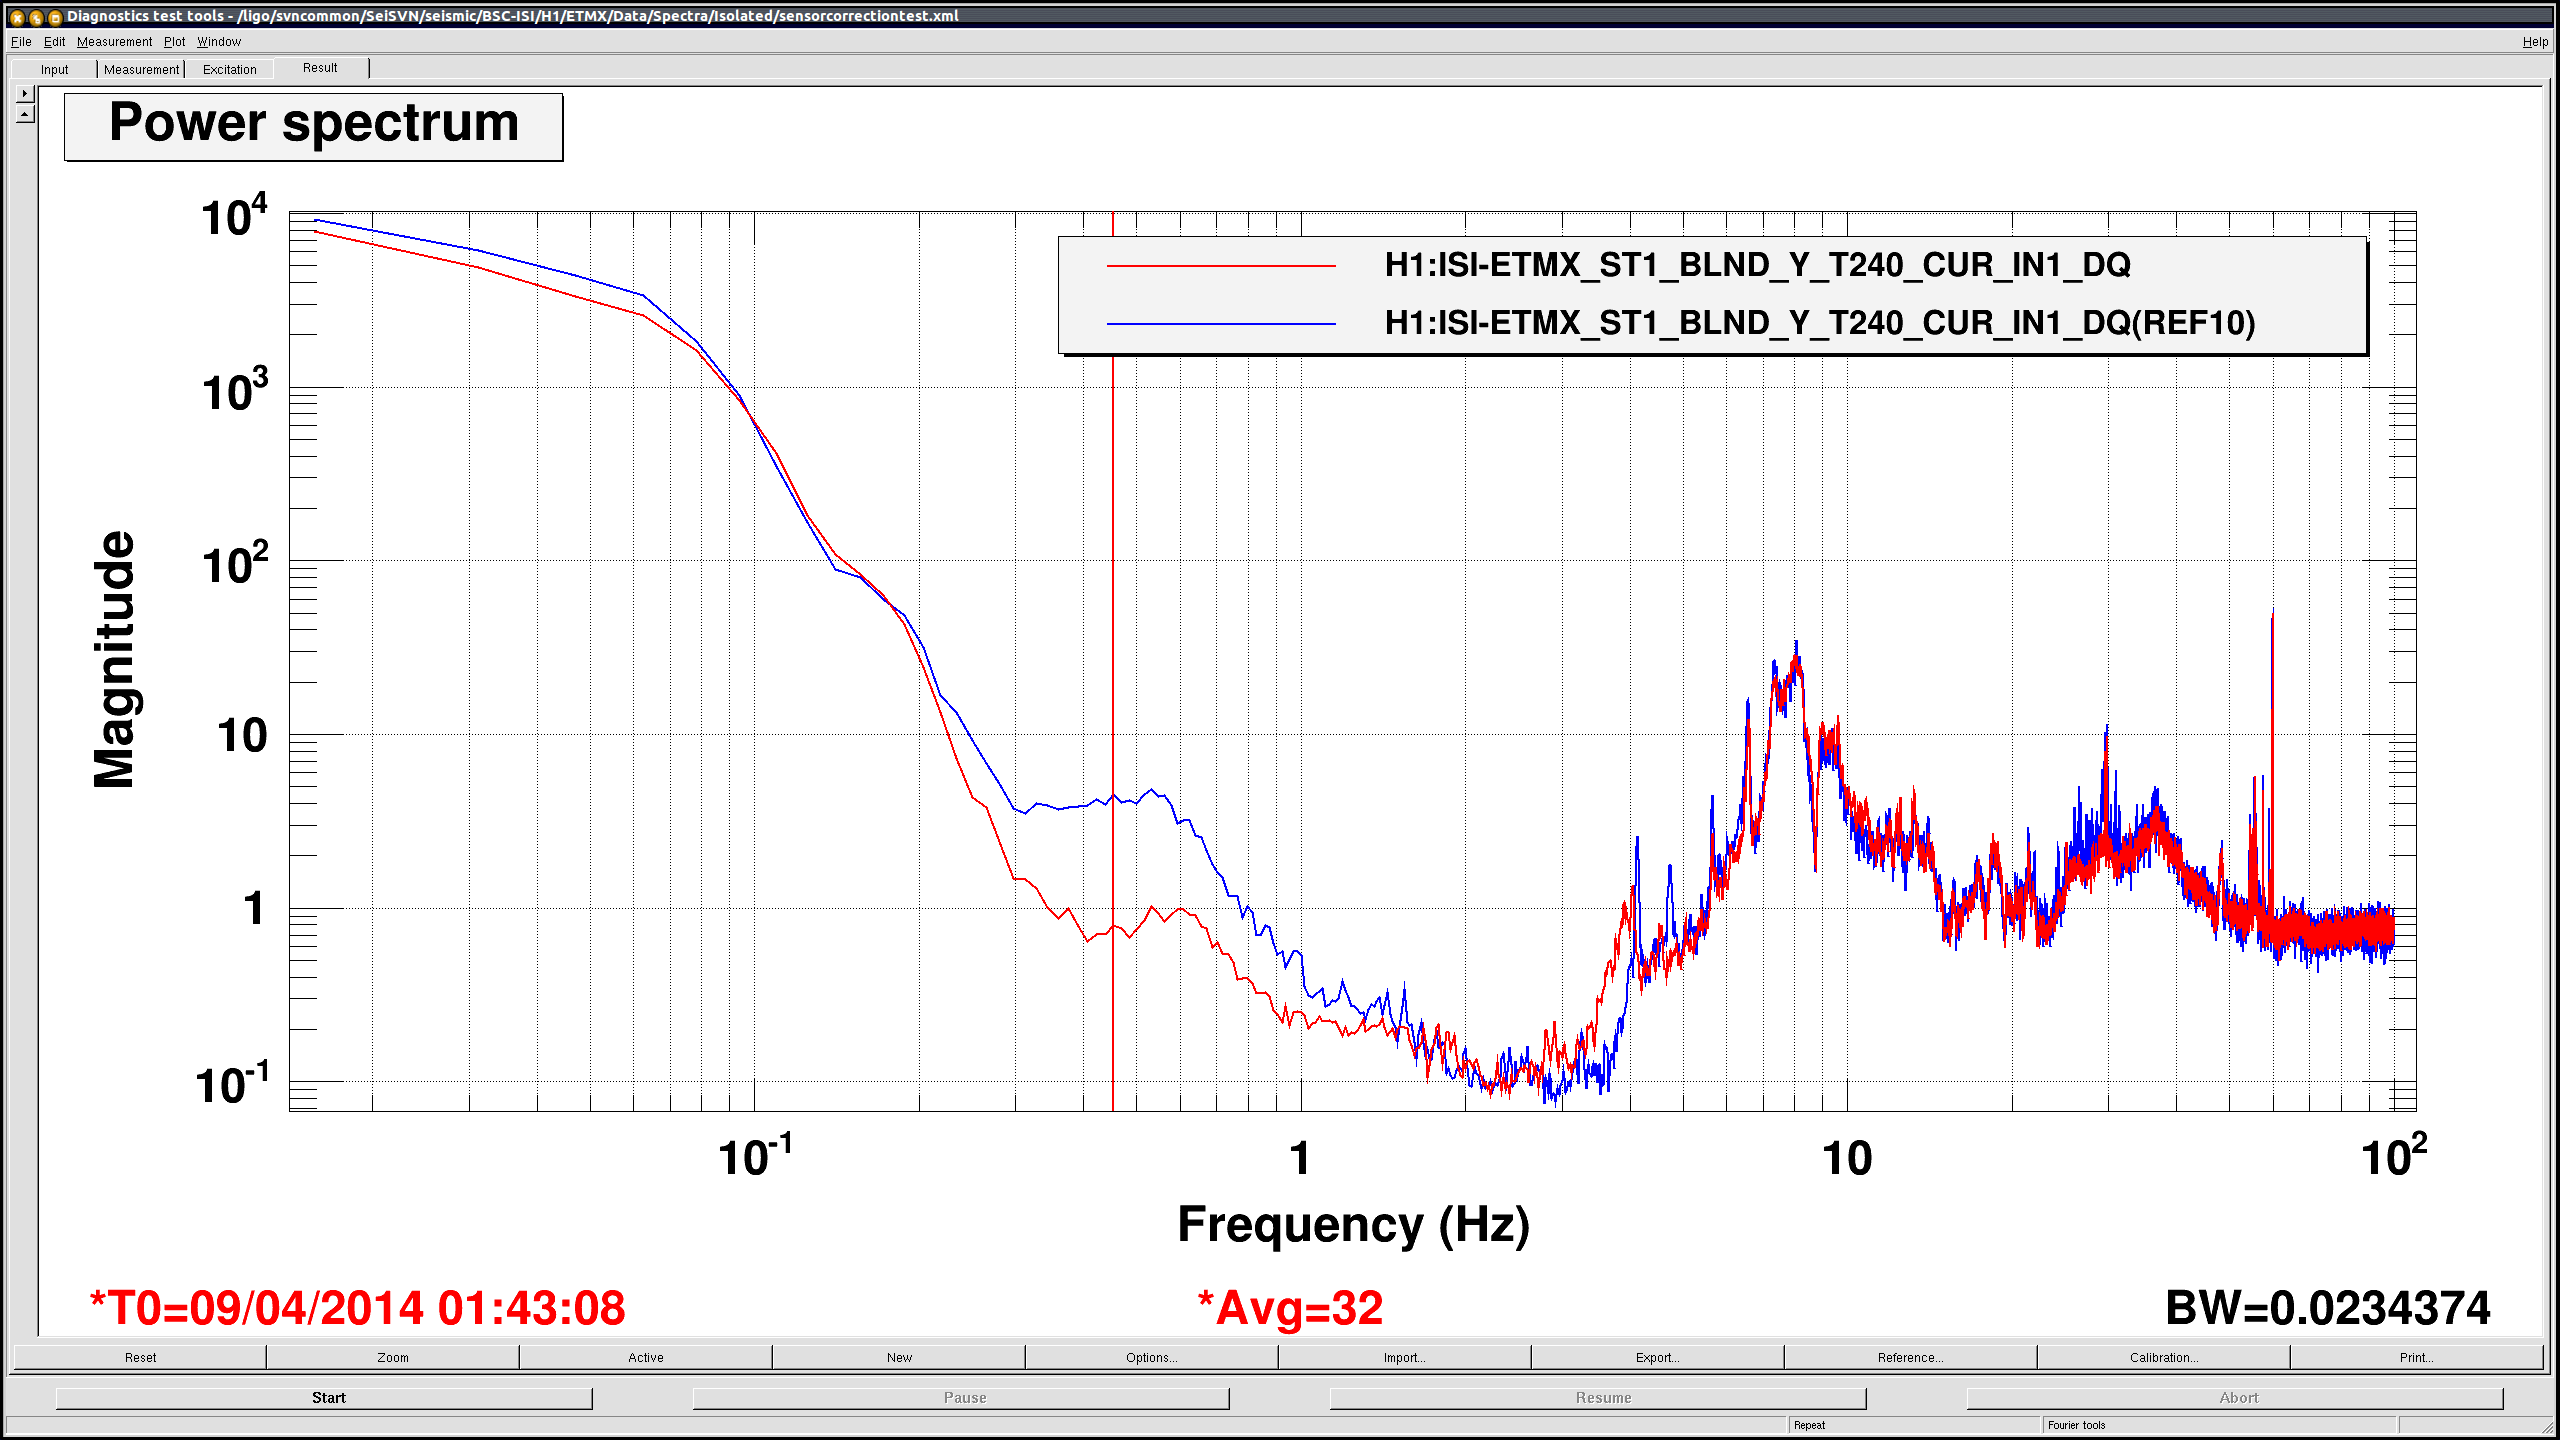
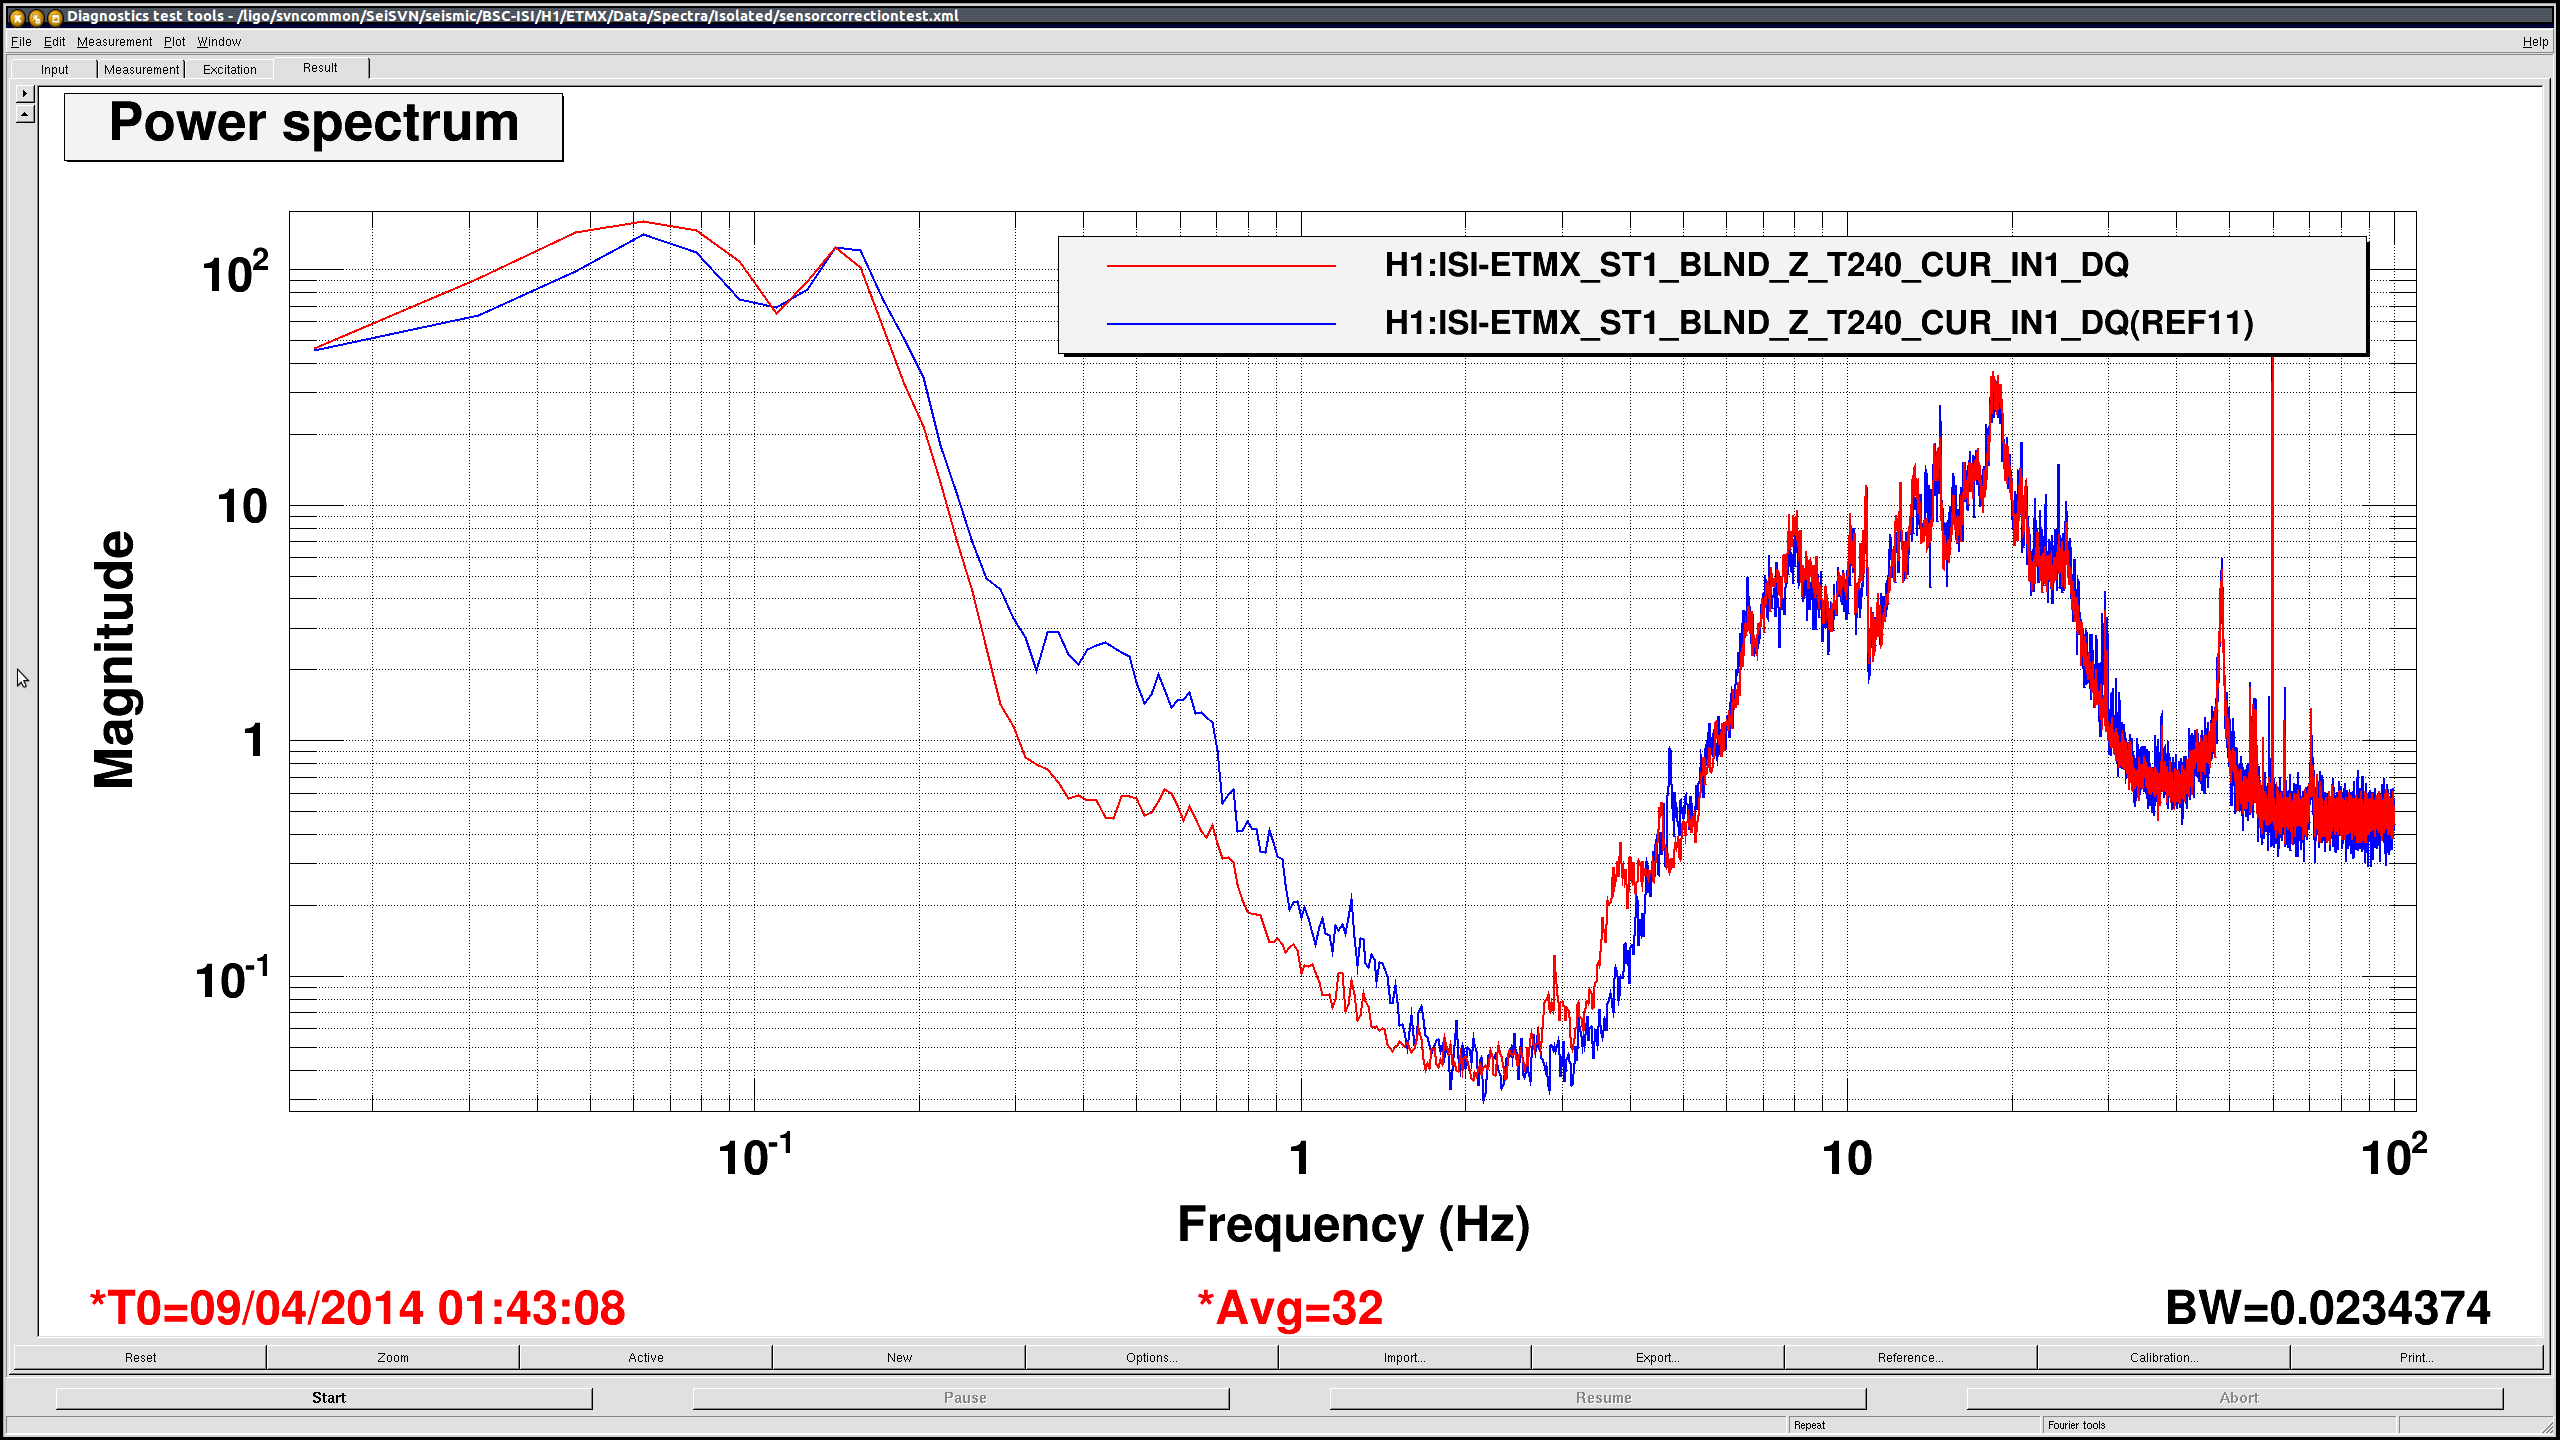
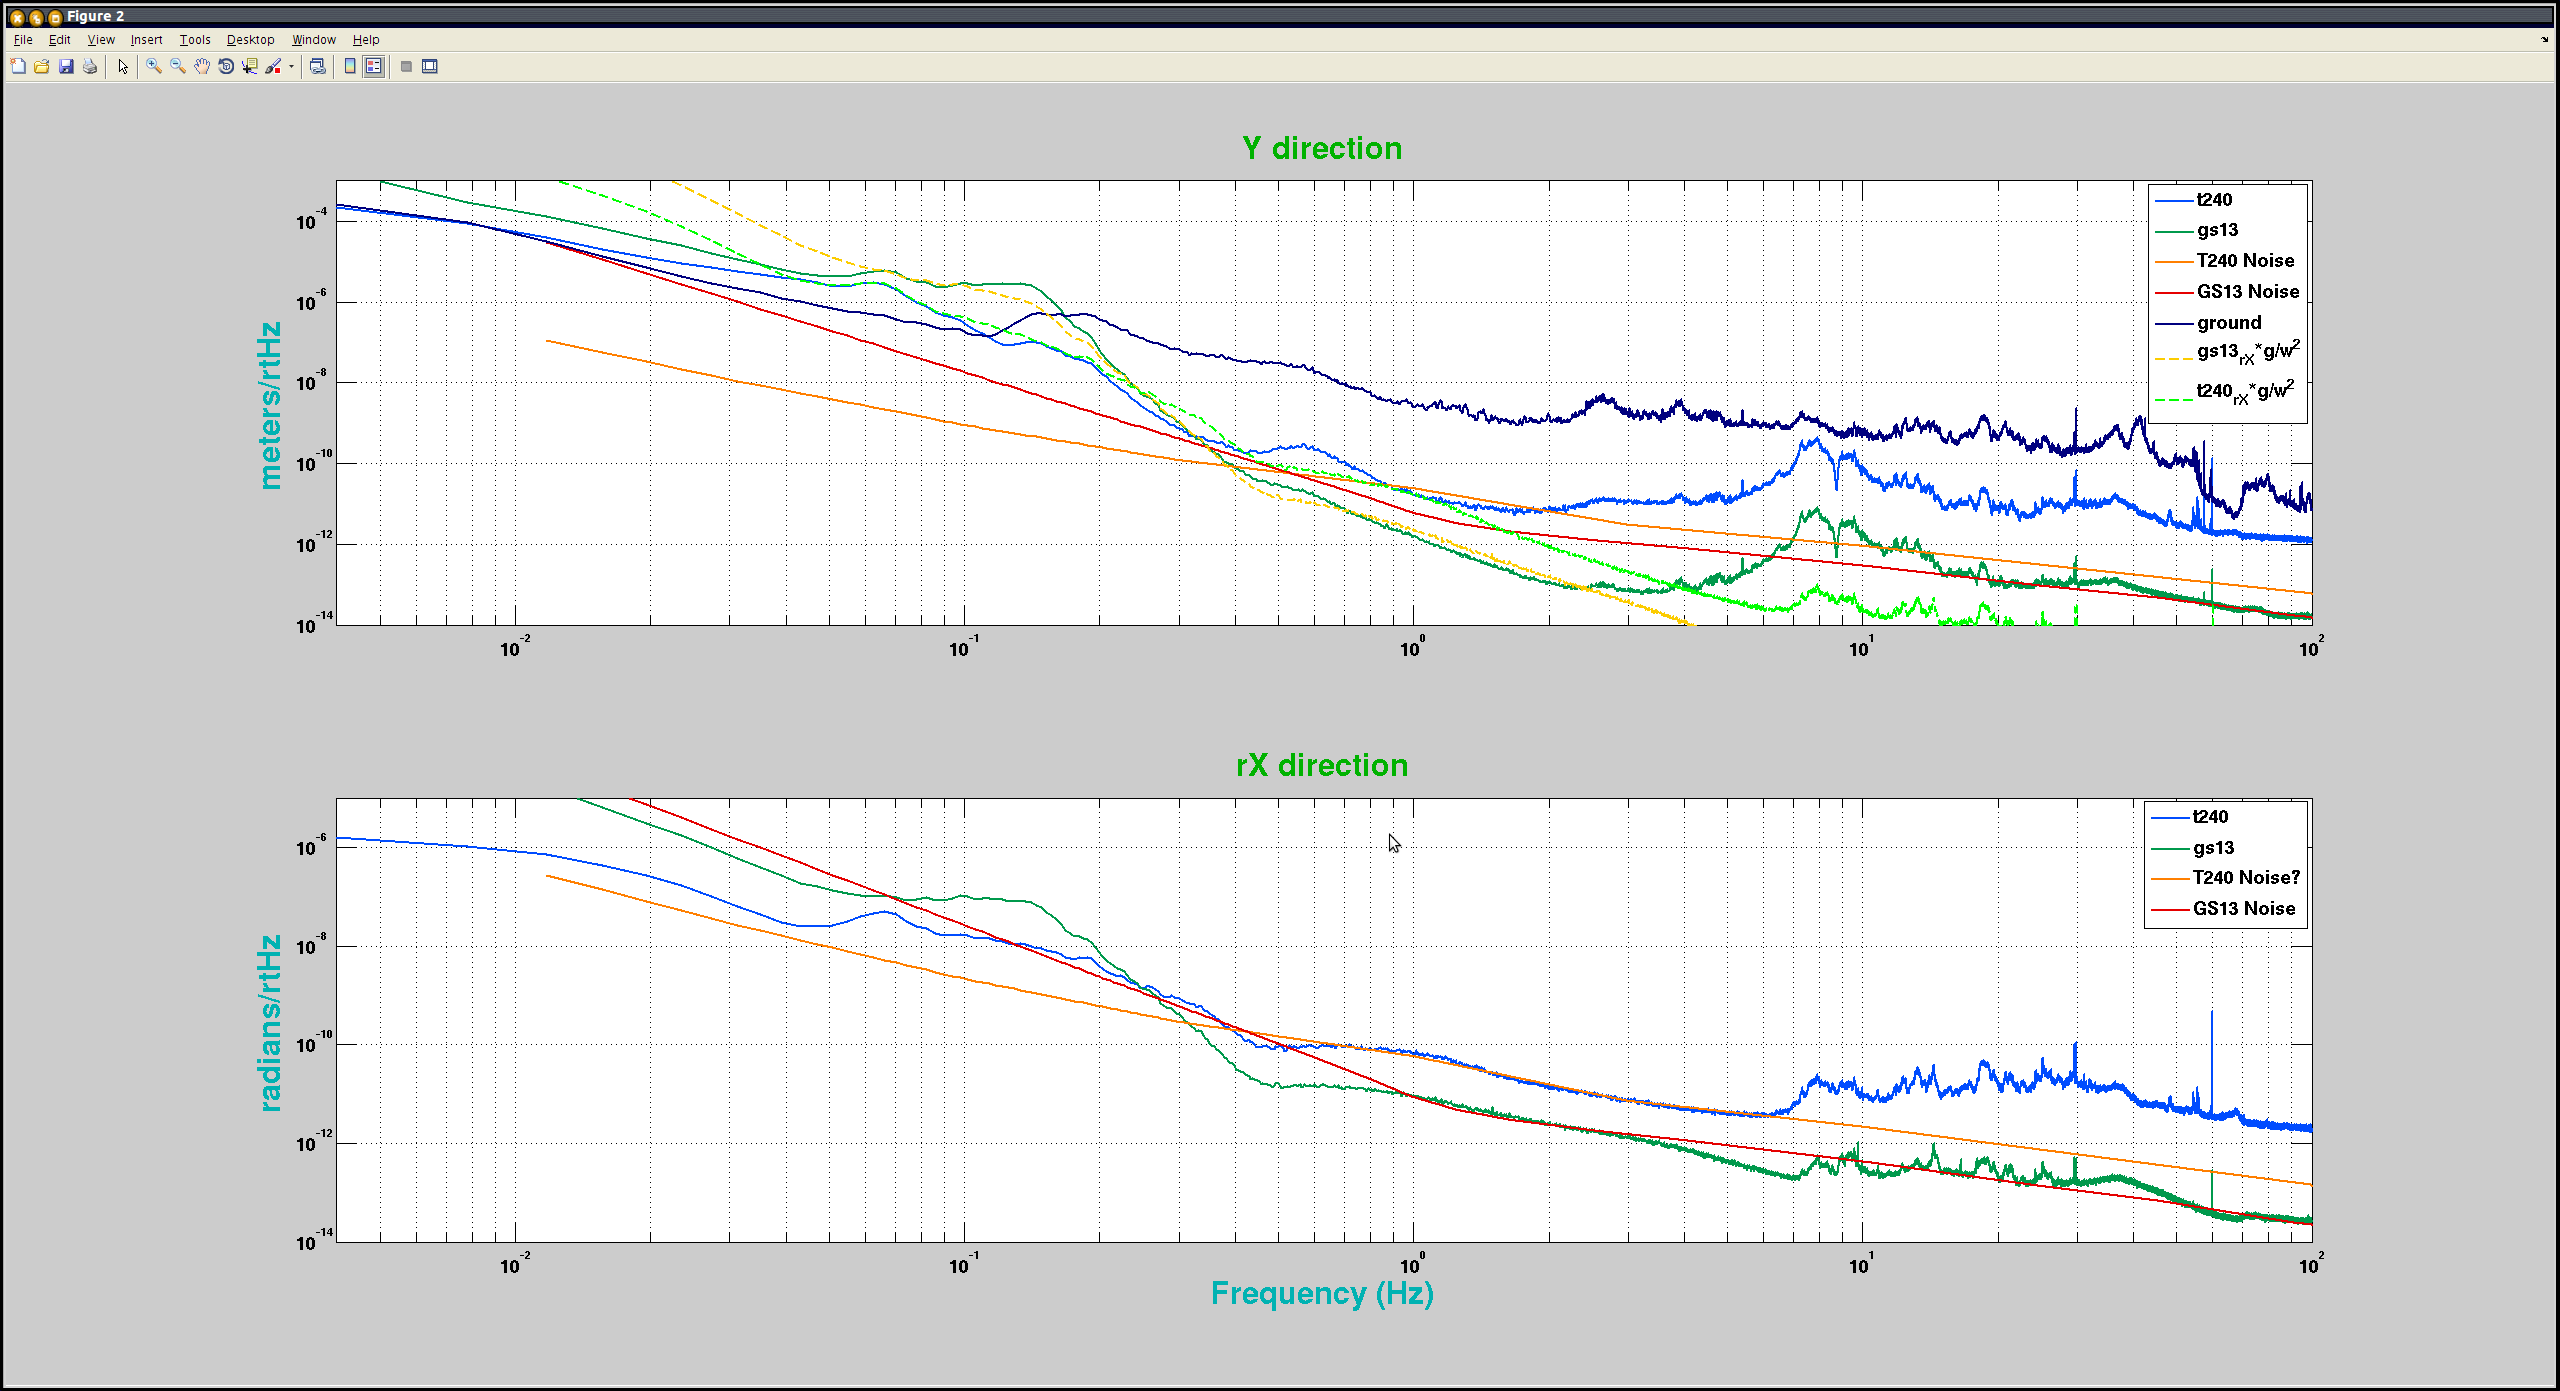
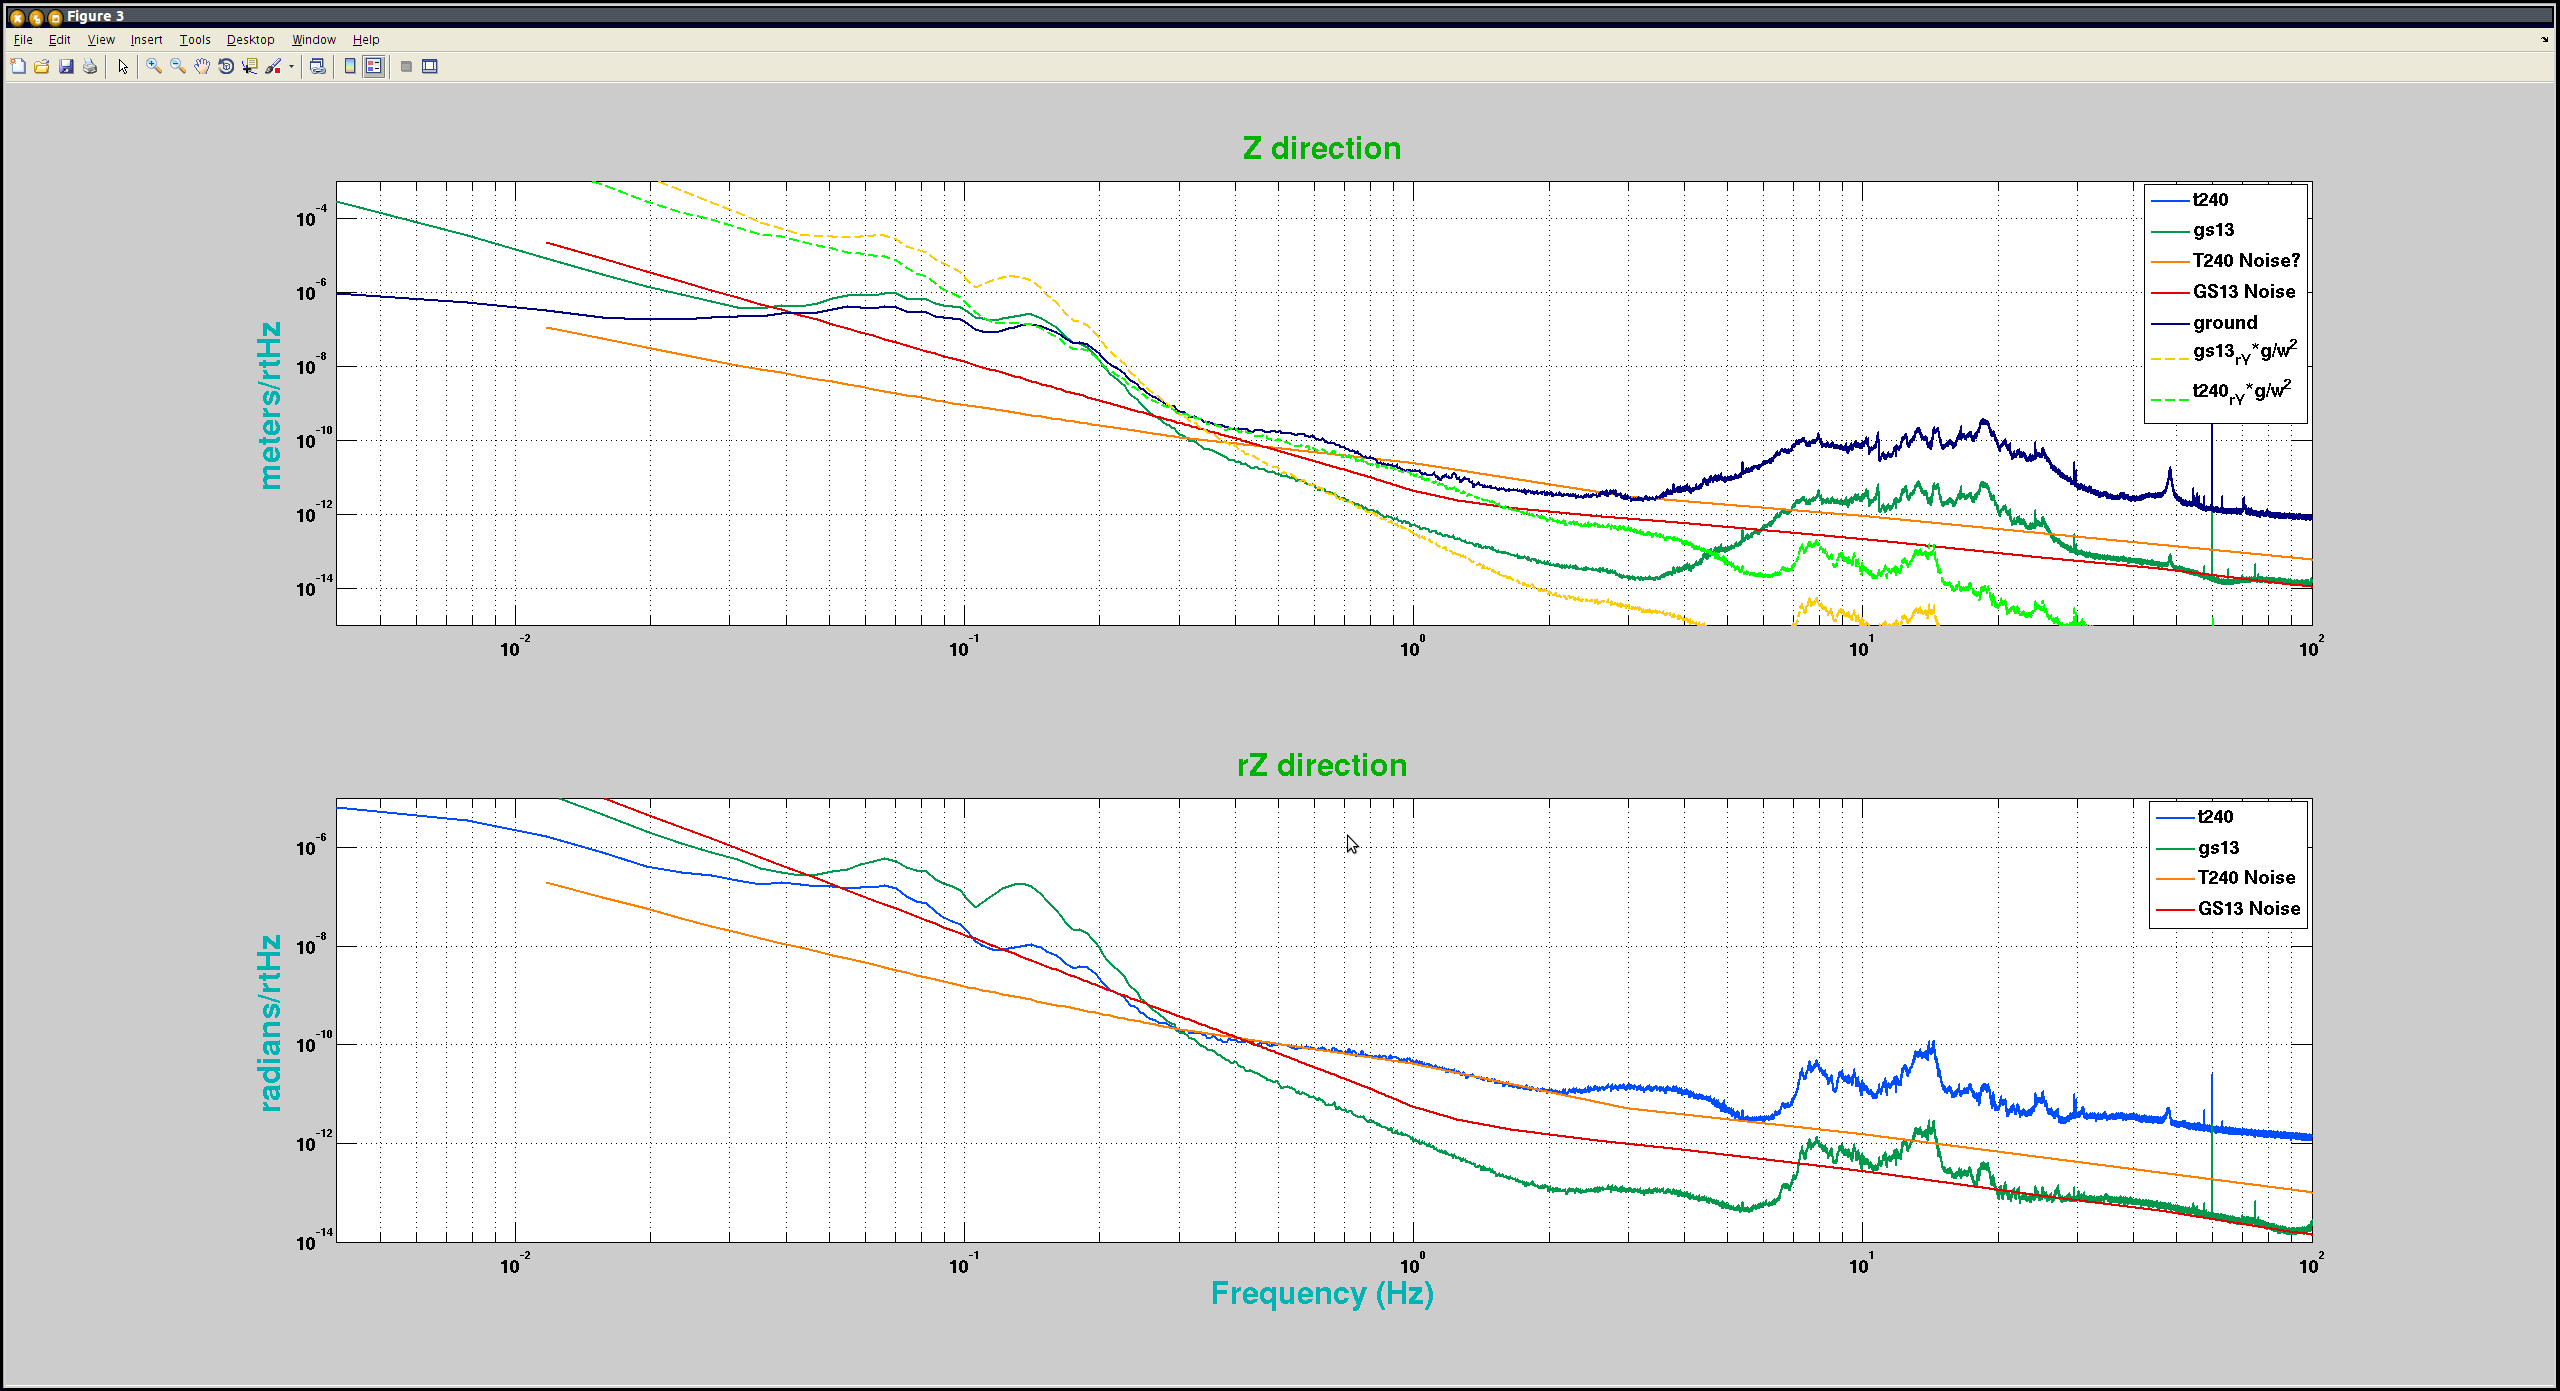
We Left ETMX running over night (it wasn't very windy so this should probably count as a quite time, I need to make a tool that will tell me that kind of thing).

Sensor correction was installed in three degrees of freedom last night and running. This is ground to stage 1, using Ryan's filter which is targeting the first suspension mode at 0.45Hz.

I've attached three sensor correction plots on/off, blue is sensor correction off the other colors are sensor correction on with various gains. The X direction gain ended up at 1 (which is what it was designed to be) Y and Z came out to be 0.6,
which is very weird.

  There are also three performance plots from last night, with the GS13 and T240 curves.  In general we are buried in the GS13 noise above 0.5Hz (red vs green) except at the BSC pier resonance, we do not have the HEPI L4C feed forward filters installed yet. GS13 rY and rX tilt coupling (yellow line) explains most of the low frequency gs13 signal.  There is clearly some room to relax rZ loop to reduce the gain peaking below 0.2Hz

and again none of this is Stephen's fault I can't figure out how to change the login to me

Rich

Mabey I hope that I now have the correct plots
Images attached to this report

Comments related to this report
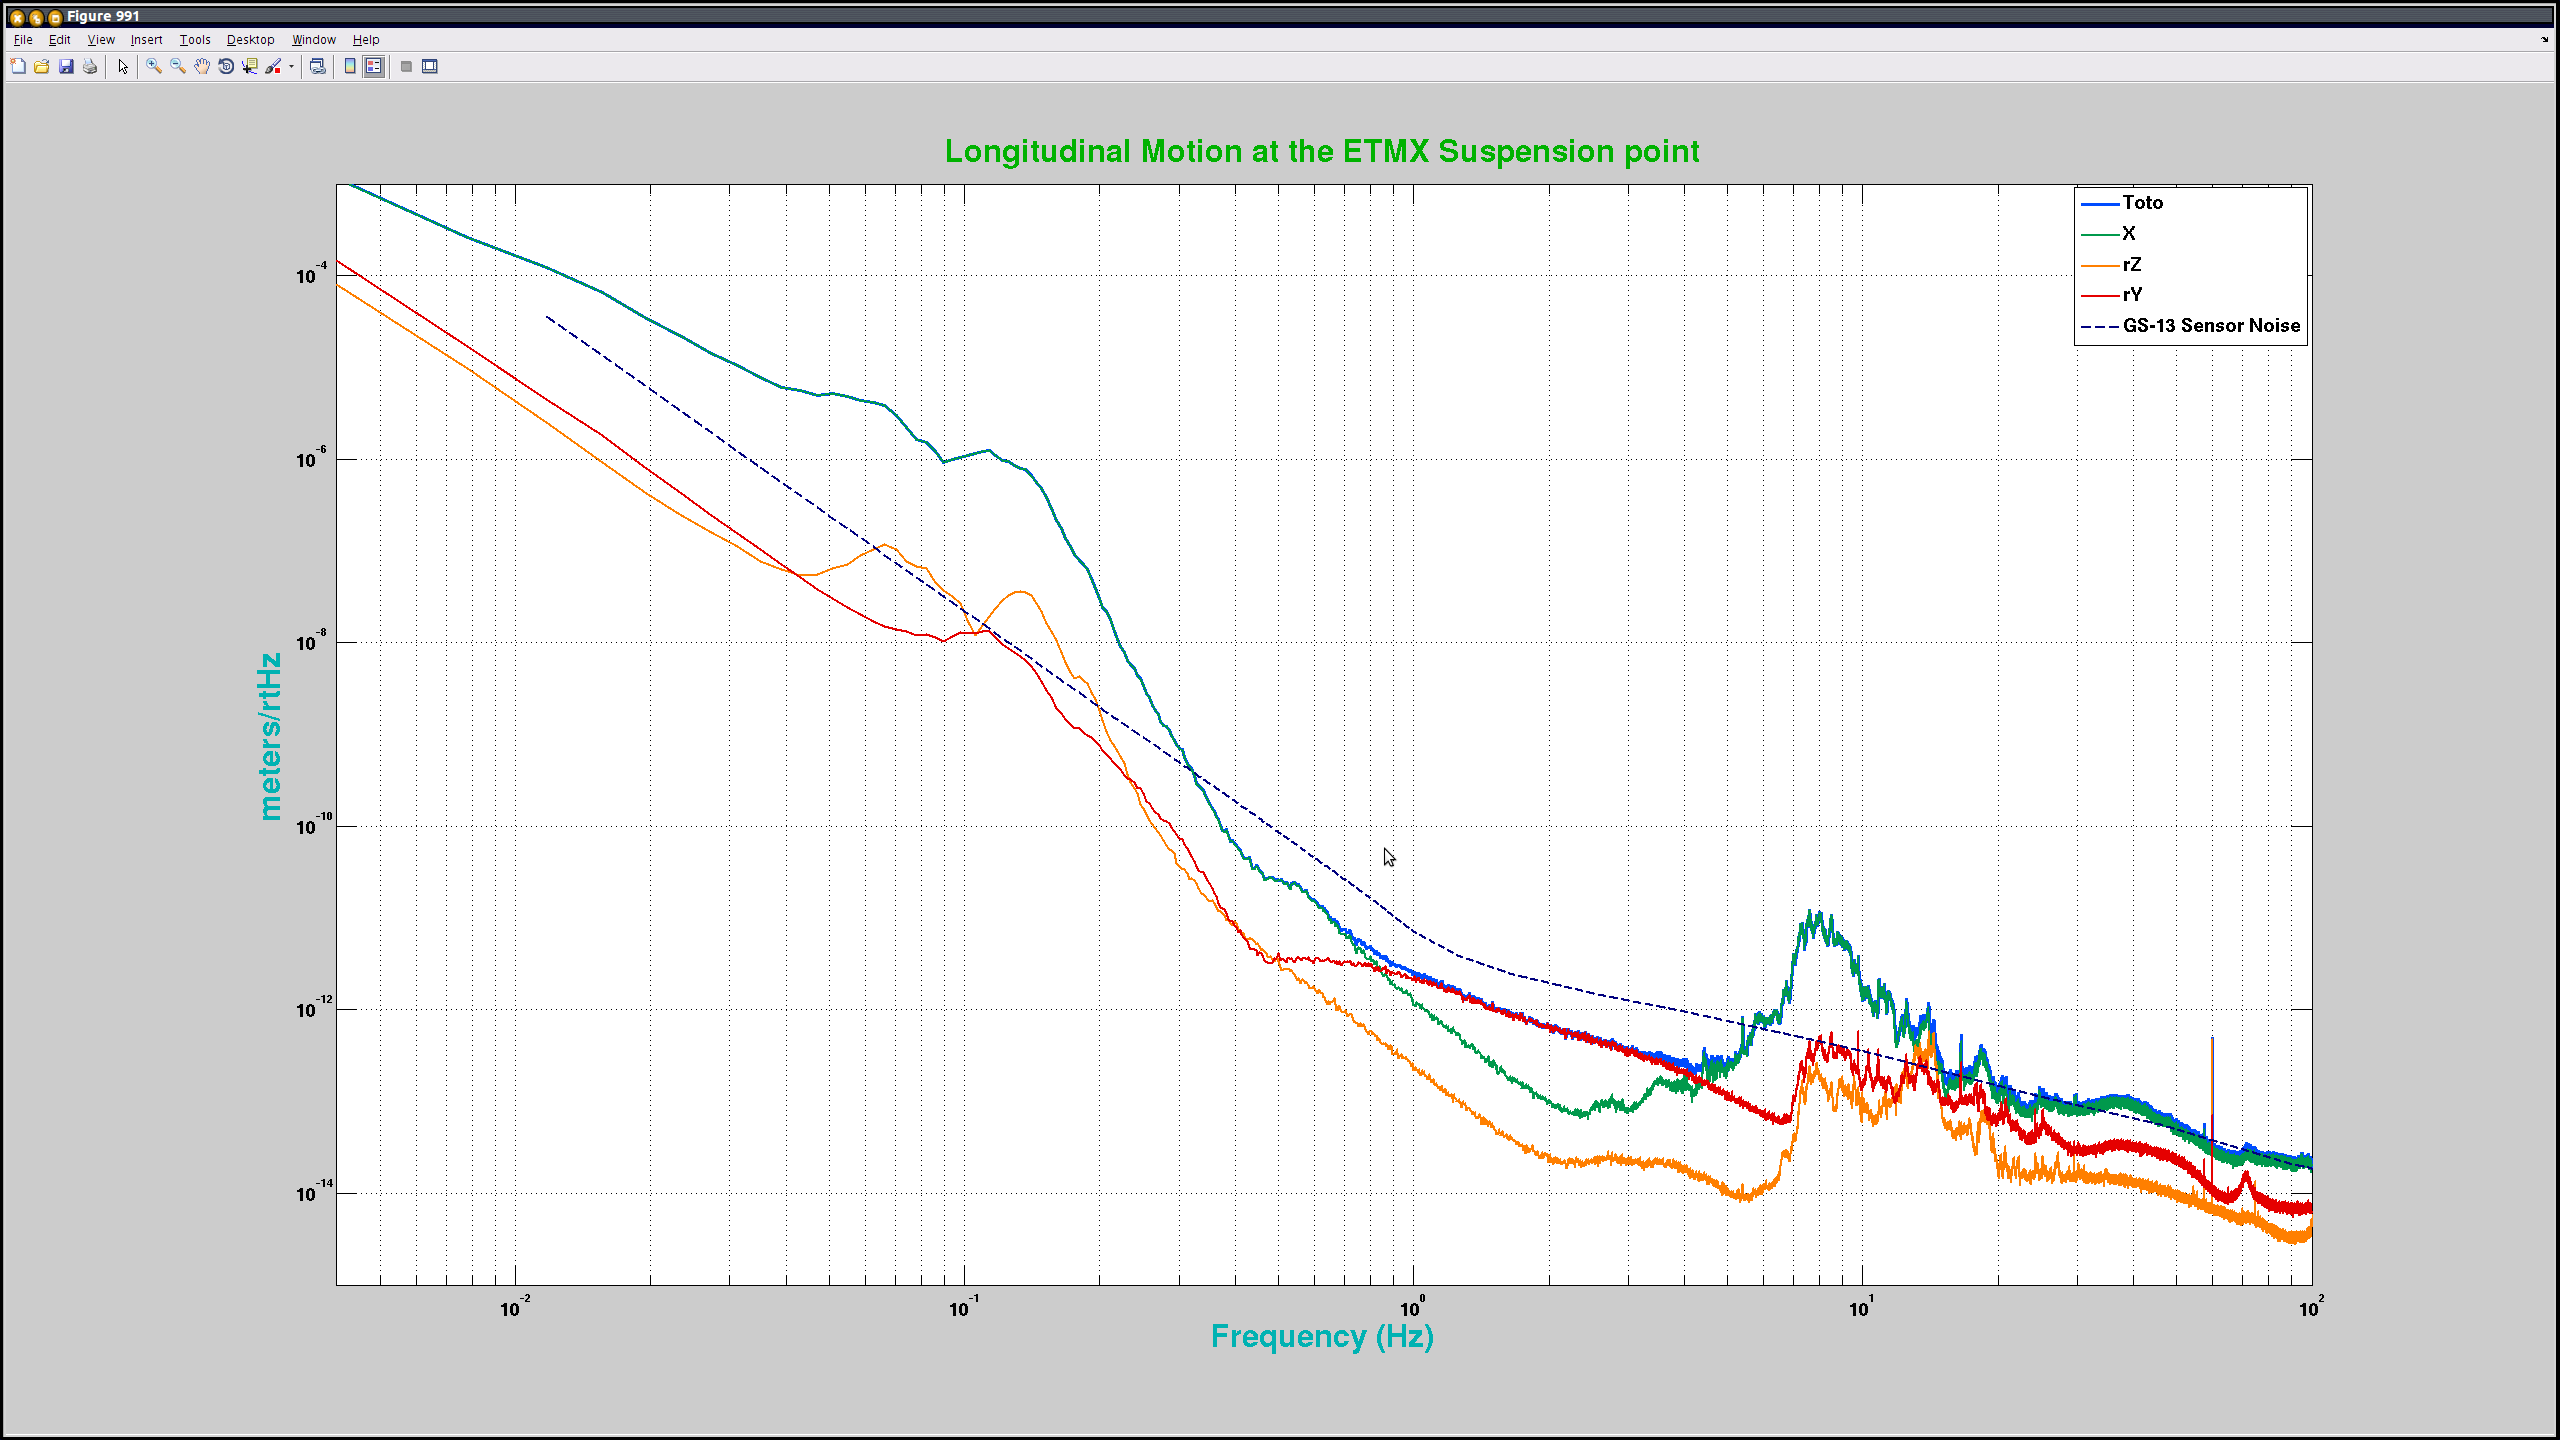
I added the projected motion at the suspension point (Longitudinal), where we aren't noise limited we are completely dominated by table X motion, which of course at low frequency is completely dominated by rotation motion (rY).
Yaw motion only couples to table rZ so I didn't plot that
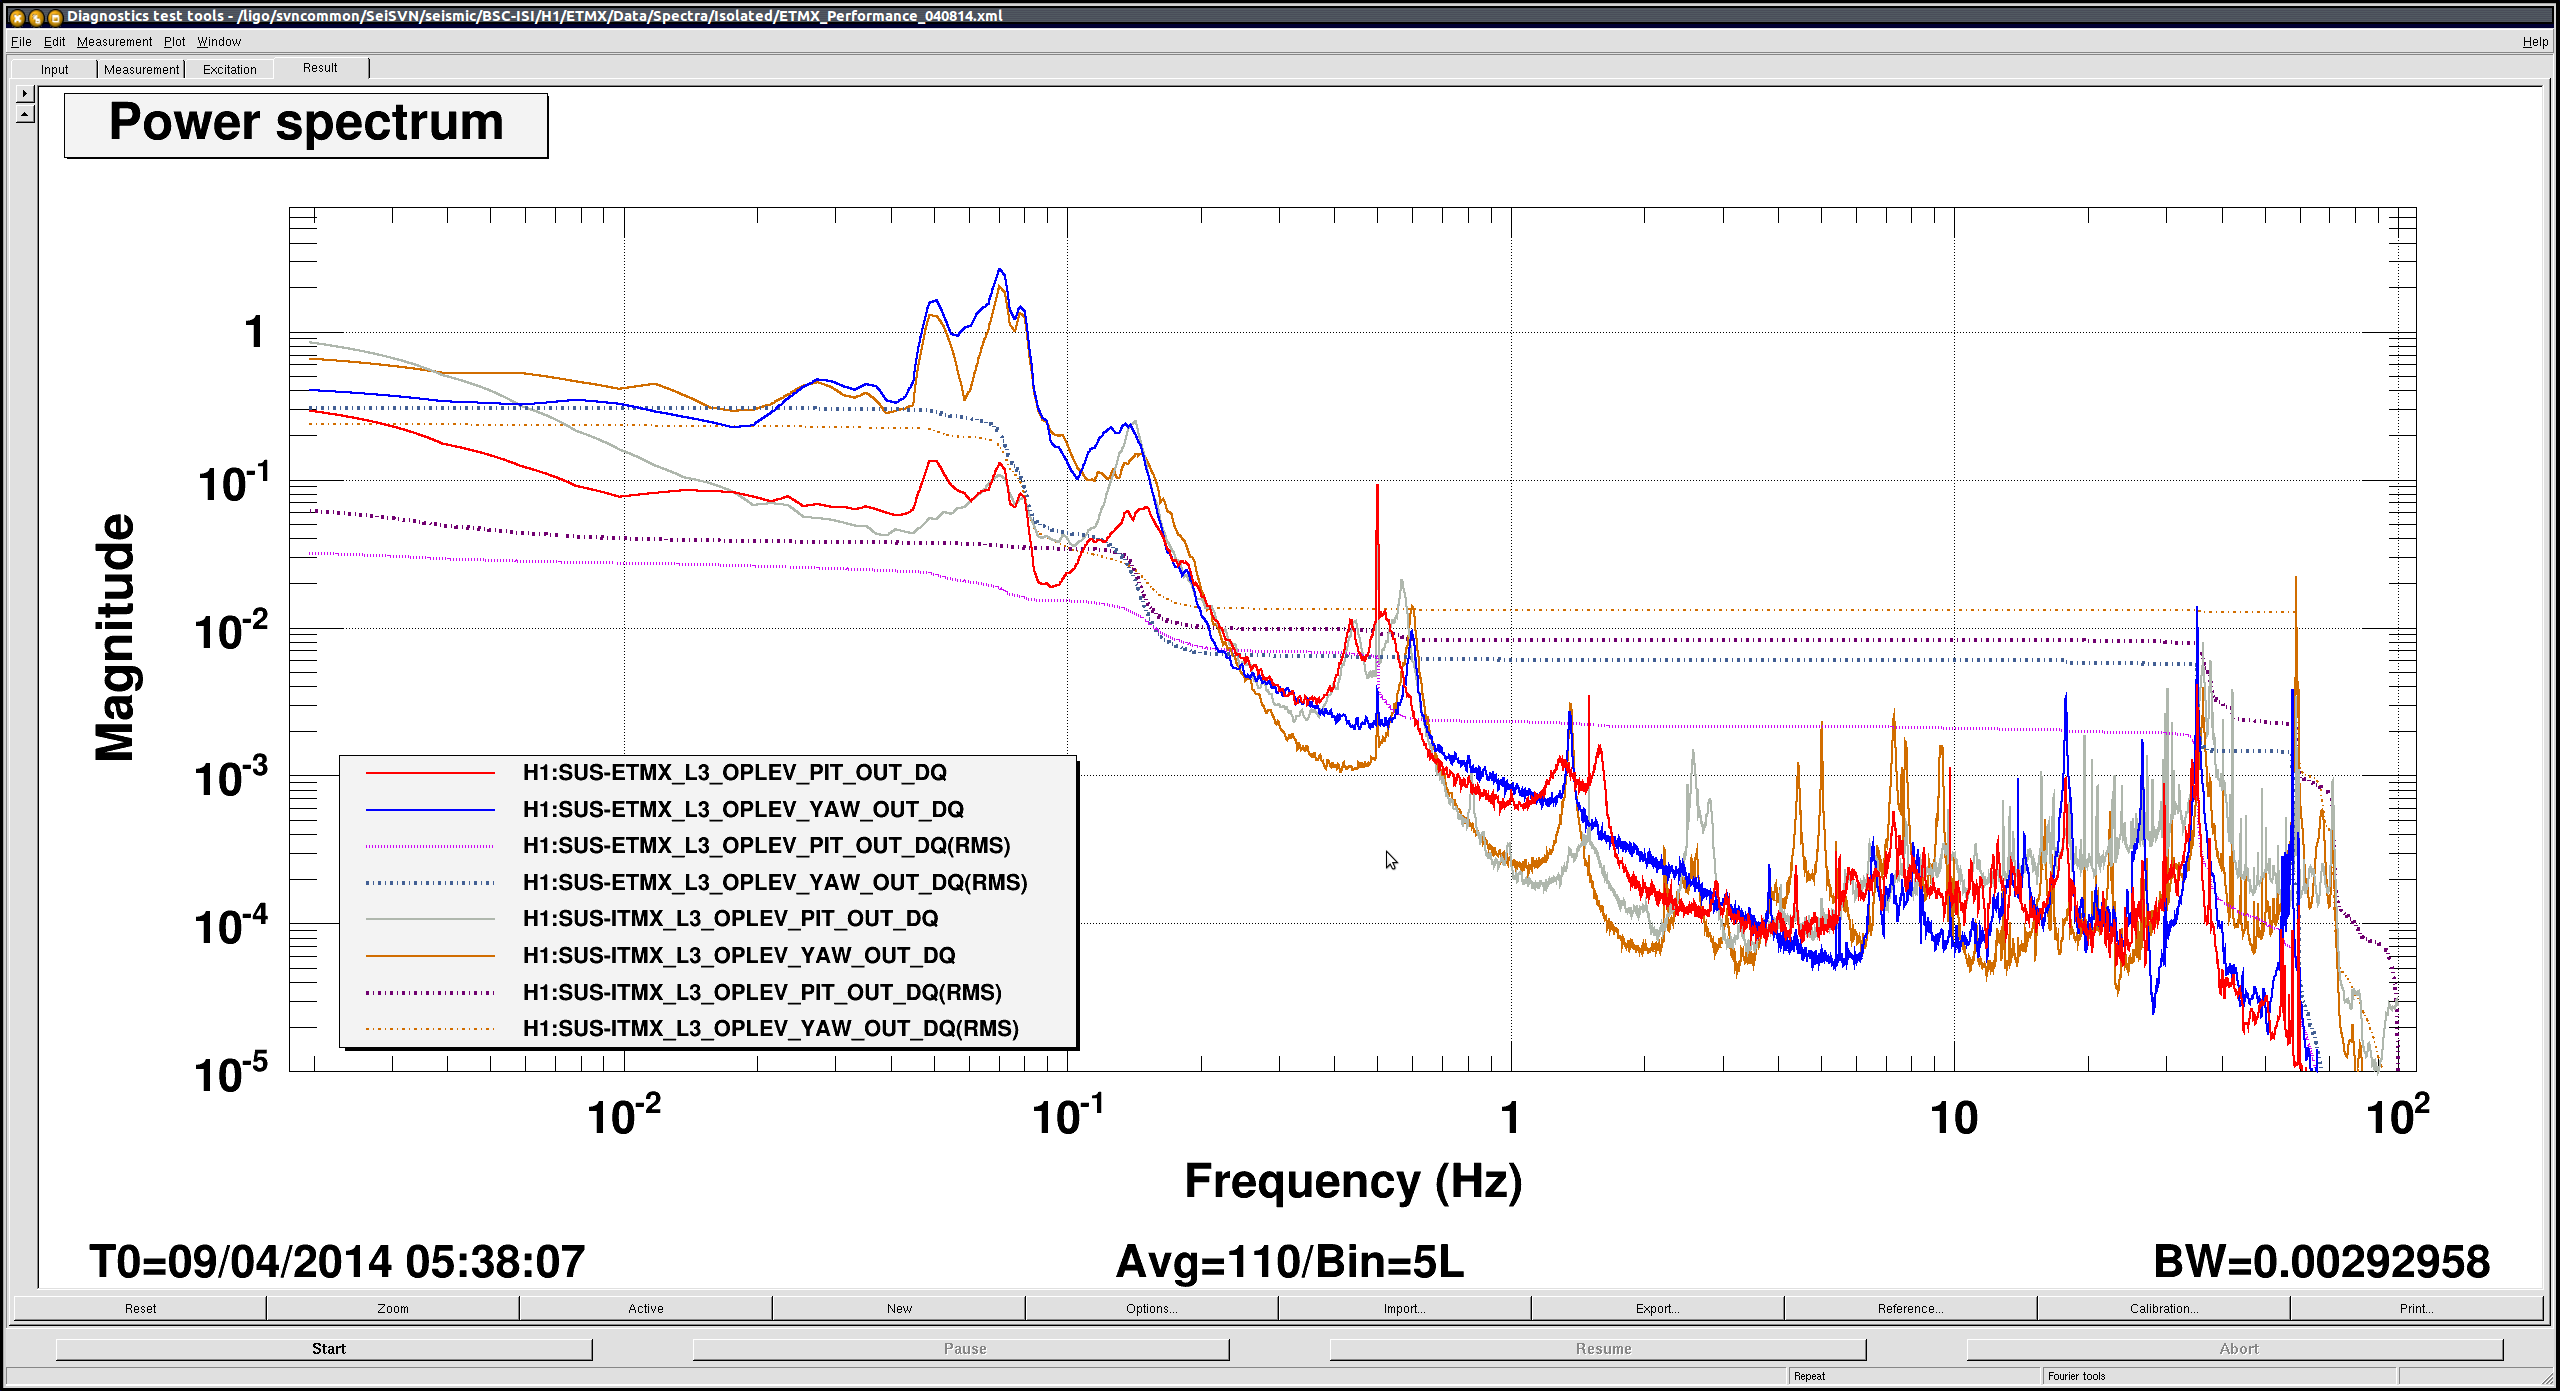
added ETMX and ITMX optical lever signals
Images attached to this comment