laura.nuttall@LIGO.ORG - posted 08:22, Friday 18 April 2014 - last comment - 11:47, Friday 18 April 2014(11429)
Something at ~11Hz is causing amplification of pier resonance at ETMY
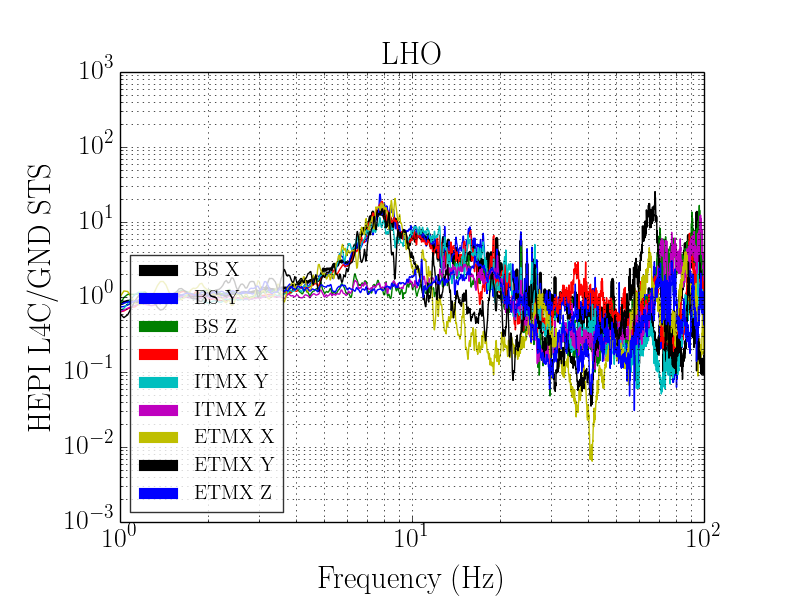
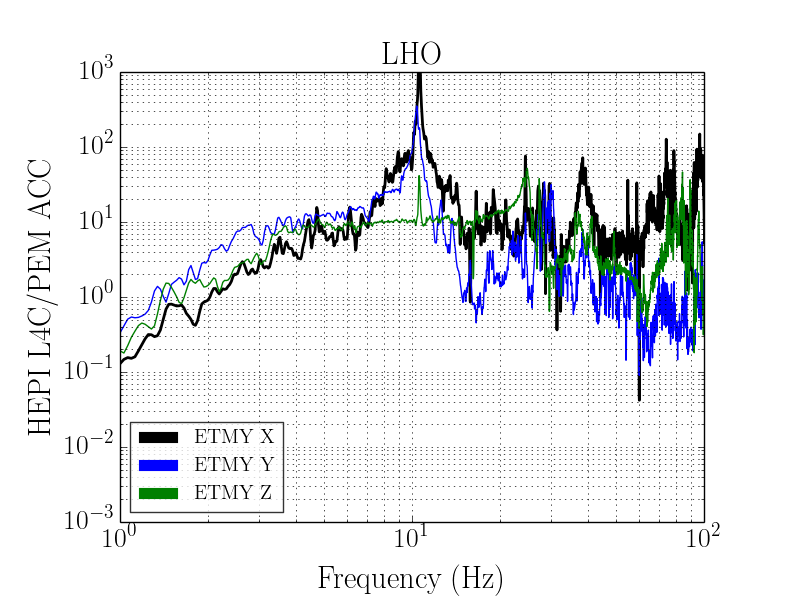
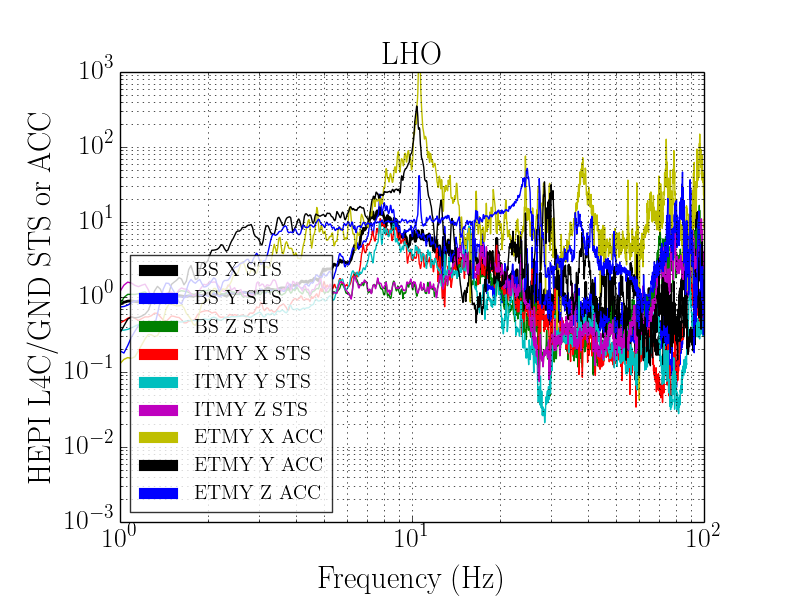
I've been looking in to the pier resonance in different chambers over 5 minutes worth of data on 16th/17th of April when the ODC reports good times for a specific chamber. The pier resonance usually appears as an increase in motion (by about an order of magnitude) when you compare the L4Cs at the top of the HEPI piers to the ground STS at ~8 Hz. The first attached image shows this comparison for BS/ITMX/ETMX which all show this pier resonance in the X and Y directions only (this plot is 5 minutes worth of data from the time in the name). If you look at however ETMY (second attached image) things look different. In this image I compared the L4C to the PEM ACC since the GND STS is outputting values close to zero. However the pier resonance seems to be amplified more than other chambers, particularly by this feature at ~11Hz which shows up in X/Y/Z directions. This is causing an extra order of magnitude increase in noise than I would normally expect for the pier amplification at ~11Hz in the X and Y directions. The third plot just shows the BS/ITMY/ETMY aswell. I've looked at several different times of day over both days and the results all look the same. It does not seem to change according to the time of day.
Images attached to this report
Comments related to this report
For info, "ODC reports good times" when HEPI is position controlled (locked to the ground)
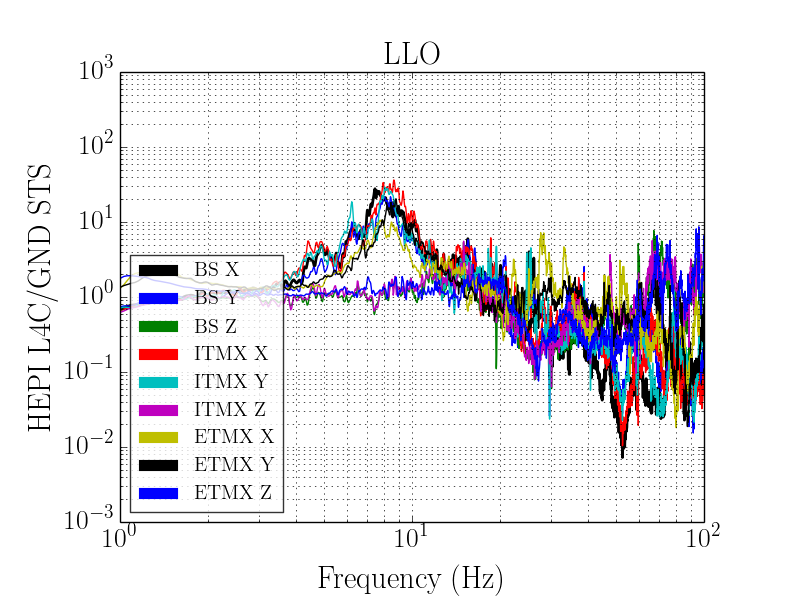
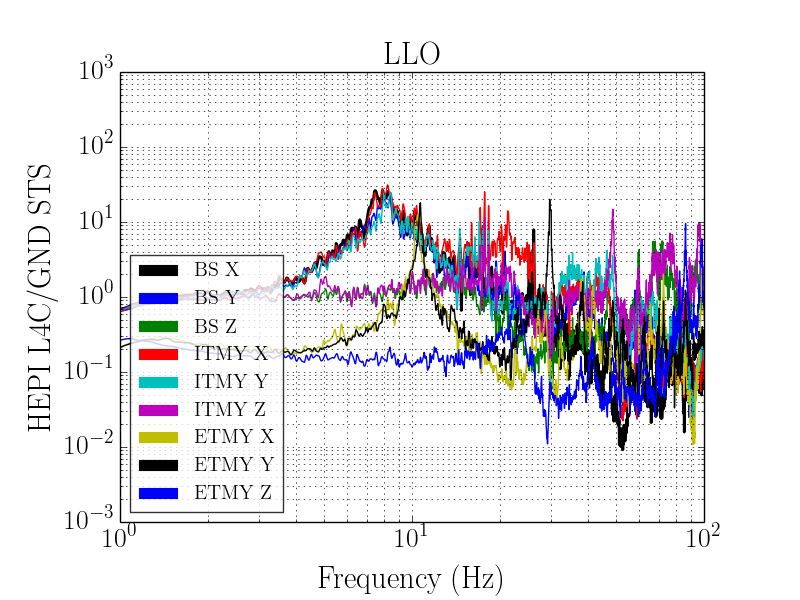
Looking at LLO

Not sure if this is related, but I looked at LLO (within the last week) at times when the ISI state vector is green (since the HEPI state vectors are hardly ever green) over 5 minutes and compared the same things as above (L4C to ground STS). BS/ITMX/ETMX (first plot) shows very similar features at both sites - a peak at ~8Hz in the X and Y directions. However when looking at BS/ITMY/ETMY (second plot) the BS/ITMY chambers at both sites look the same with a peak at ~8Hz but ETMY at LLO has a much sharper and more pronounced peak at ~11Hz in the X and Y directions. This doesn't look exactly to same as the ETMY peaks at LHO but I thought it might be interesting!
Images attached to this comment