(Daniel, Alexa)
Over the past few days we have been working on ISCT1 in order to measure the noise produced by the difference in path lengths between the POP beam and the PSL reference beam. See alog 11748 and alog 11737.
To complete the installtion, we aligned the BBPD and borrowed 15V power supply used for REFLAIR B BBPD on the table. We measured the power of the PSL reference beam to be 95mW before the SHG, 90mW after the SHG and dichrioc, and 12mW after the ND06A and 50/50BS. With the BBPD responsivity of 0.1A/W and 2kOhm trans at DC and RF, this amounts to 2.4V at DC. We measured about 2.5V at DC. Meanwhile for the POP beam with PRMI locked, we measured about 50uV (consistent with the 172nW --> 35uV we measured with PRX locked previously). With these values we expected a beatnote signal of about 10uV or -30dBm. Looking at an RF spectrum analyzer at both 9.1Mhz, and 45MHz, we found the beatnote maximum to be about -45dBm; this was consistent enough with our estimate since our alignment on the PD was not very good.
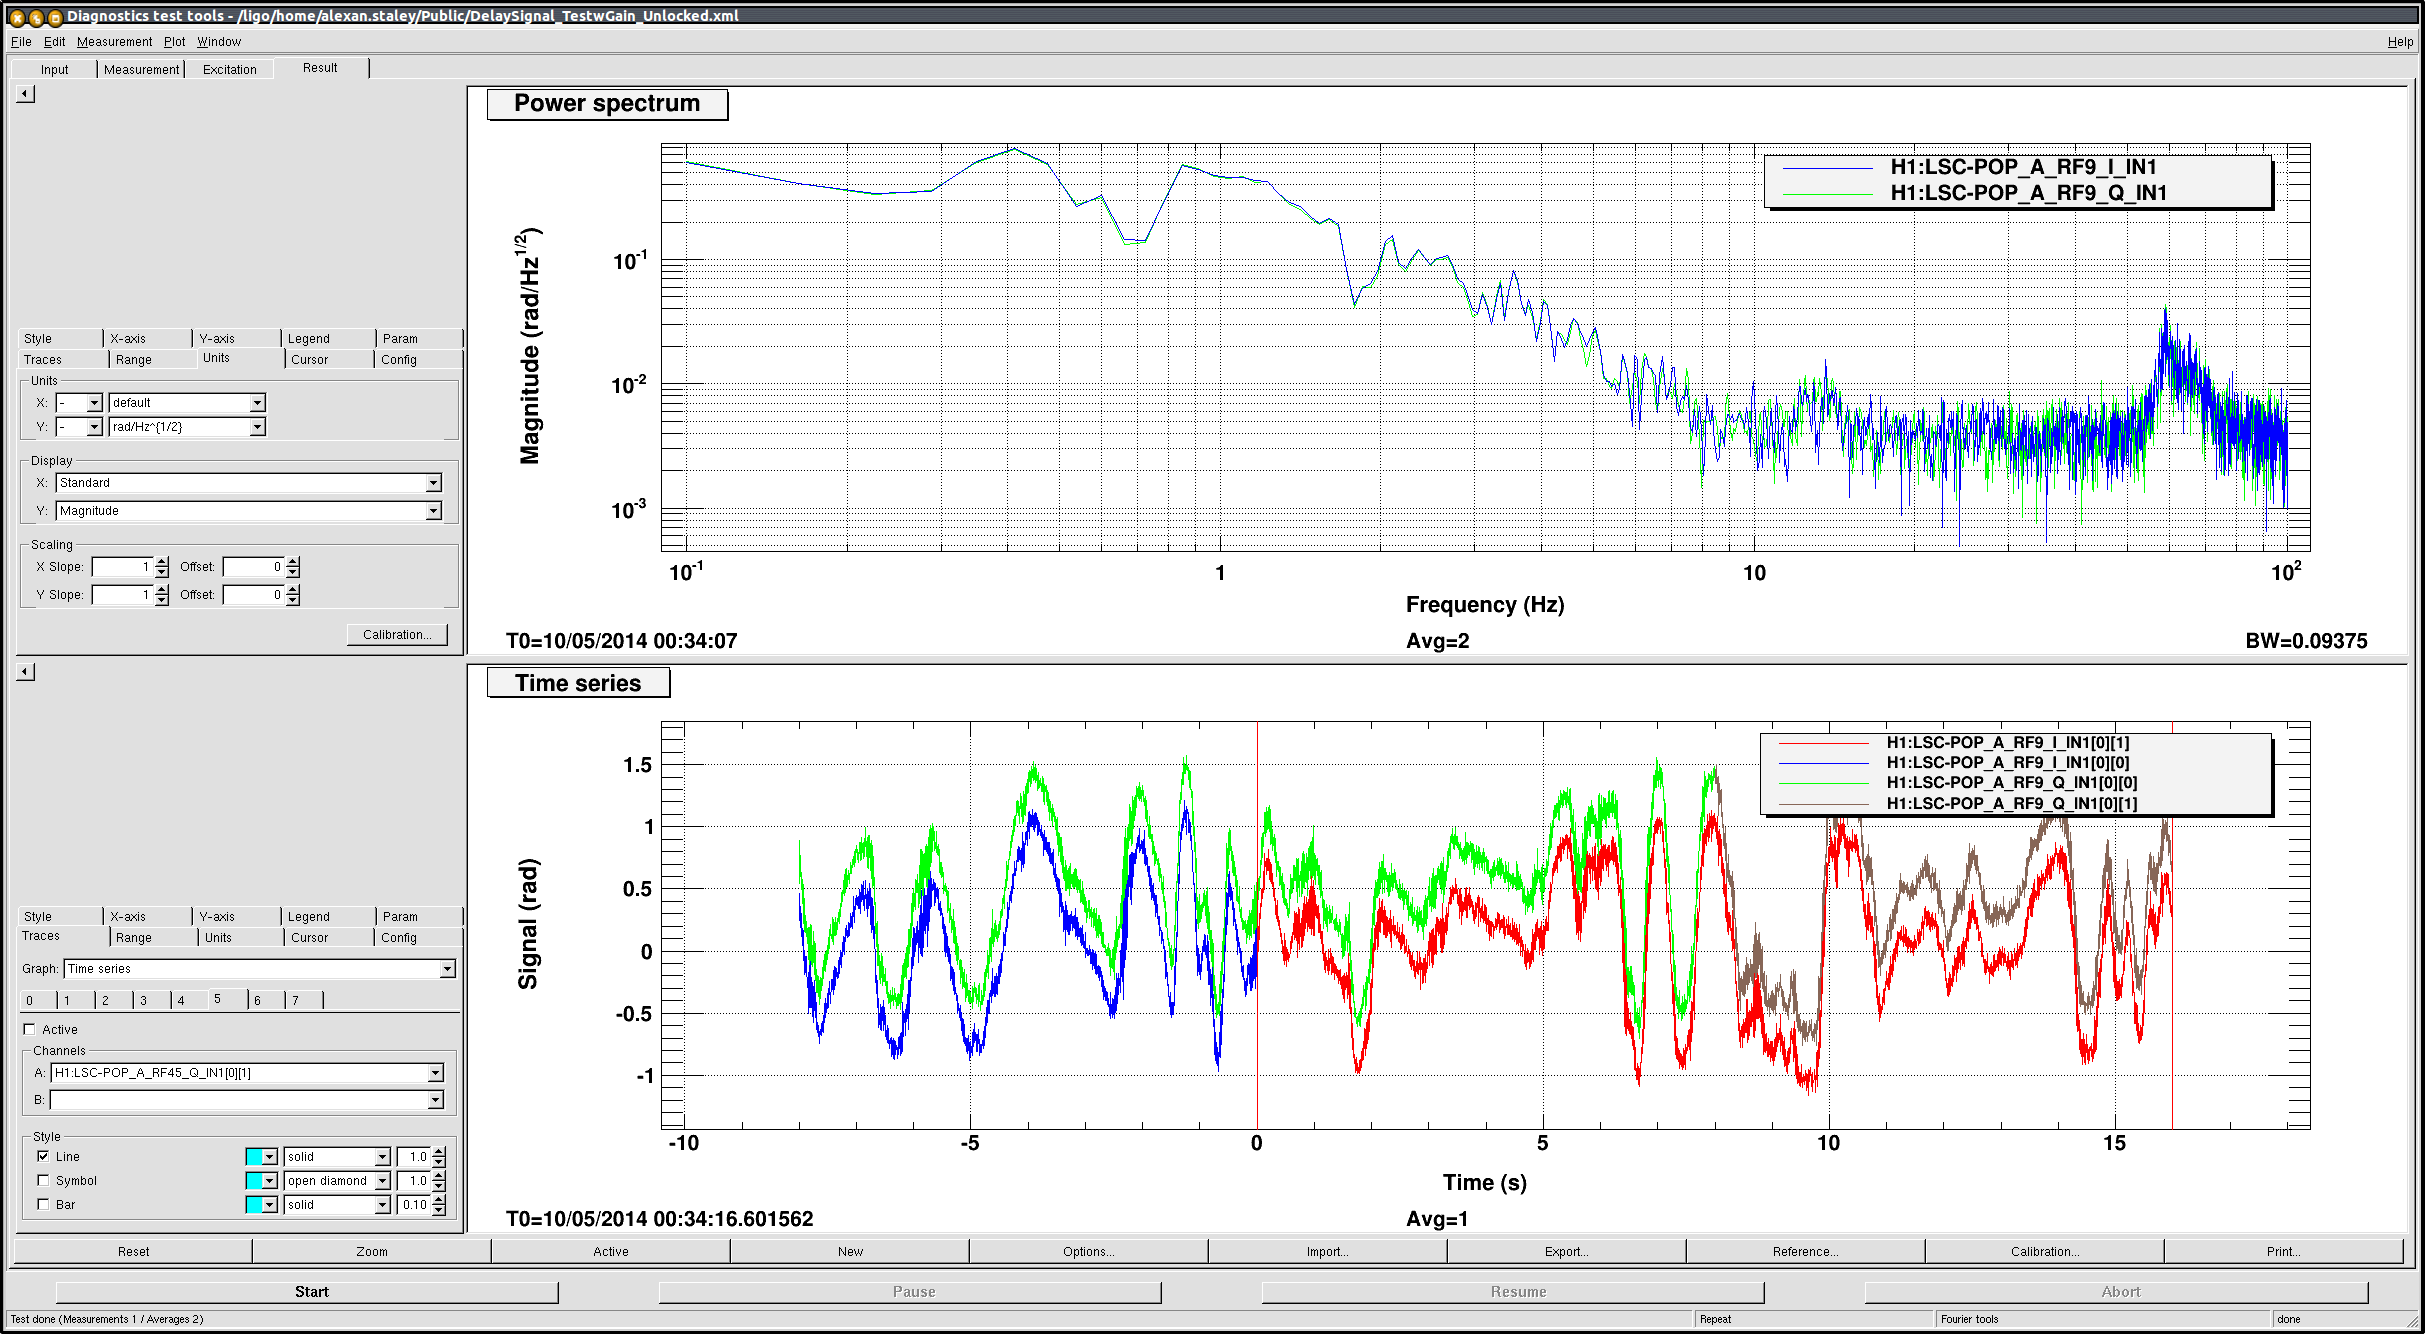
We borrowed POP_A_RF9 to look at the signal and added an RF amplifier of +30dB, and +30dB whitening gain. It was unclear to us whether we were seeing turn-arounds or fringes. We tried splitting the signal between RF9 and RF45; however, these appeared to be in phase, so this did not help us. Since we had PRMI locked during this measurement; its likely we lose some of the macroscopic length difference that arises when the cavity is moving freely during ALS. We repeated the above measurement with PRM misaligned and only using the straight shot. I have attached the time series and power spectrum displaying the result. Using the rms of the time series, we calibrated the power spectrum into rad/sqrtz for red. The ALS beam to ISCT1 is green. Since the fringe speed will be twice as fast, we must also shift the frequency to 2f (not shown in DTT image).
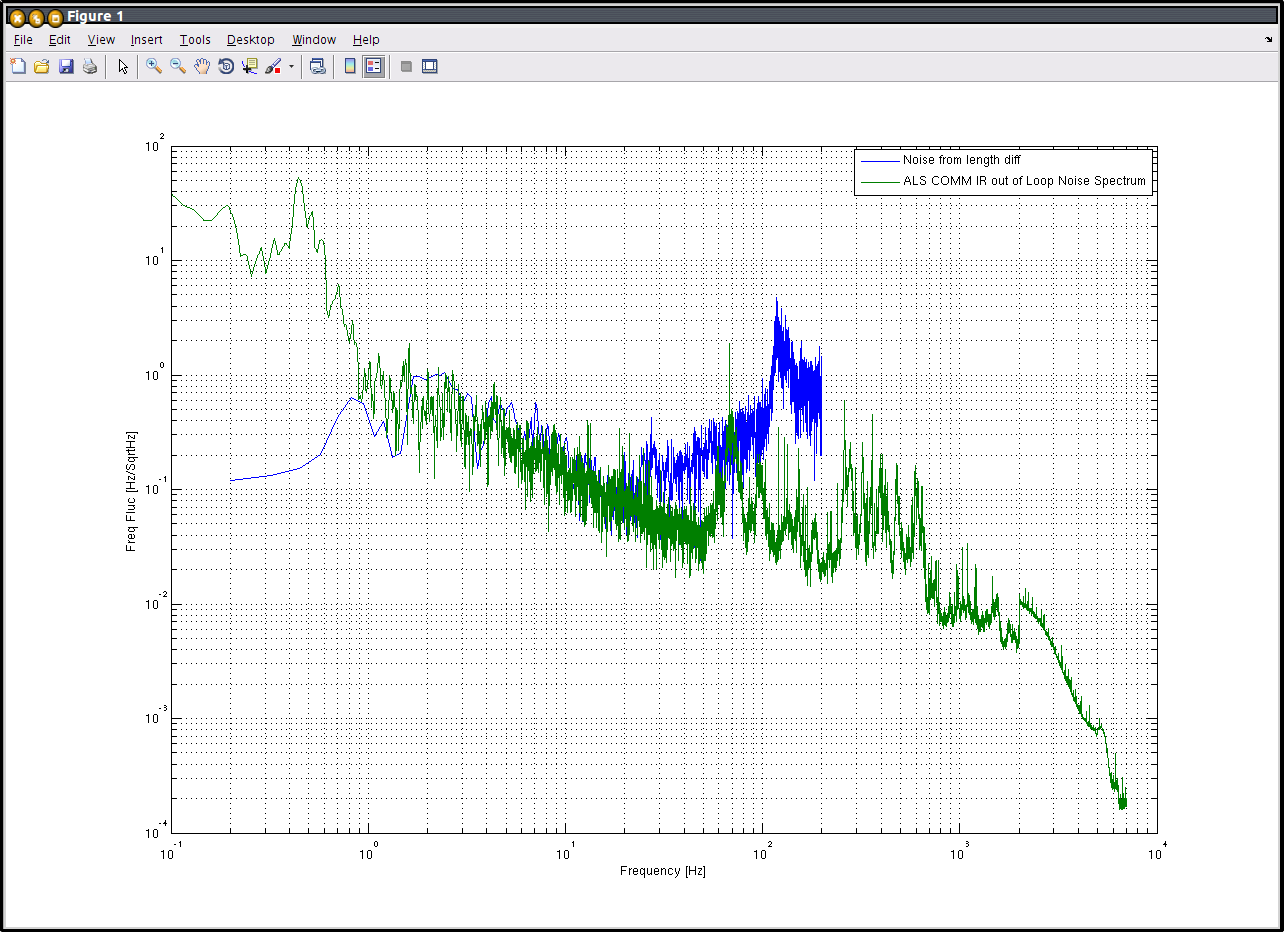
In the second plot I have attached, the green trace is the out of loop infrared noise for ALS COMM we have been using ( in particular from alog 11106). Meanwhile, the blue trace is the power spectrum calibrated back into red. From 1 to 10Hz we see that the noise produced from this path difference is very consistent with the 1/f noise we have been hunting. The measurement probably does not hold above ~20Hz.