REMOVE SEARCH FILTER
SEARCH AGAIN
Search criteria
Section: H2
Task: IOO
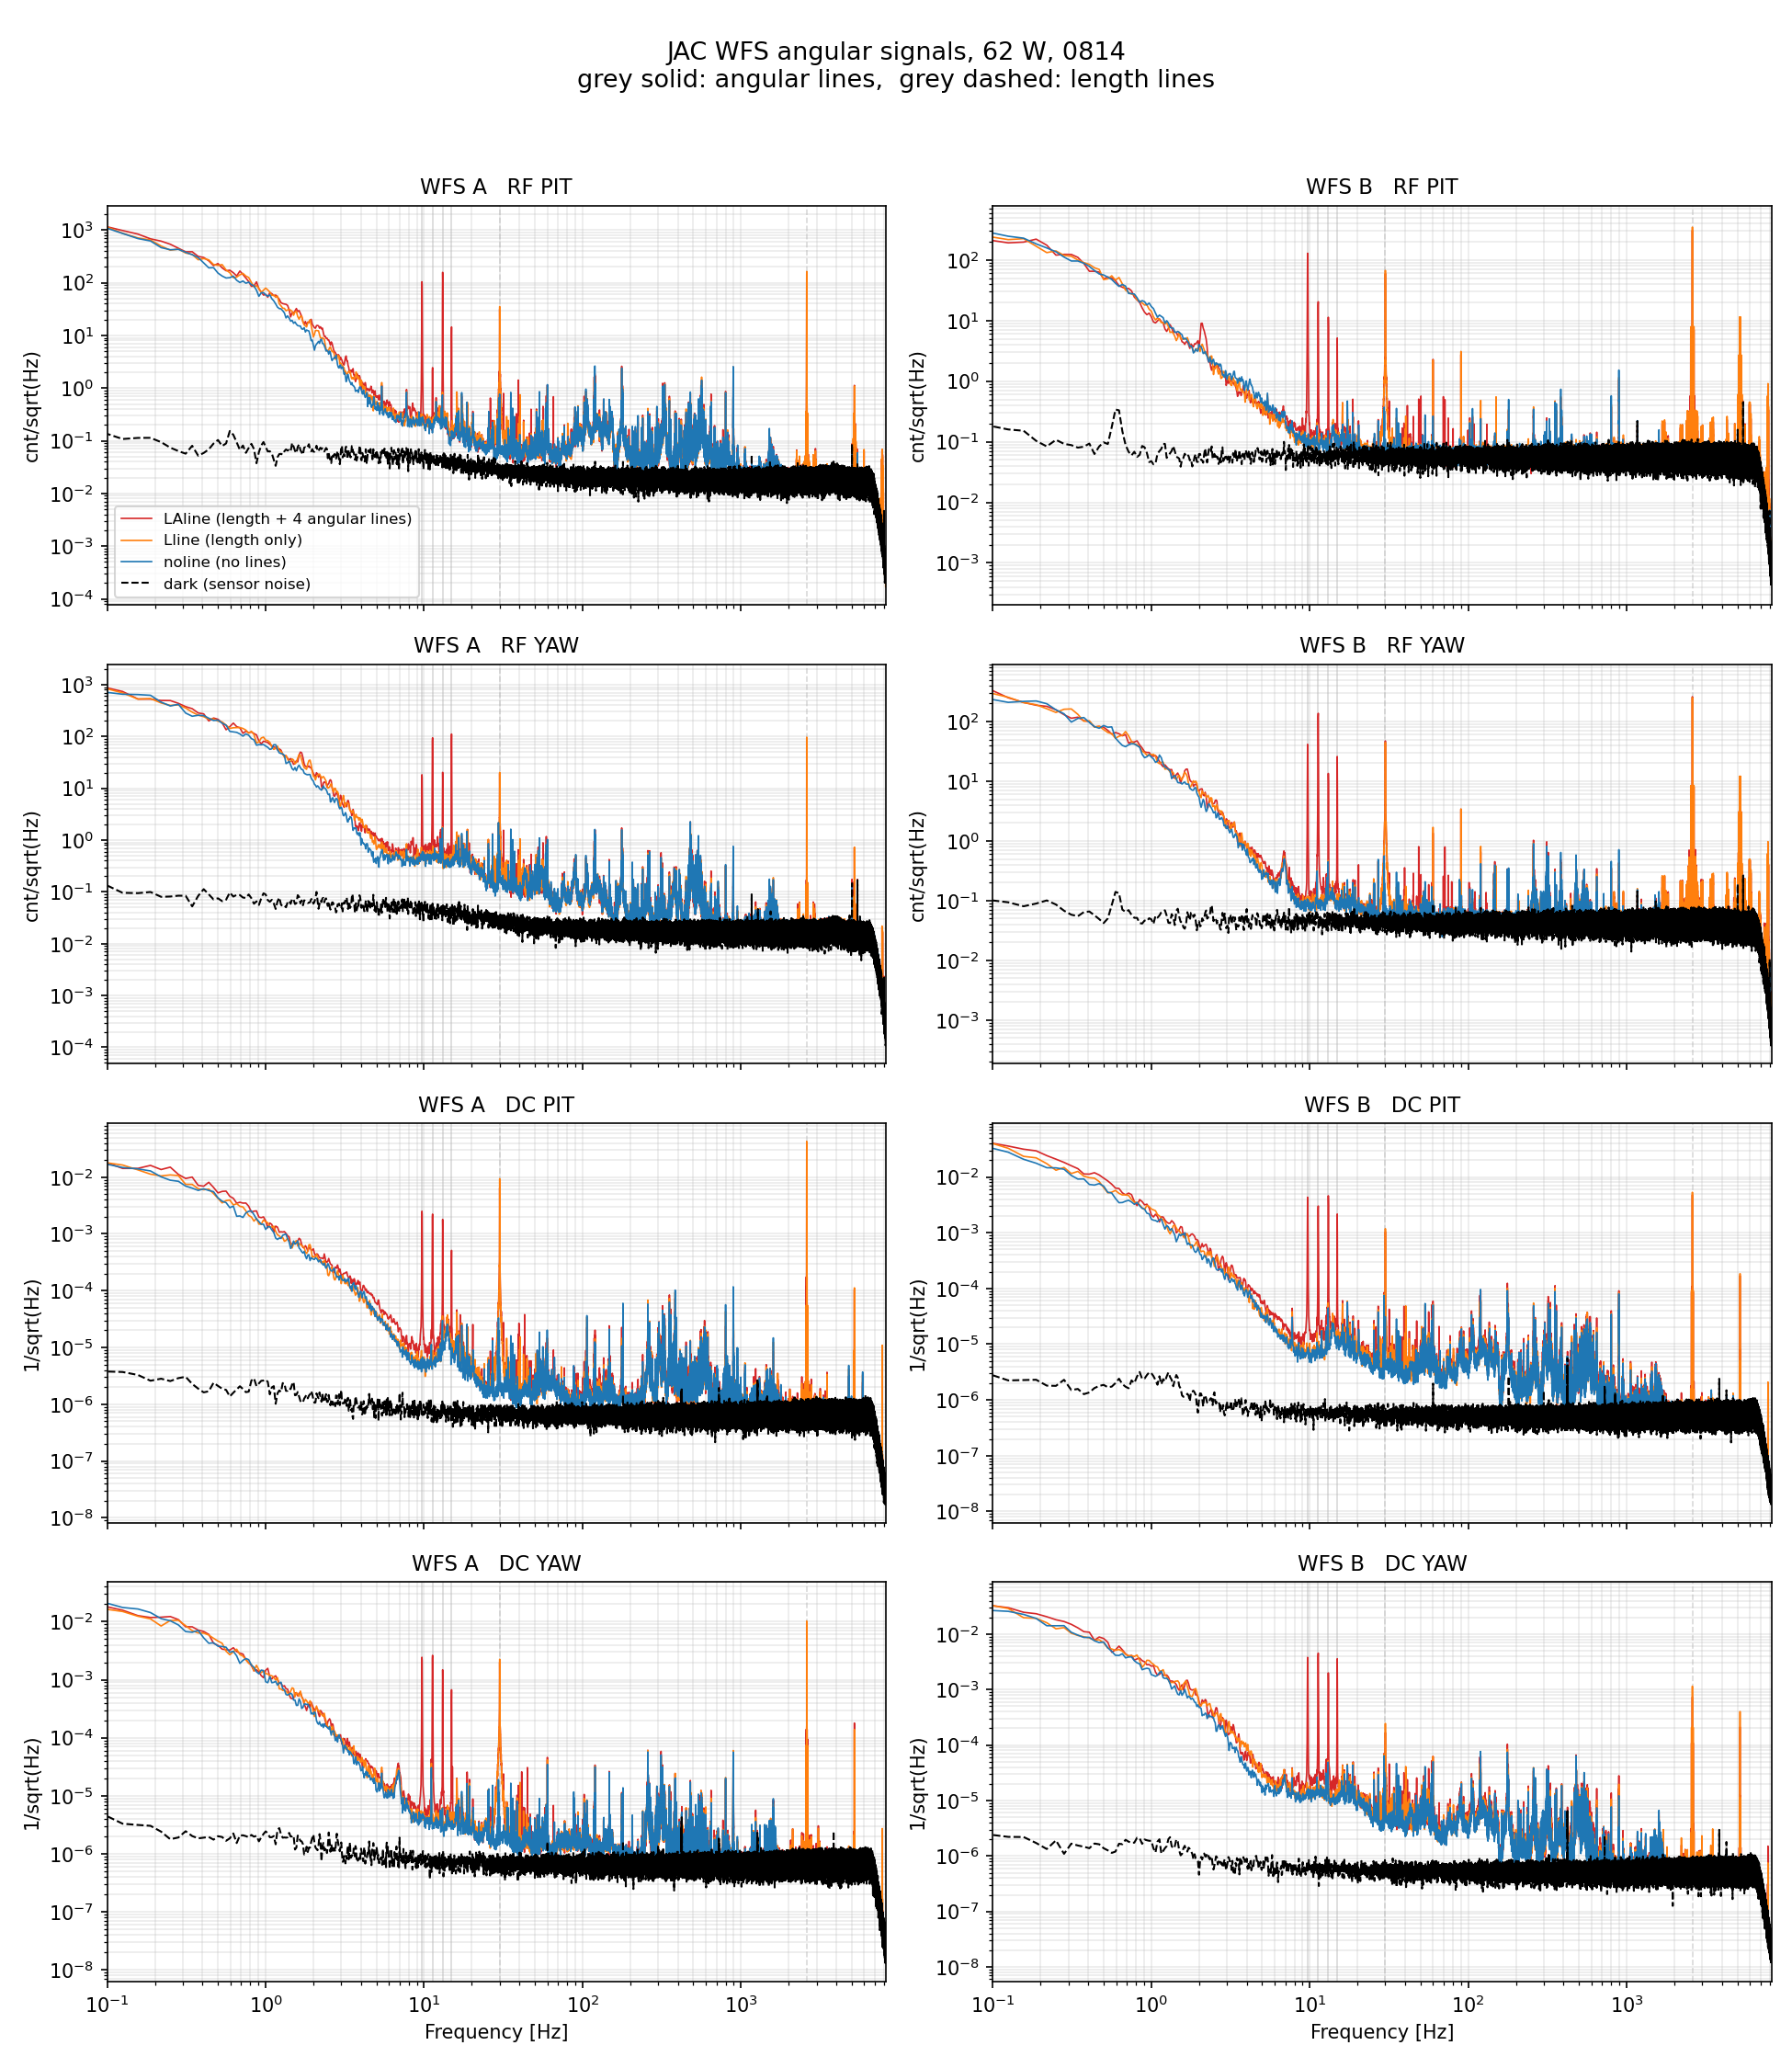
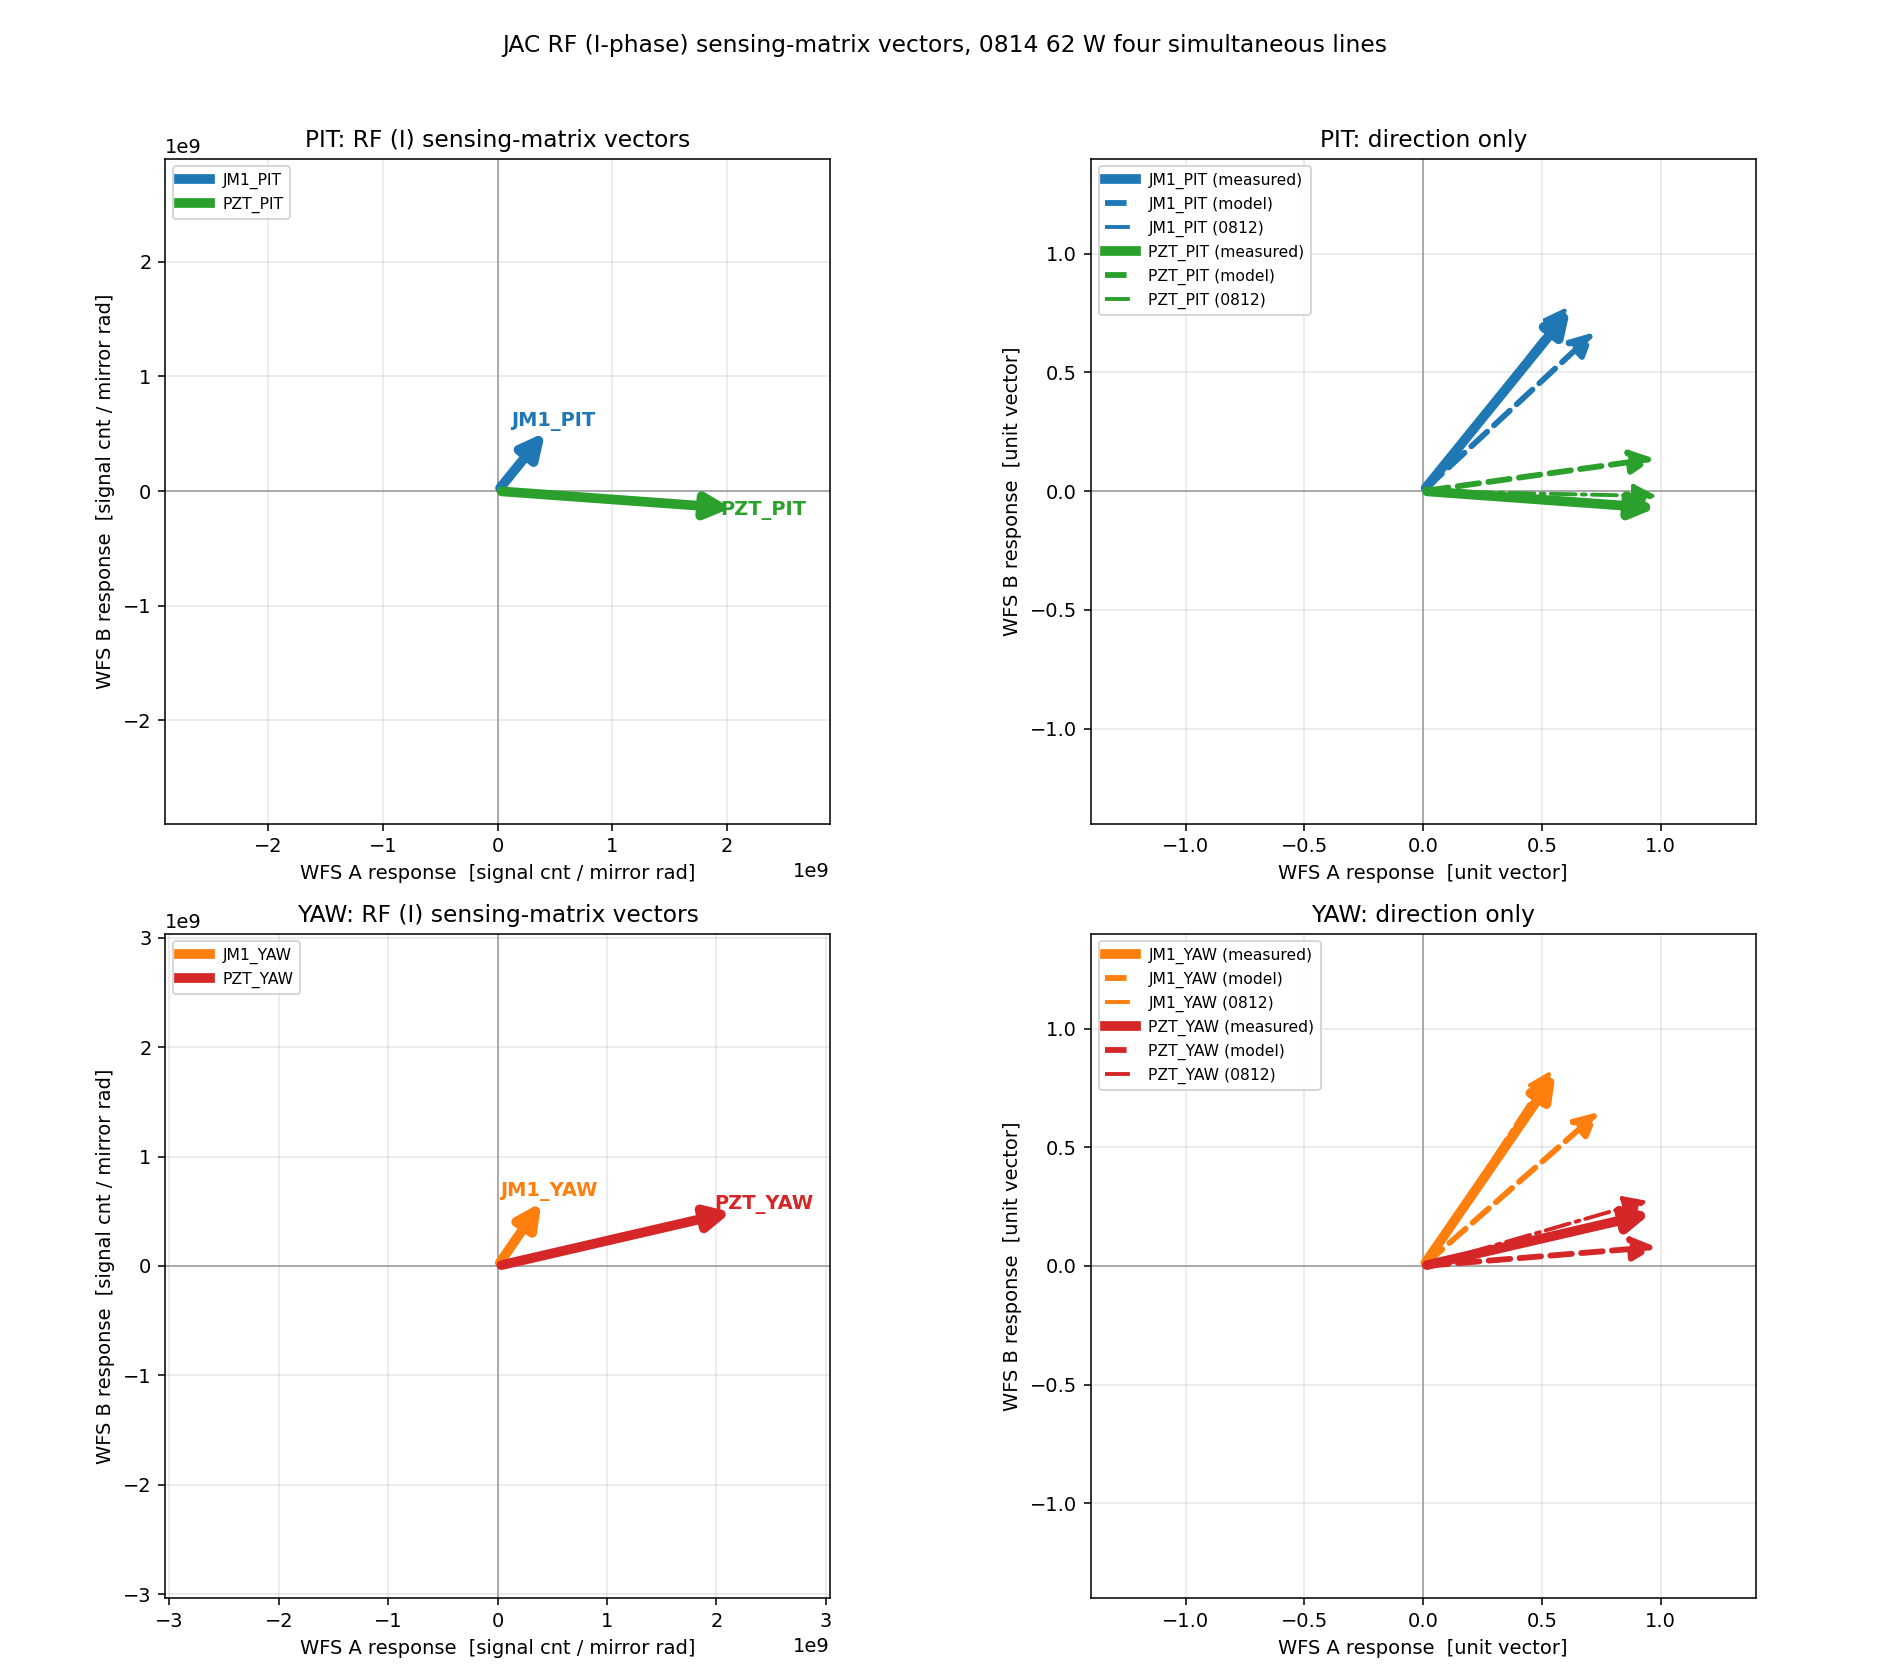
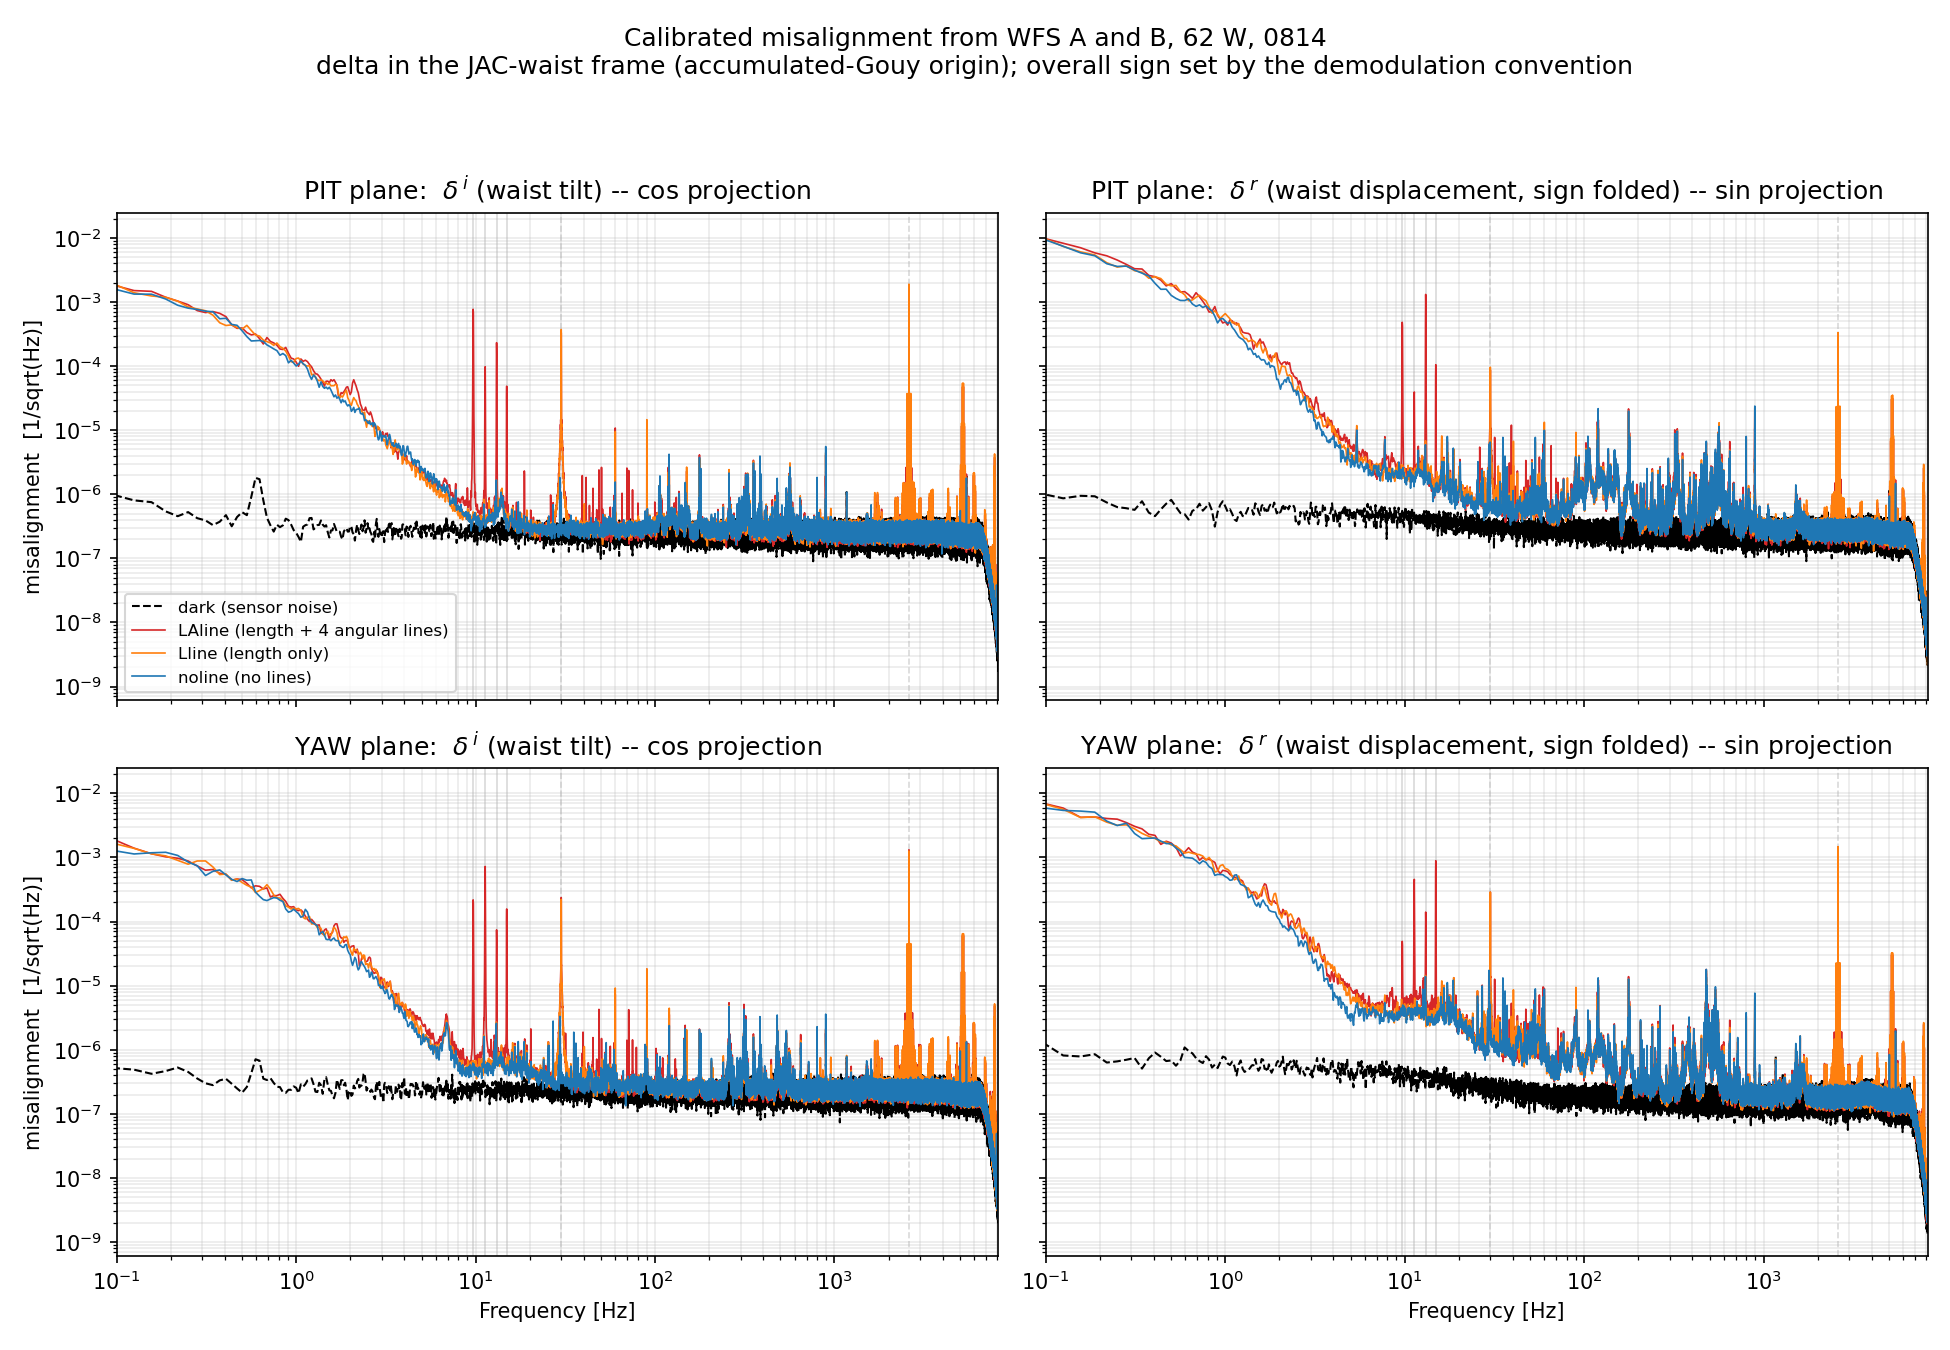
I calibrated the JAC WFS A/B RF signals into the complex misalignment amplitude at the JAC waist, using four angular calibration lines at 62 W (measurement of Aug 14). The sensing matrix agrees with the one measured on Aug 12 and with the layout. Converting the two WFS signals into the real and imaginary parts of the misalignment (δr = lateral shift at the waist, δi = tilt), the displacement part dominates by a factor of 4–5, which is consistent with the dominant jitter source being the PSL which is far (~90 deg of Gouy phase) from the JAC waist.
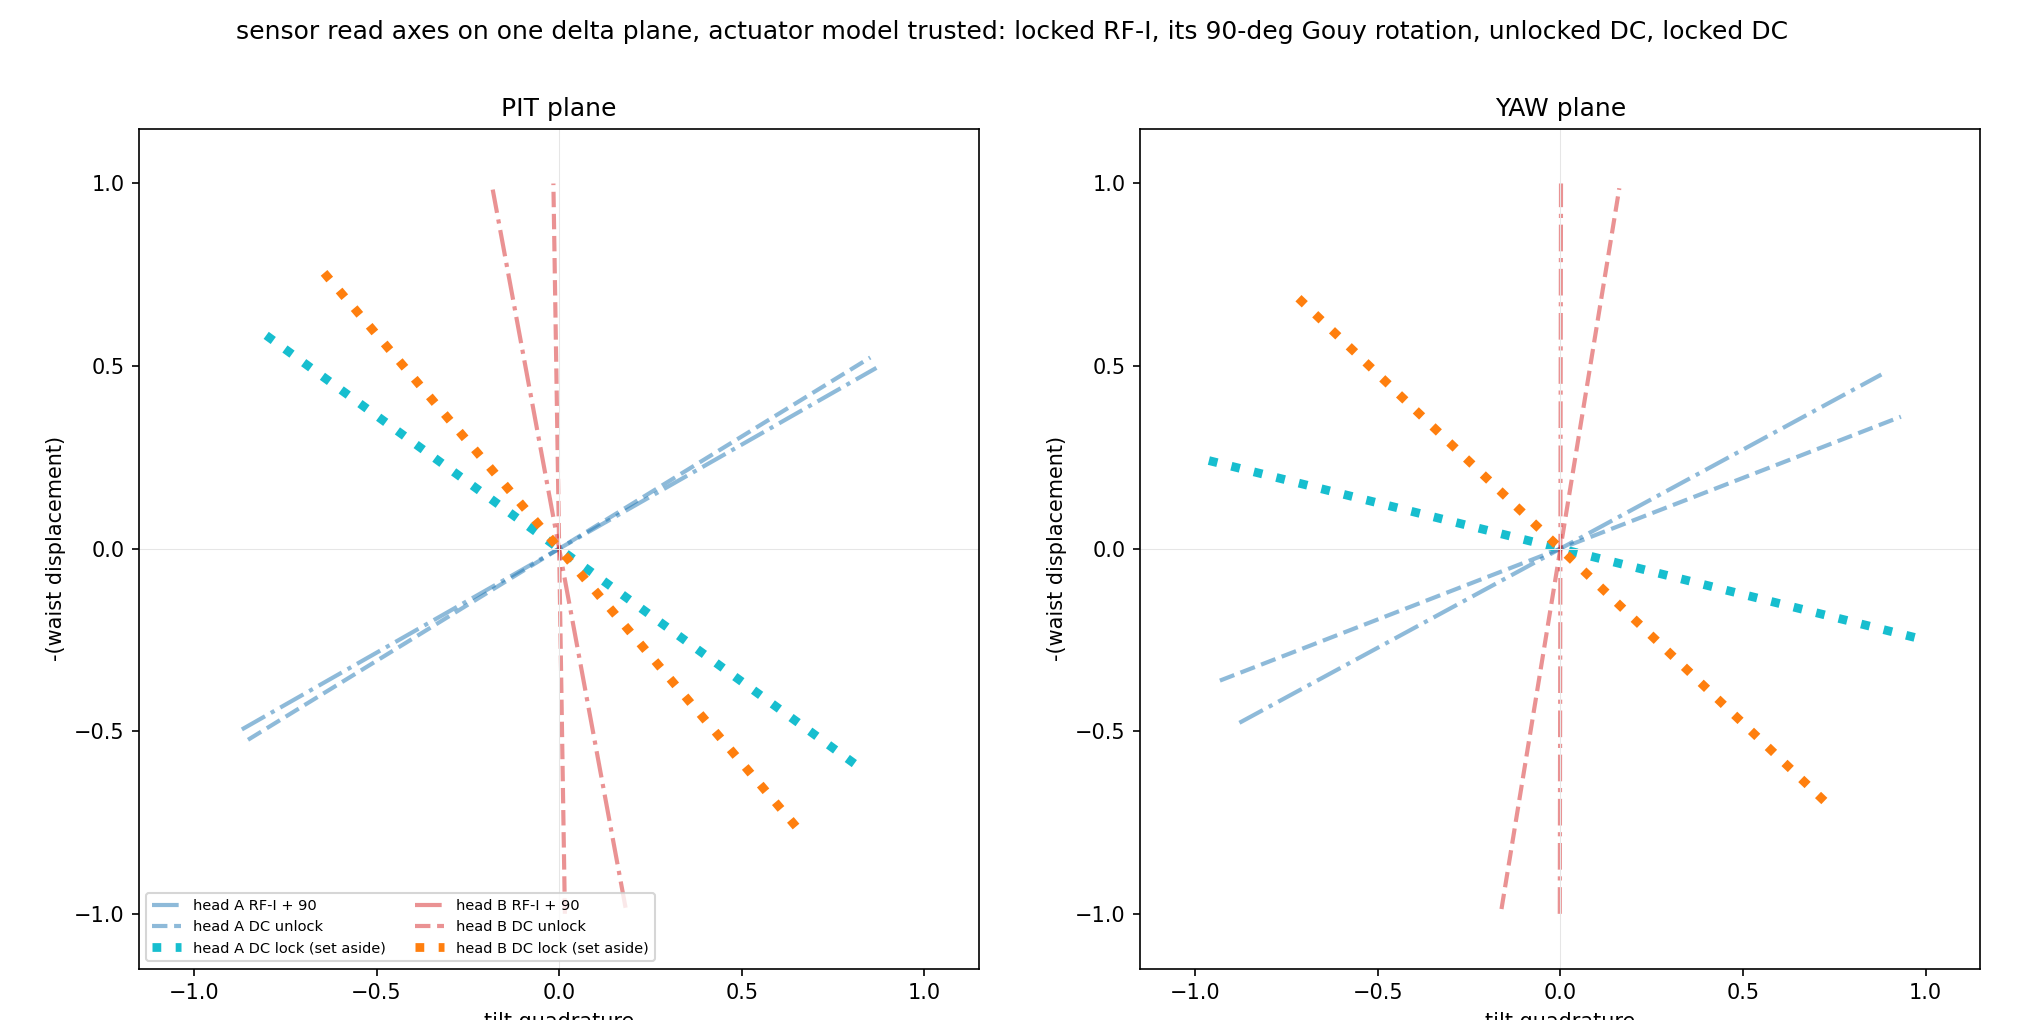
One question remains: the locked WFS DC does not sense on the plane 90 deg from the RF where it should; the unlocked DC does. Second-order modes are the prime suspect and analysis ongoing.
With the cavity locked at 62 W we injected four angular calibration lines and recorded WFS A and B (RF I/Q of all segments, and the DC segments). The raw spectra are in wfs_spectra_0814.png. Three records were taken: all lines on ("LAline"), length lines only ("Lline"), and no lines ("noline"), plus a dark record for the sensor floor. The line list is as follows:
| line | frequency | injected at |
|---|---|---|
| JM1 PIT | 9.7 Hz | SUS-JM1 M1 |
| JM1 YAW | 11.3 Hz | SUS-JM1 M1 |
| PZT PIT | 13.1 Hz | IO PZT tip/tilt |
| PZT YAW | 14.9 Hz | IO PZT tip/tilt |
| length | 30 Hz | cavity length |
| length dither | 2600 Hz | cavity length |
The length lines are not for this post: they provide the demodulation reference for the double-demodulation signal, to be reported separately.
From the heights of the four lines in each sensor we built the two 2x2 sensing matrix (actuator basis). The sensing-matrix vector figure is wfs_sensing_vectors_0814.png; it also carries the same measurement taken on Aug 12 and the layout-model prediction. The two measurement days agree very well. The model deviates by a few degrees per head (up to ~10 deg, table below), which we do not worry about, since WFS placement uncertainties and the actuators' own Gouy-phase uncertainties are of this order.
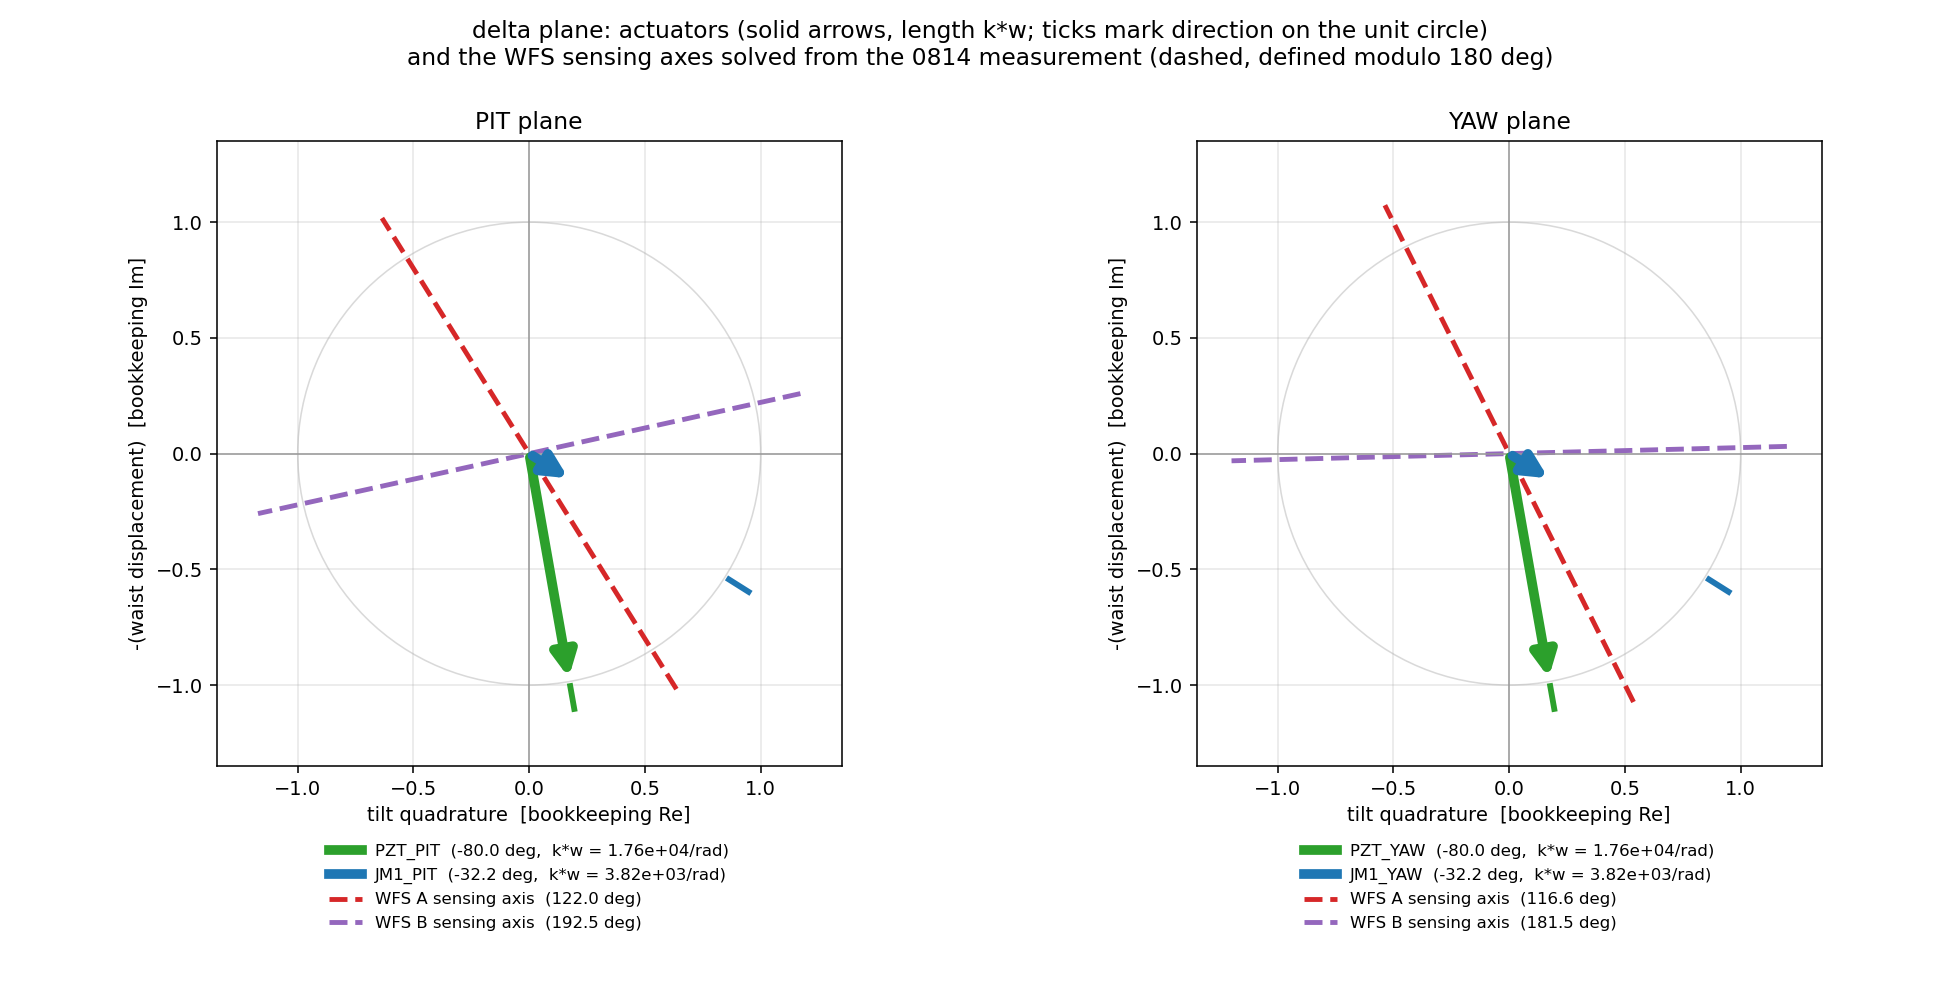
The delta plane is the complex amplitude of the TEM10/01 content referenced at the JAC waist (accumulated Gouy phase = 0 there): the real axis is the waist lateral shift, the imaginary axis the tilt. An actuator kicking by an angle at accumulated Gouy phase ηa drives this amplitude with phase i·eiηa; a sensor reads the projection of the amplitude onto its own axis.
Actuator parameters taken from the layout model (accumulated Gouy referenced to the JAC waist):
| actuator | ηacc [deg] | w at actuator [mm] | k·w [per rad] |
|---|---|---|---|
| PZT (PIT/YAW) | -80.0 | 2.99 | 1.76e4 |
| JM1 (PIT/YAW) | -32.2 | 0.65 | 3.82e3 |
Solving each head's sensing axis from its response to the two actuators of its plane:
| sensor | η measured [deg] | η model [deg] | diff [deg] |
|---|---|---|---|
| A PIT | 122.0 | 120.2 | +1.9 |
| B PIT | 192.5 | 182.4 | +10.1 |
| A YAW | 116.6 | 121.9 | -5.3 |
| B YAW | 181.5 | 185.7 | -4.2 |
The actuator vectors and sensor axes on the delta plane are drawn in wfs_delta_plane_0814.png.
With these calibration I got the main plot(wfs_delta_spectra_0814.png.) The two WFS signals inverted into the calibrated complex misalignment at the JAC waist, δr (lateral shift) and δi (tilt).
Calibrating the WFS DC the same way should give a sensing plane rotated 90 deg from the RF: the RF reads the tilt-like quadrature at its axis, the DC reads the beam position. But actually, tt does not. In wfs_sensor_gouy_states_0814.png the cyan/orange lines (locked-DC sensing axes) should lie on the blue/red dash-dotted lines (the RF axes rotated by 90 deg), but they point 30–70 deg away. The same solve on an unlocked, clean beam lands within about 10 deg of the expectation, so the sensors themselves are fine: something in the locked field is doing it, and the second-order (mode-mismatch) content is strongly suspected.
The analysis of this signal is in progress and will be posted shortly. Stay tuned.
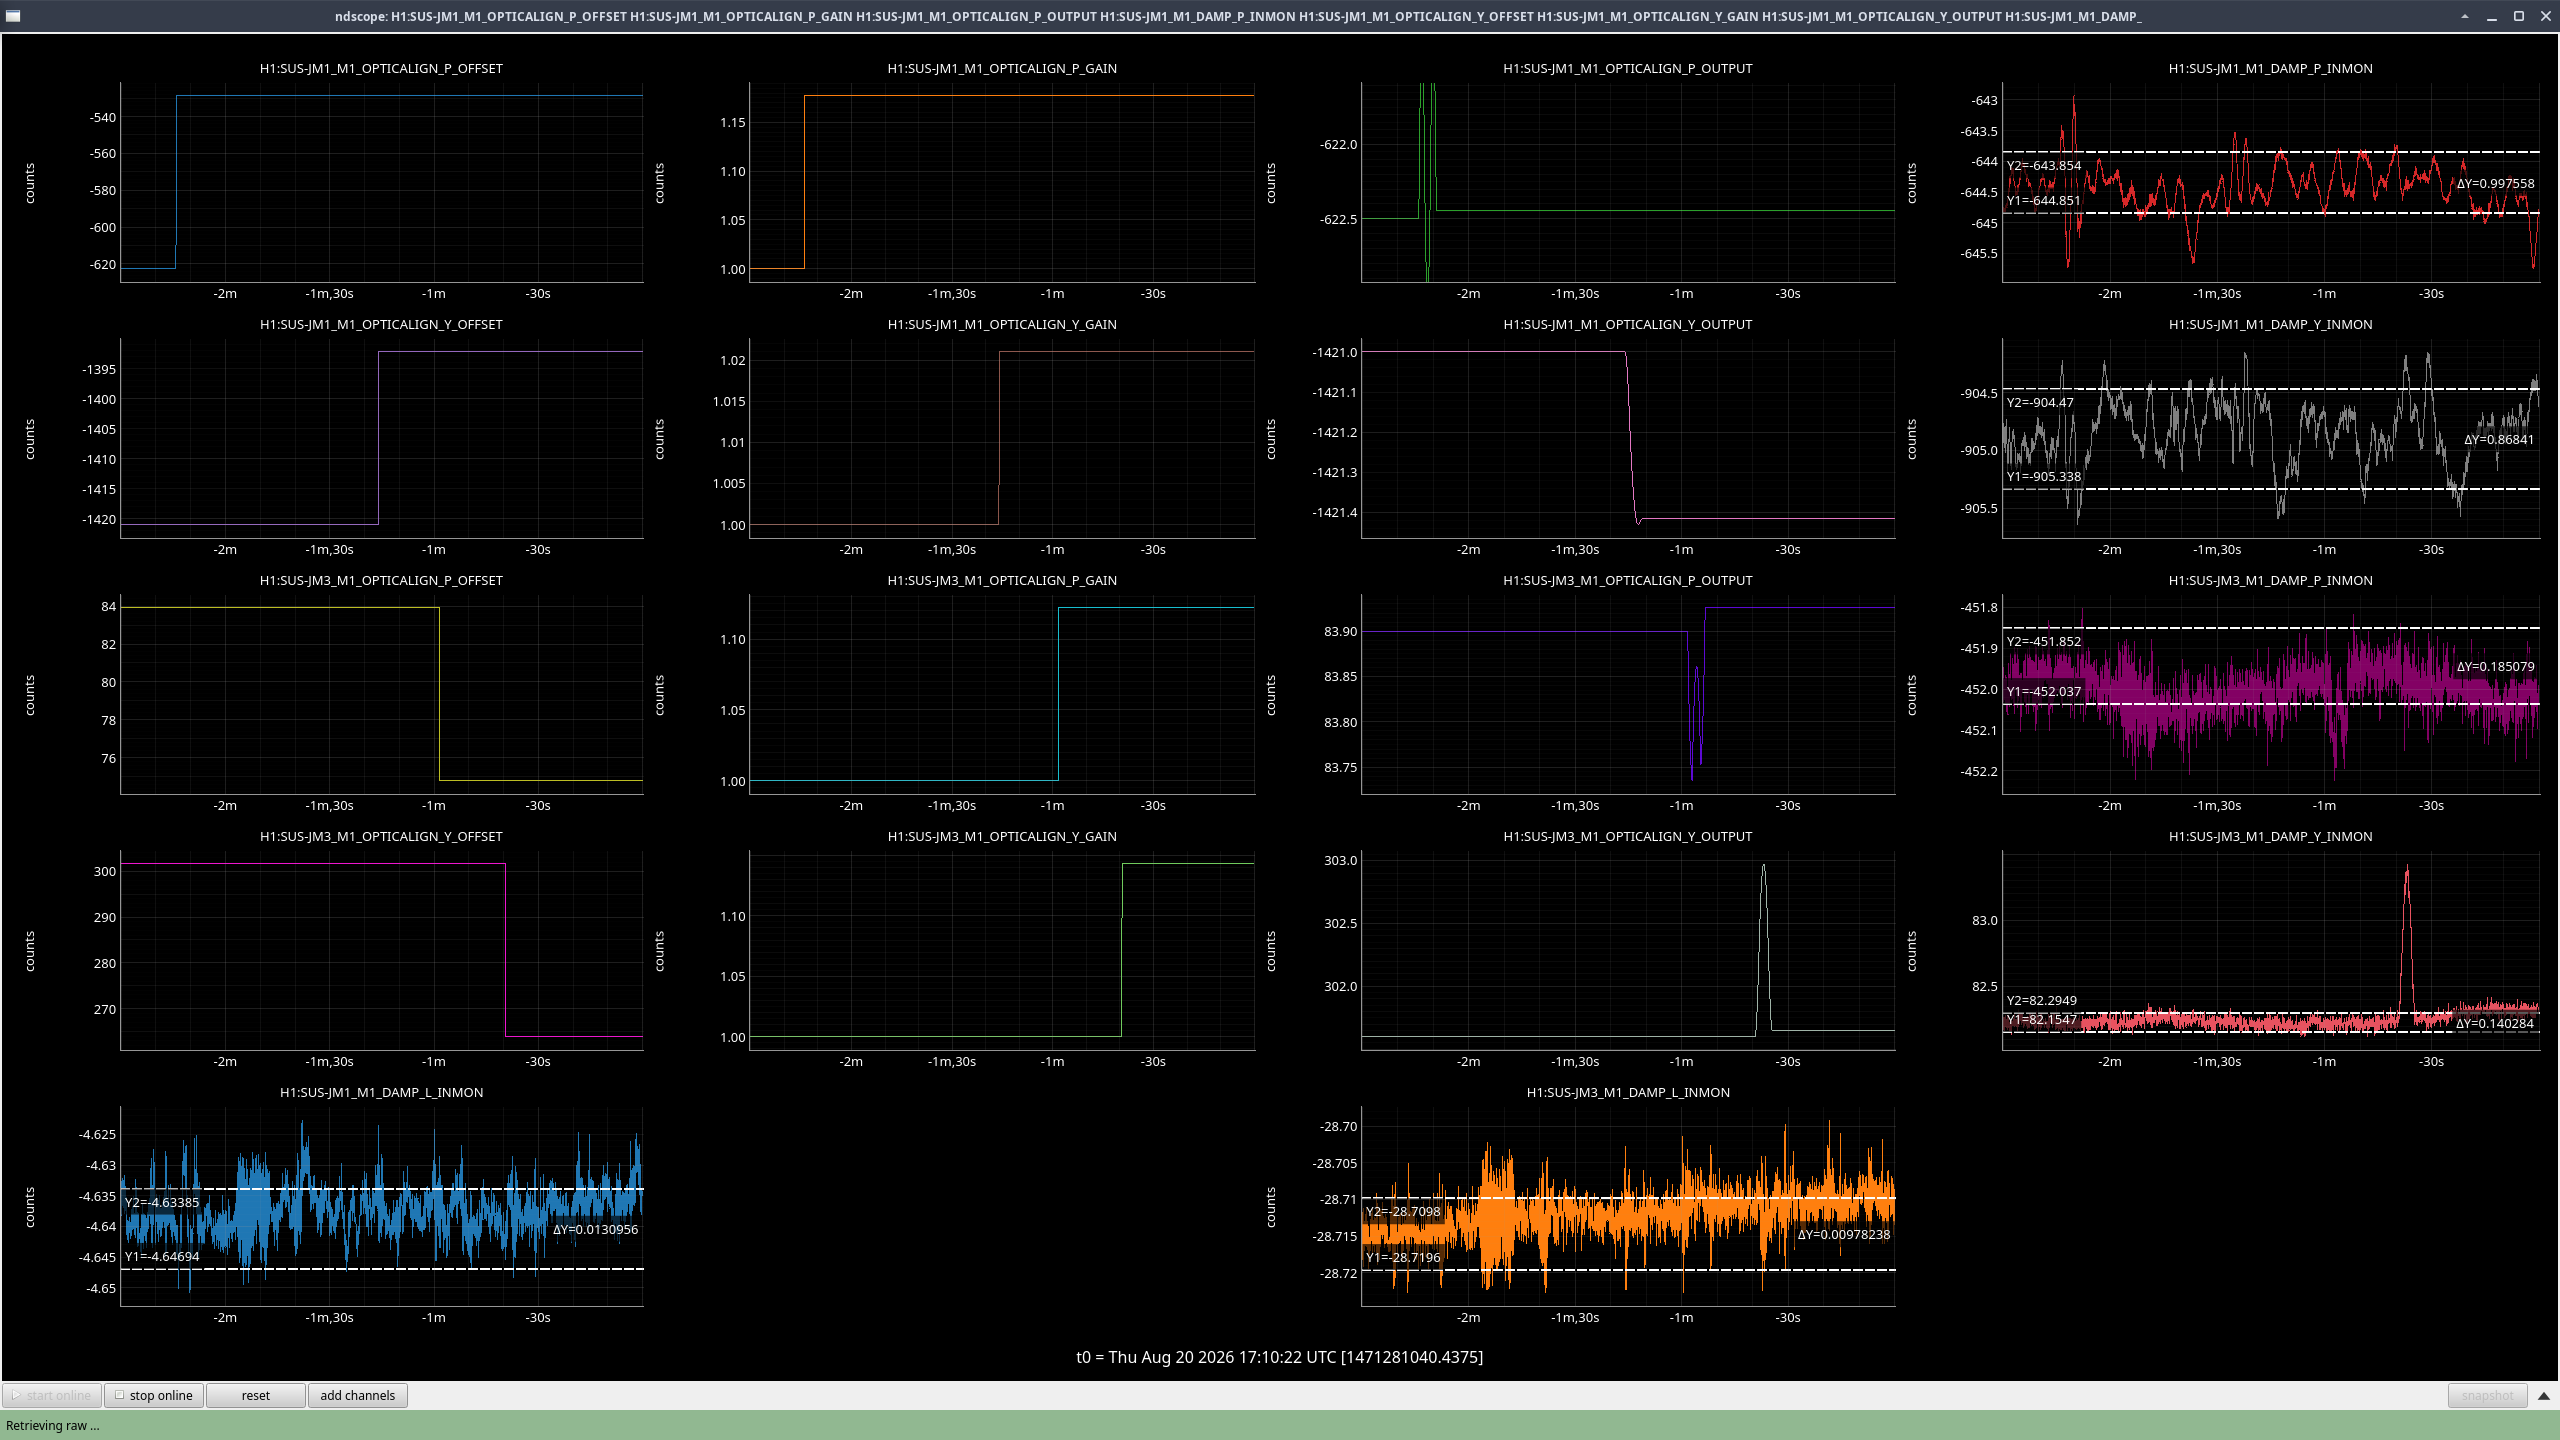
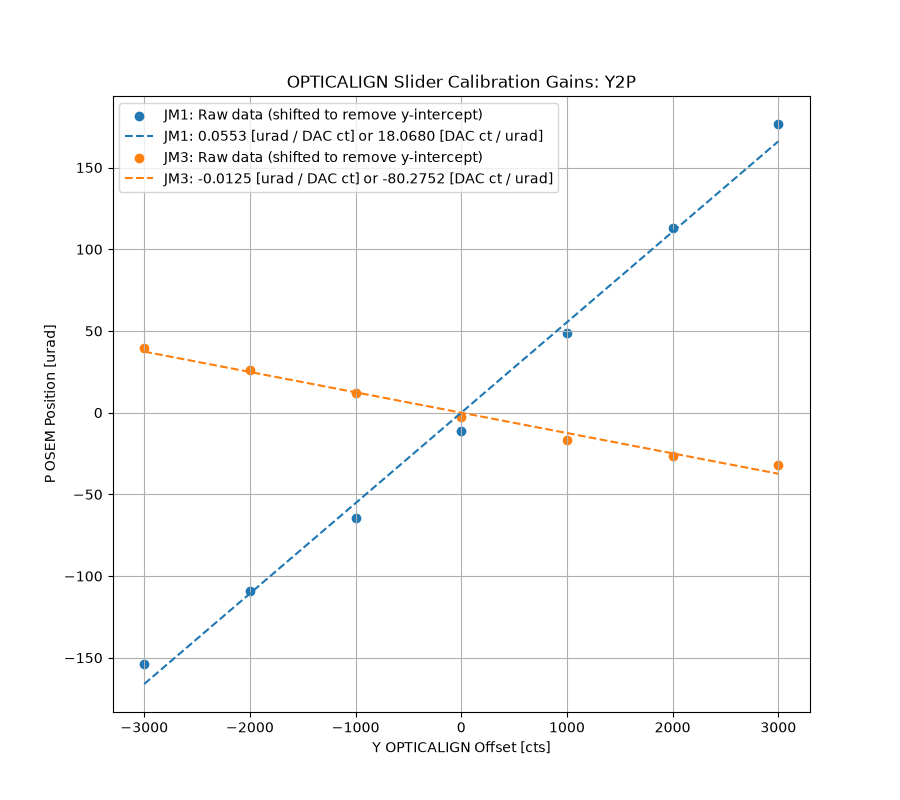
Calibration into urad has been done for JM1 and JM3's OPTICALIGN slider gains. The JM1 P and Y gain values match well with the values Masayuki found using a different method (91487), which is a nice double check.
The values to be put in {JM1,JM3}_OPTICALIGN_{P,Y}_GAIN and the necessary changes to the OFFSET values to keep the (current) OPTICALIGN OUTPUT the same are below, and were installed as of 2026/08/20 17:08-17:10UTC. Checking H1:SUS-{JM1,JM3}_M1_DAMP_{P,Y}_IN1 shows that pointing stayed the same before vs after this transition.
NOTE: This means that comparing slider values before vs after this calibration time will not make sense. Instead, you can look at the OPTICALIGN OUT16 values or the pointing using DAMP_IN1 channels since those will stay consistant.
| JM1 | JM3 | |||||
| Calibration Gain [cts/urad] |
OUTPUT (2026/08/19) |
New OFFSET | Calibration Gain [cts/urad] |
OUTPUT (2026/08/19) |
New OFFSET | |
| P | 1.1771 | -622.5 | -528.8420695 | 1.1217 | 83.9 | 74.79718285 |
| Y | 1.0207 | -1421 | -1392.181836 | 1.1428 | 301.6 | 263.9131957 |
Finding Calibration Gains
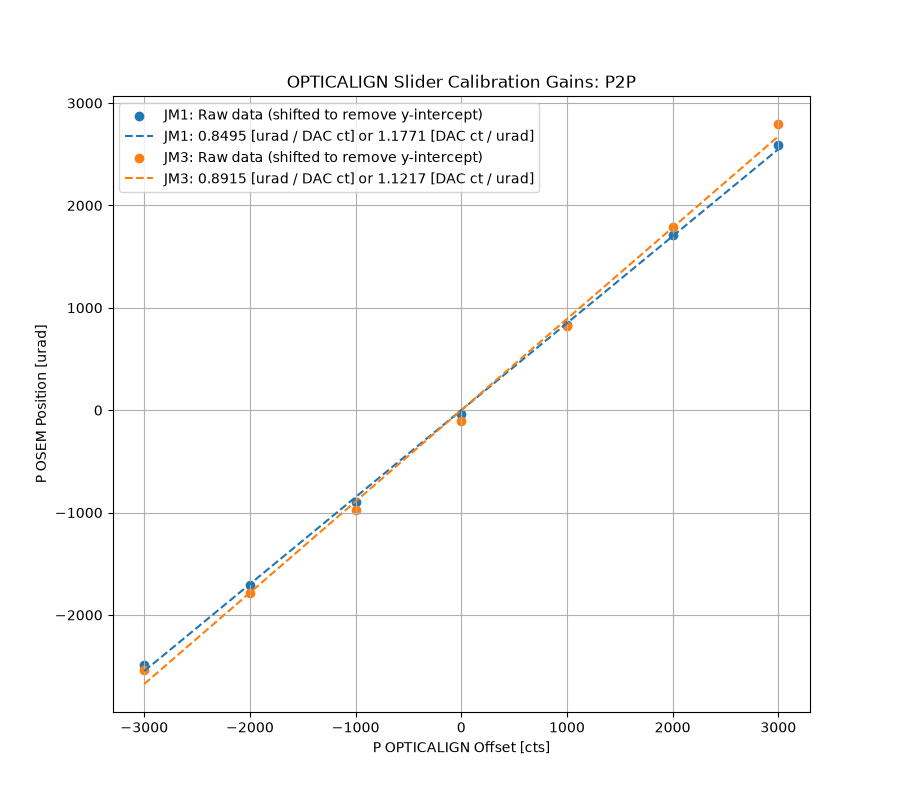
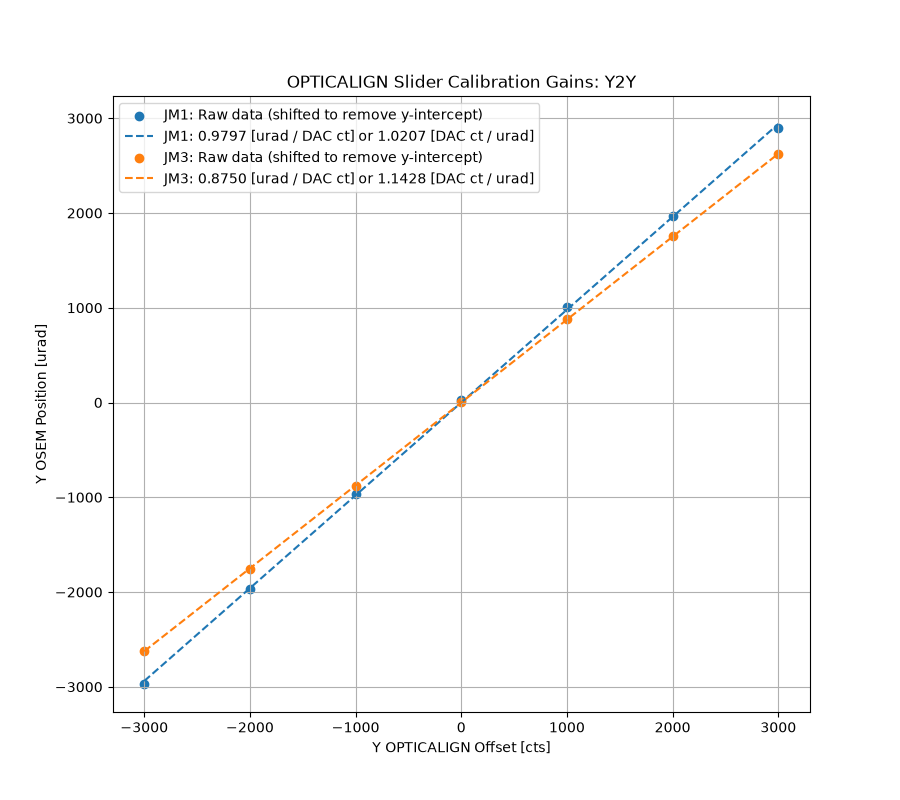
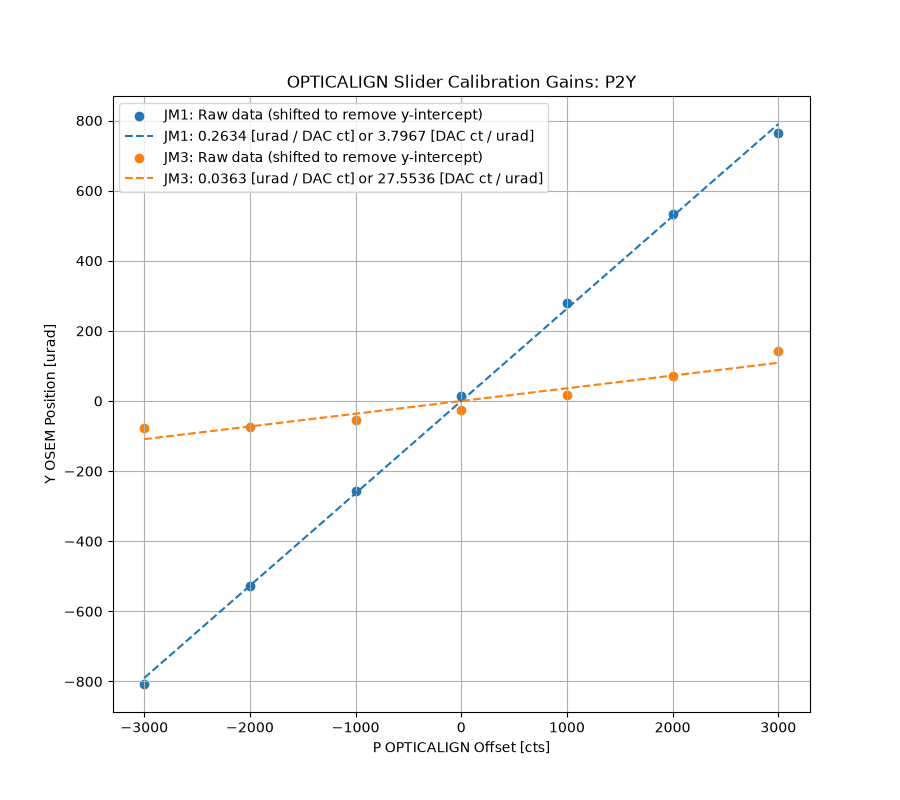
I used the method Jeff used in 77211 to get the counts -> urad calibration. So now when you move the OPTICALIGN slider by 1 in {Pitch,Yaw}, you actually get 1 urad in movement in {Pitch,Yaw}.
For each suspension, I put a series of OPTICALIGN offsets into Pitch and then into Yaw (only doing one dof at a time). At each offset, I wrote down the resulting values for DAMP_P_IN1 and DAMP_Y_IN1. Using these values I was able to fit a line for P2P, Y2Y, P2Y, and Y2P. I then inverted the slopes to get the calibration values in counts/urad.
On each plot I show the data points with the offsets removed (removed the 'b' from y=mx+b) for ease of slope comparison, and then also plotted the best fit line.
Both suspensions seem to have similar P2P and Y2Y as each other, but the cross-coupling is different. JM1 is a lot more cross-coupled with both P2Y and Y2P than JM3.
Finding New OFFSETs
OFFSET x GAIN = OUTPUT, and we want the OUTPUT to be the same as before, so we can just plug in our new GAINs and the OUTPUT that we want (aka the previous OUTPUT) and solve for OFFSET = OUTPUT / GAIN.
JAC length dither line at 809Hz is on. I also editted the Guardian so that he won't disable it.
It will keep engaged for a couple of days.
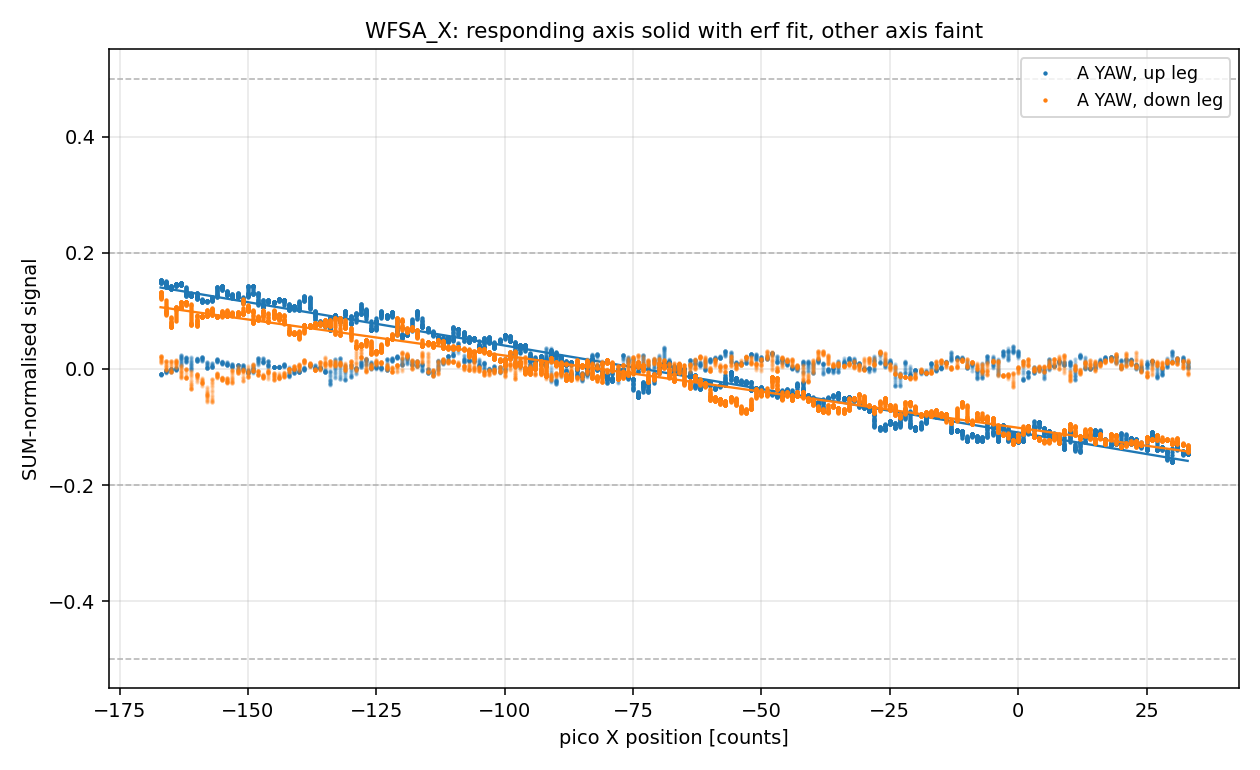
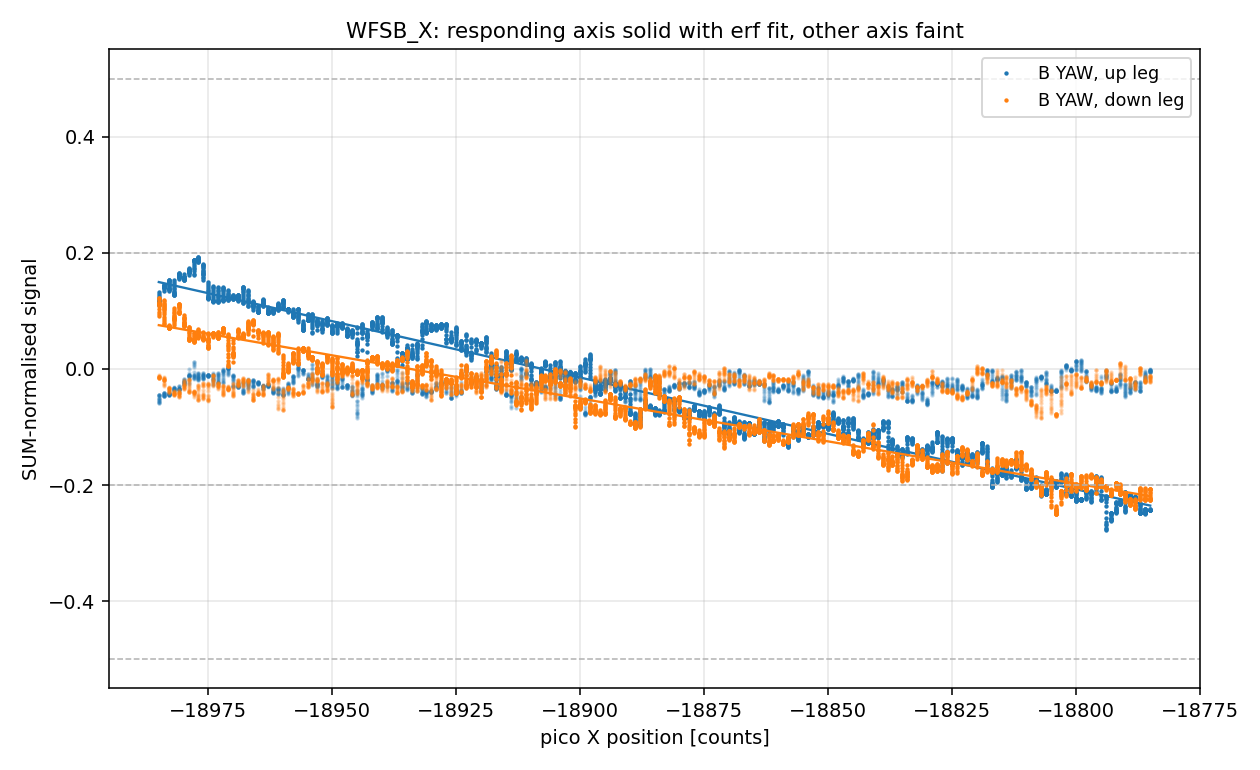
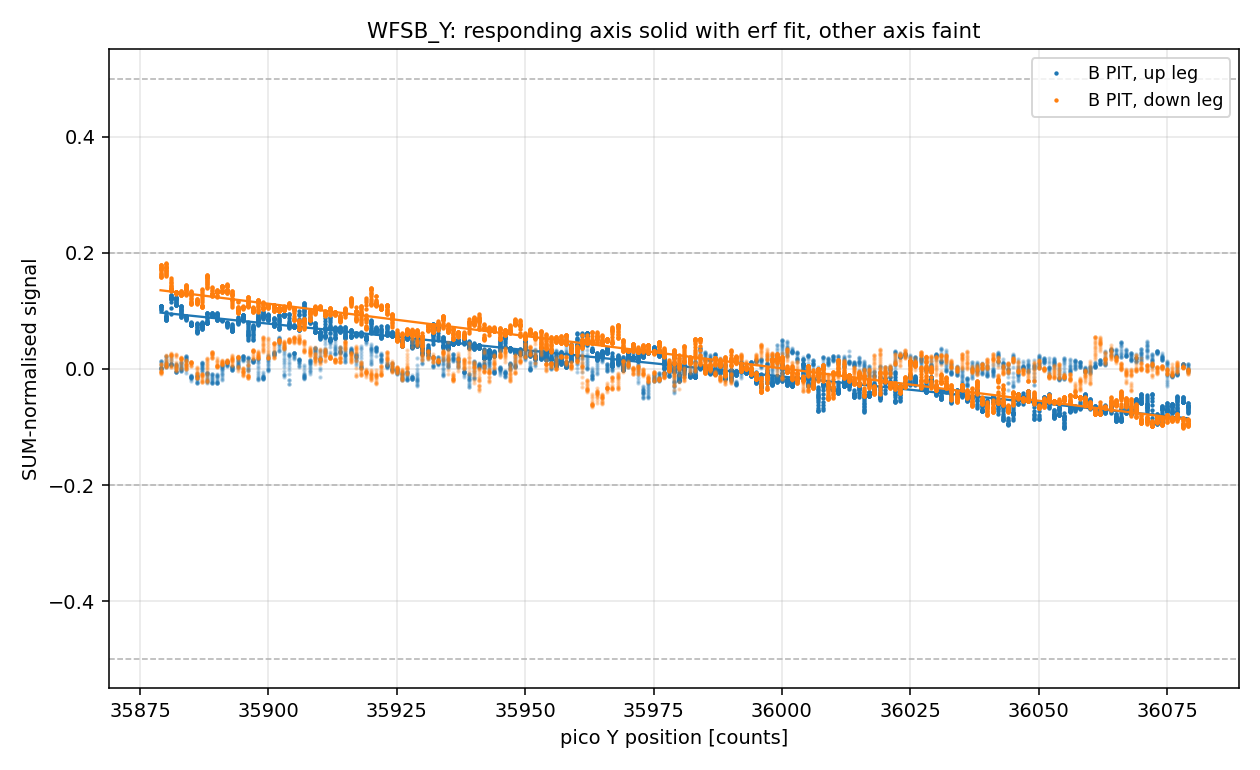
All four JAC pico axes (heads A and B, X and Y motors) have been calibrated in counts to beam displacement on the WFS, by non-locked sweeps read through the WFS DC signals. Efficiencies come out at 0.6–1.2e-3 beam radii per count (0.09–0.19 μm, 0.8–1.6 μrad of beam pointing), with a direction dependence of 9–27 %.
The fit gives the efficiency in beam radii (d/w) per count. Beam radii at the QPDs from the JAC reflected-path optical model:
| plane | wx [μm] | wy [μm] |
|---|---|---|
| WFS A | 199.4 | 181.0 |
| WFS B | 150.0 | 155.9 |
Denominator: SYS-MOTION_C_PICO_D_CURRENT_X/Y_POSITION [counts] of the swept motor. "up" / "down" refer to the sign of the count sweep.
| pico / motor | QPD axis | direction | d/w per count | μm per count | μrad per count (beam) |
|---|---|---|---|---|---|
| A / X | A YAW (x) | up | -9.41e-4 | 0.188 | 1.64 |
| A / X | A YAW (x) | down | -7.82e-4 | 0.156 | 1.36 |
| A / Y | A PIT (y) | up | -7.33e-4 | 0.133 | 1.16 |
| A / Y | A PIT (y) | down | -8.05e-4 | 0.146 | 1.27 |
| B / X | B YAW (x) | up | -1.22e-3 | 0.183 | 1.60 |
| B / X | B YAW (x) | down | -9.32e-4 | 0.140 | 1.22 |
| B / Y | B PIT (y) | up | -5.72e-4 | 0.089 | 0.78 |
| B / Y | B PIT (y) | down | -7.00e-4 | 0.109 | 0.95 |
Attachments: per-axis sweep figures (normalized signal against pico counts).

We have calibrated the two JAC steering actuators the PZT (IO_MB_M4) and the JM1, in μrad per drive count at DC. The scale comes from the second harmonic of the cavity transmission under a dithered drive, which is insensitive to DC misalignment and so needs no external angle reference.
By expanding the injected field in the cavity's own eigenmode basis, we can describe the misaligned as,
Ein(t) = E0 + δ(t) E1
with E0 the cavity's TEM00 mode and E1 the TEM10 (pitch) or TEM01 (yaw) mode, orthonormal. As long as the misalignment is small enough comparing to the beam size, the single complex coefficient δ carries the whole misalignment on that axis: its real part is a transverse displacement in units of the waist size, its imaginary part an angle in units of the divergence angle. Only the TEM00 is resonant, so the transmitted power follows the fraction of the input that sits in E0, i.e. 1 − |δ|2 for |δ|2 « 1.
Dithering a steering actuator makes δ oscillate about whatever value it already had:
δ(t) = δofs + δa cos(2πft)
where δofs is the static misalignment already present, and δa is the dither we deliberately applied, which is exactly the quantity we want in order to calibrate the actuator. TRANS signal (1 − |δ|2) can devided into three components with its frequecies:
frequency |
value | contains the unknown δofs? |
|---|---|---|
| DC | |δofs|2 + |δa|2/2 |
yes |
f |
2 Re(δofs*δa) |
yes — magnitude and relative phase |
2f |
|δa|2/2 |
no |
The static offset drops out of the second harmonic algebraically. 2f therefore delivers |δa| with no reference to the alignment state we happened to be sitting at, and with no external angle standard. The DC and f terms, the two one would reach for first, are both contaminated by it.
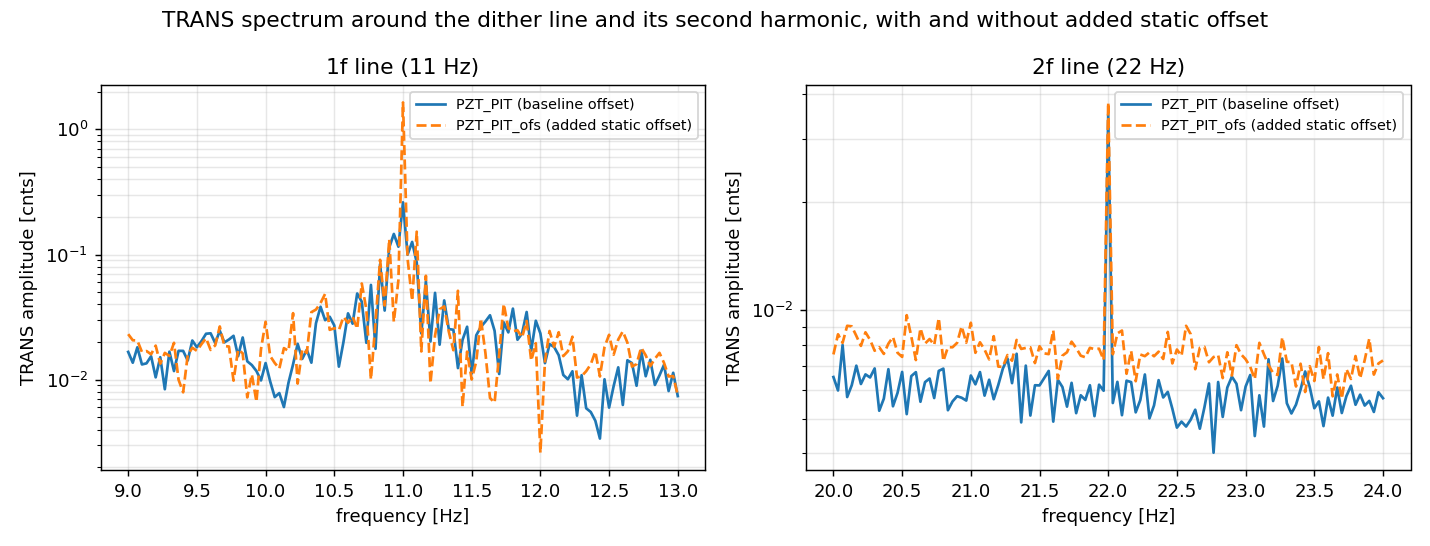
This is the whole point of the method, and it is directly visible in the plot. adding a static offset grows the 1f line by +528 % while the 2f line moves by +8 %, its own measurement noise.
I proceeded 4+1 measurement in total with the JAC locked. For each measurement, one actuator axis was dithered at 11 Hz, with the excitation injected on the channels below and the drive read back on the corresponding _OUT. I excited JM1/PZT PIT/YAW per one measurement, and the other one is the PZT_PIT excitation with static offset (30 cnts) to demonstrate that the 2f peak is not affected by the offset. Transmission was read on H1:JAC-TRANS_A_LF_OUT.
| record | excitation channel | drive read back on | amplitude at 11 Hz [cnt] | drive offset [cnt] | TRANS DC [cnt] |
|---|---|---|---|---|---|
PZT_PIT |
H1:JAC-PZT_PIT_EXC |
H1:JAC-PZT_PIT_OUT |
20.0 | 0 | 6451.2 |
PZT_PIT_ofs |
H1:JAC-PZT_PIT_EXC |
H1:JAC-PZT_PIT_OUT |
20.0 | 30 | 6442.5 |
PZT_YAW |
H1:JAC-PZT_YAW_EXC |
H1:JAC-PZT_YAW_OUT |
20.0 | 0 | 6442.6 |
JM1_PIT |
H1:SUS-JM1_M1_TEST_P_EXC |
H1:SUS-JM1_M1_TEST_P_OUT |
40.0 | 0 | 6445.5 |
JM1_YAW |
H1:SUS-JM1_M1_TEST_Y_EXC |
H1:SUS-JM1_M1_TEST_Y_OUT |
40.0 | 0 | 6440.2 |
|δa| is calculated from peak heights of the transmission at 22 Hz, converted to a mirror tilt using the local beam radius at each actuator from the current JAC reflected-path layout model (alog91472 comment), and calibrated into DC responce using each actuator's frequency response as measured (described below).
| actuator | axis | excitation channel | |δa|2 |
efficiency [μrad/cnt] | |
|---|---|---|---|---|---|
| at 11 Hz (as measured) | at DC | ||||
| PZT | PIT | JAC-PZT_PIT_EXC |
1.09e-5 | 0.0093 | 0.083 |
| PZT | YAW | JAC-PZT_YAW_EXC |
6.47e-6 | 0.0093 | 0.079 |
| JM1 | PIT | SUS-JM1_M1_TEST_P_EXC |
1.01e-5 | 0.0216 | 0.89 |
| JM1 | YAW | SUS-JM1_M1_TEST_Y_EXC |
1.67e-5 | 0.0254 | 0.92 |
The 11 Hz column is what the dither actually produced; the DC column is that value divided by the actuator's own response at 11 Hz, and is the number to use for a DC gain.
The frequency response itself comes from a separate set of four broadband actuator-to-wavefront-sensor records (300 s each, one actuator per record, see atatched plots), from which the JM1 suspension resonance and the PZT drive pole are fitted. Only the shape of those transfer functions is used; their absolute scale plays no role in the calibration.
The fitted frequency responses are:
f0 = 2.00 Hz, Q = 7.7 (PIT) and 1.80 Hz, Q = 5.4 (YAW)fp = 1.24 Hz (PIT) and 1.30 Hz (YAW)AOI compensation
Both actuators sit at a design AOI of 45°, and the rows above include the geometric correction that follows. A tilt whose rotation axis lies in the mirror surface and in the plane of incidence steers the beam by only 2θ cos(AOI), against the full 2θ for the axis perpendicular to that plane. At the PZT the suppressed axis is YAW in the cavity-referred channel naming (the HAM1 periscope exchanges the transverse planes downstream of it); JM1 sits after that periscope, so for it the suppressed axis is PIT. The assignments follow from each mirror's orientation, and the correction uses the design 45° rather than a value fitted to the measured ratio.
APZT = 500 μrad/V (T1500342) driven through an 18-bit DAC (±10 V differential, i.e. 20 V over 217 counts) and a differential-to-single-ended board (D1100457 v2, unity gain, read off its schematic), giving 0.076 μrad/cnt. No further driver gain applies on top, since the T1500342 figure is referenced at the controller's control input. Our result sits at 1.09× (PIT) and 1.04× (YAW) of this designed value.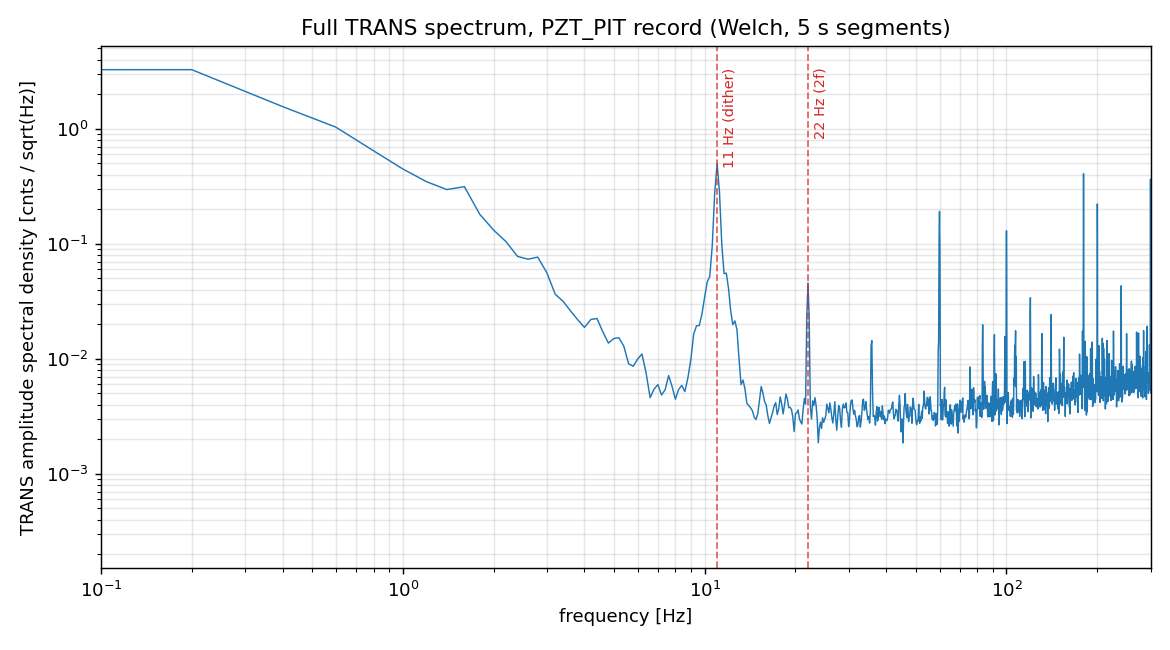

Short note: a mirror rotated by θ, sitting where the beam radius is w(z), produces |δ| = k w(z) θ, and its phase relative to TEM00 is 90° plus the Gouy phase accumulated from the reference waist. This can be applied for the mirror which is transmitting the lens. This is because δ is the field amplitude of the first-order mode it is continuous across lenses, so a mirror separated from the reference space by lenses is handled by simply adding up the free-propagation Gouy phase to the reference waist. The table below therefore carries the beam radius and the accumulated Gouy phase at each actuator.
| actuator | axis | excitation channel | |δa|2 | efficiency [μrad/cnt] | beam radius w [mm] |
Gouy phase from the JAC waist [deg] |
|
|---|---|---|---|---|---|---|---|
| at 11 Hz (as measured) | at DC | ||||||
| PZT | PIT | JAC-PZT_PIT_EXC | 1.09e-5 | 0.0093 | 0.083 | 3.020 | -86.4 |
| PZT | YAW | JAC-PZT_YAW_EXC | 6.47e-6 | 0.0093 | 0.079 | 3.270 | -73.5 |
| JM1 | PIT | SUS-JM1_M1_TEST_P_EXC | 1.01e-5 | 0.0216 | 0.89 | 0.620 | -32.7 |
| JM1 | YAW | SUS-JM1_M1_TEST_Y_EXC | 1.67e-5 | 0.0254 | 0.92 | 0.681 | -30.8 |
The beam radius (1/e2 intensity) and the Gouy phase are model values at the actuator, taken from the JAC REFL optical model.
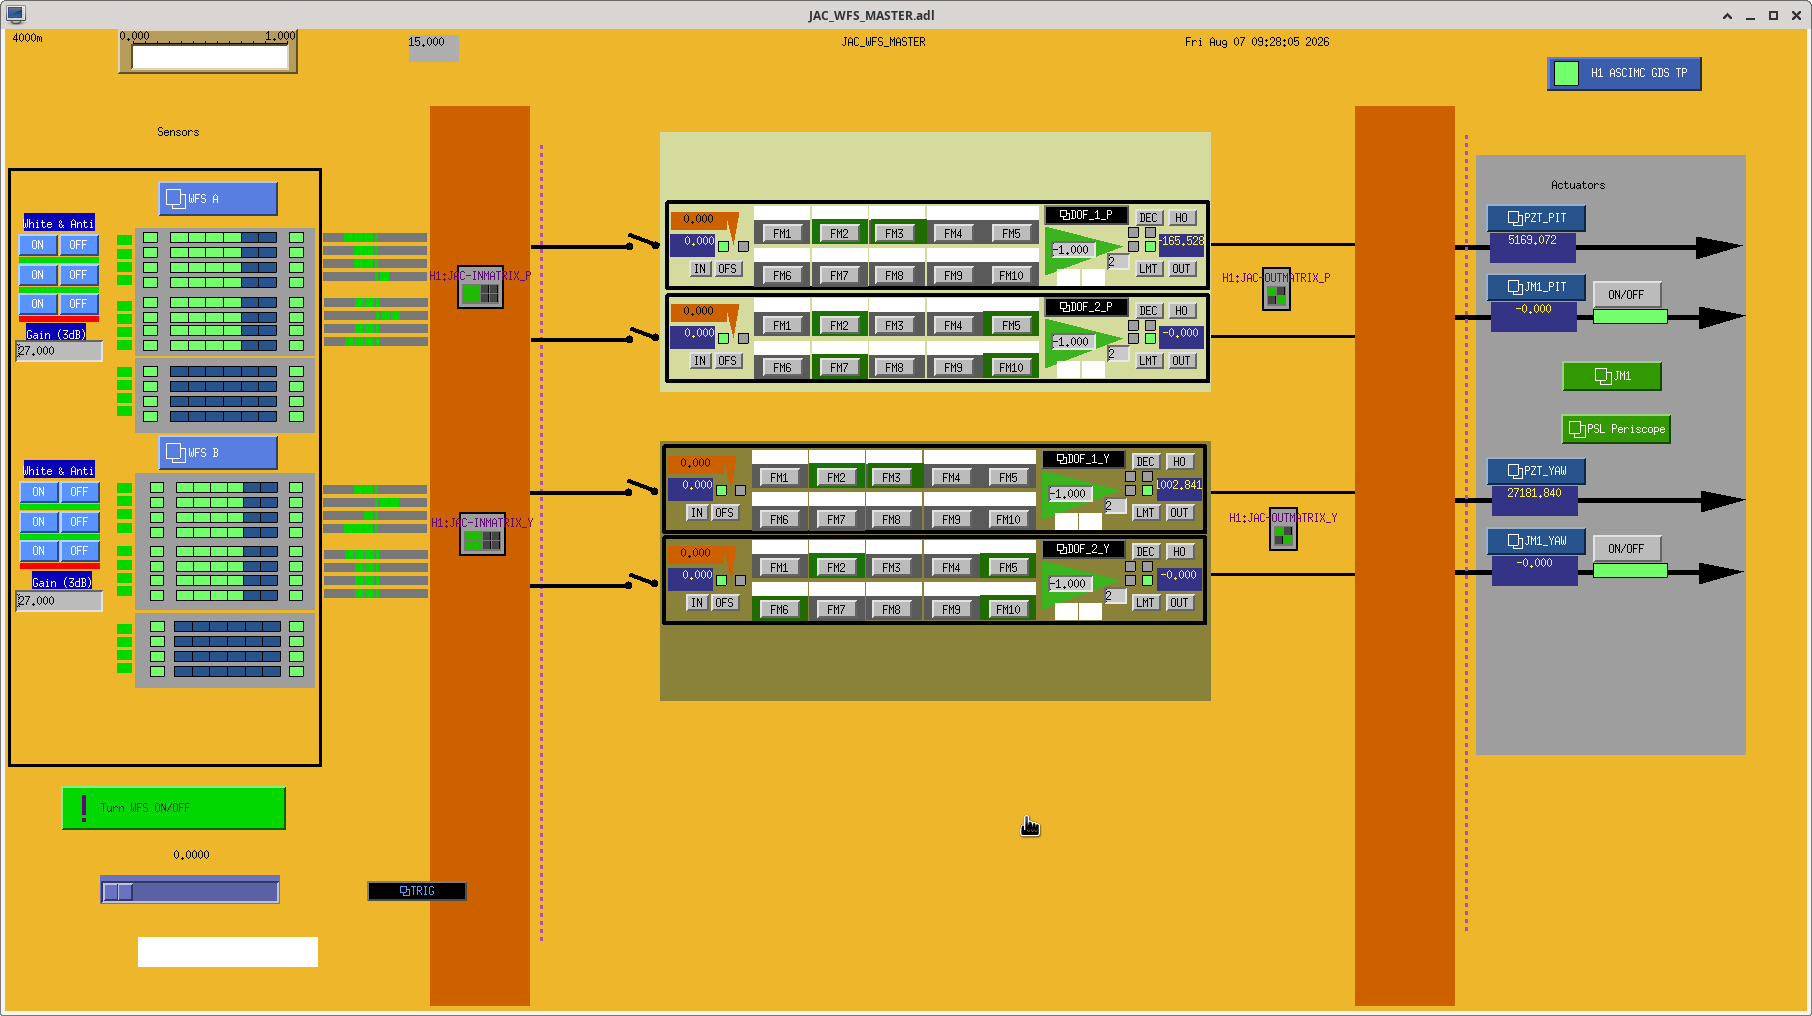
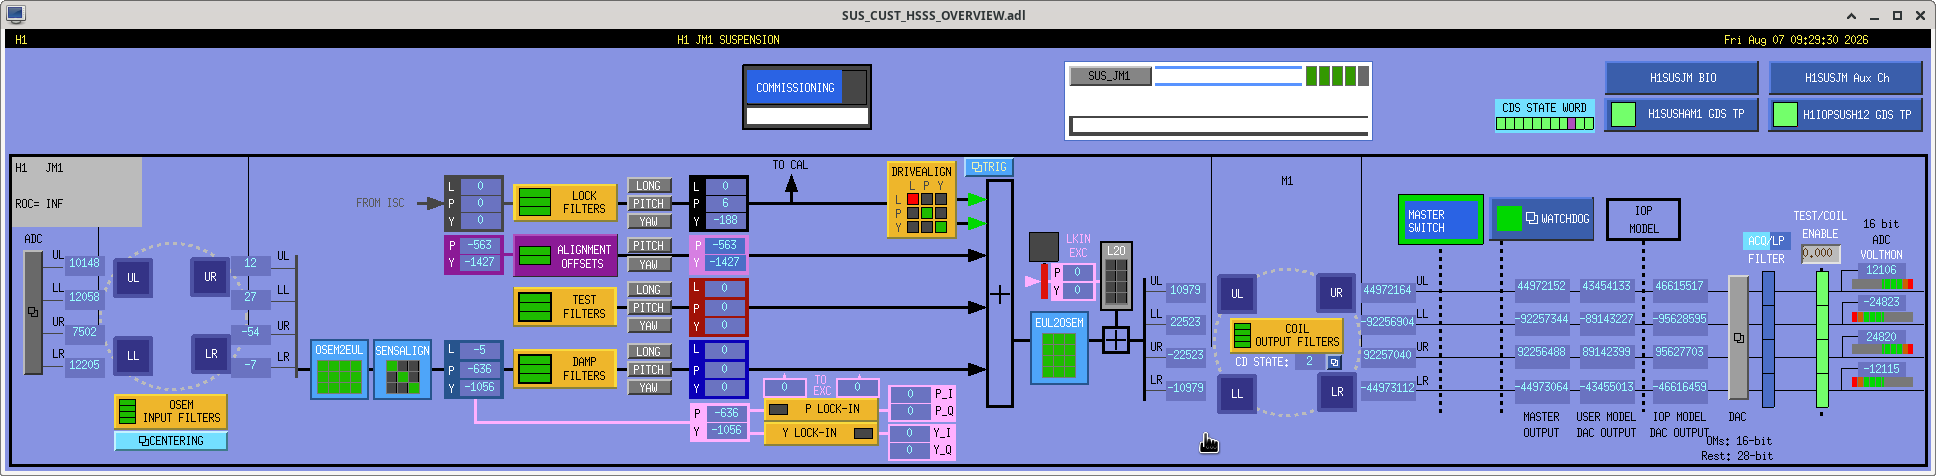
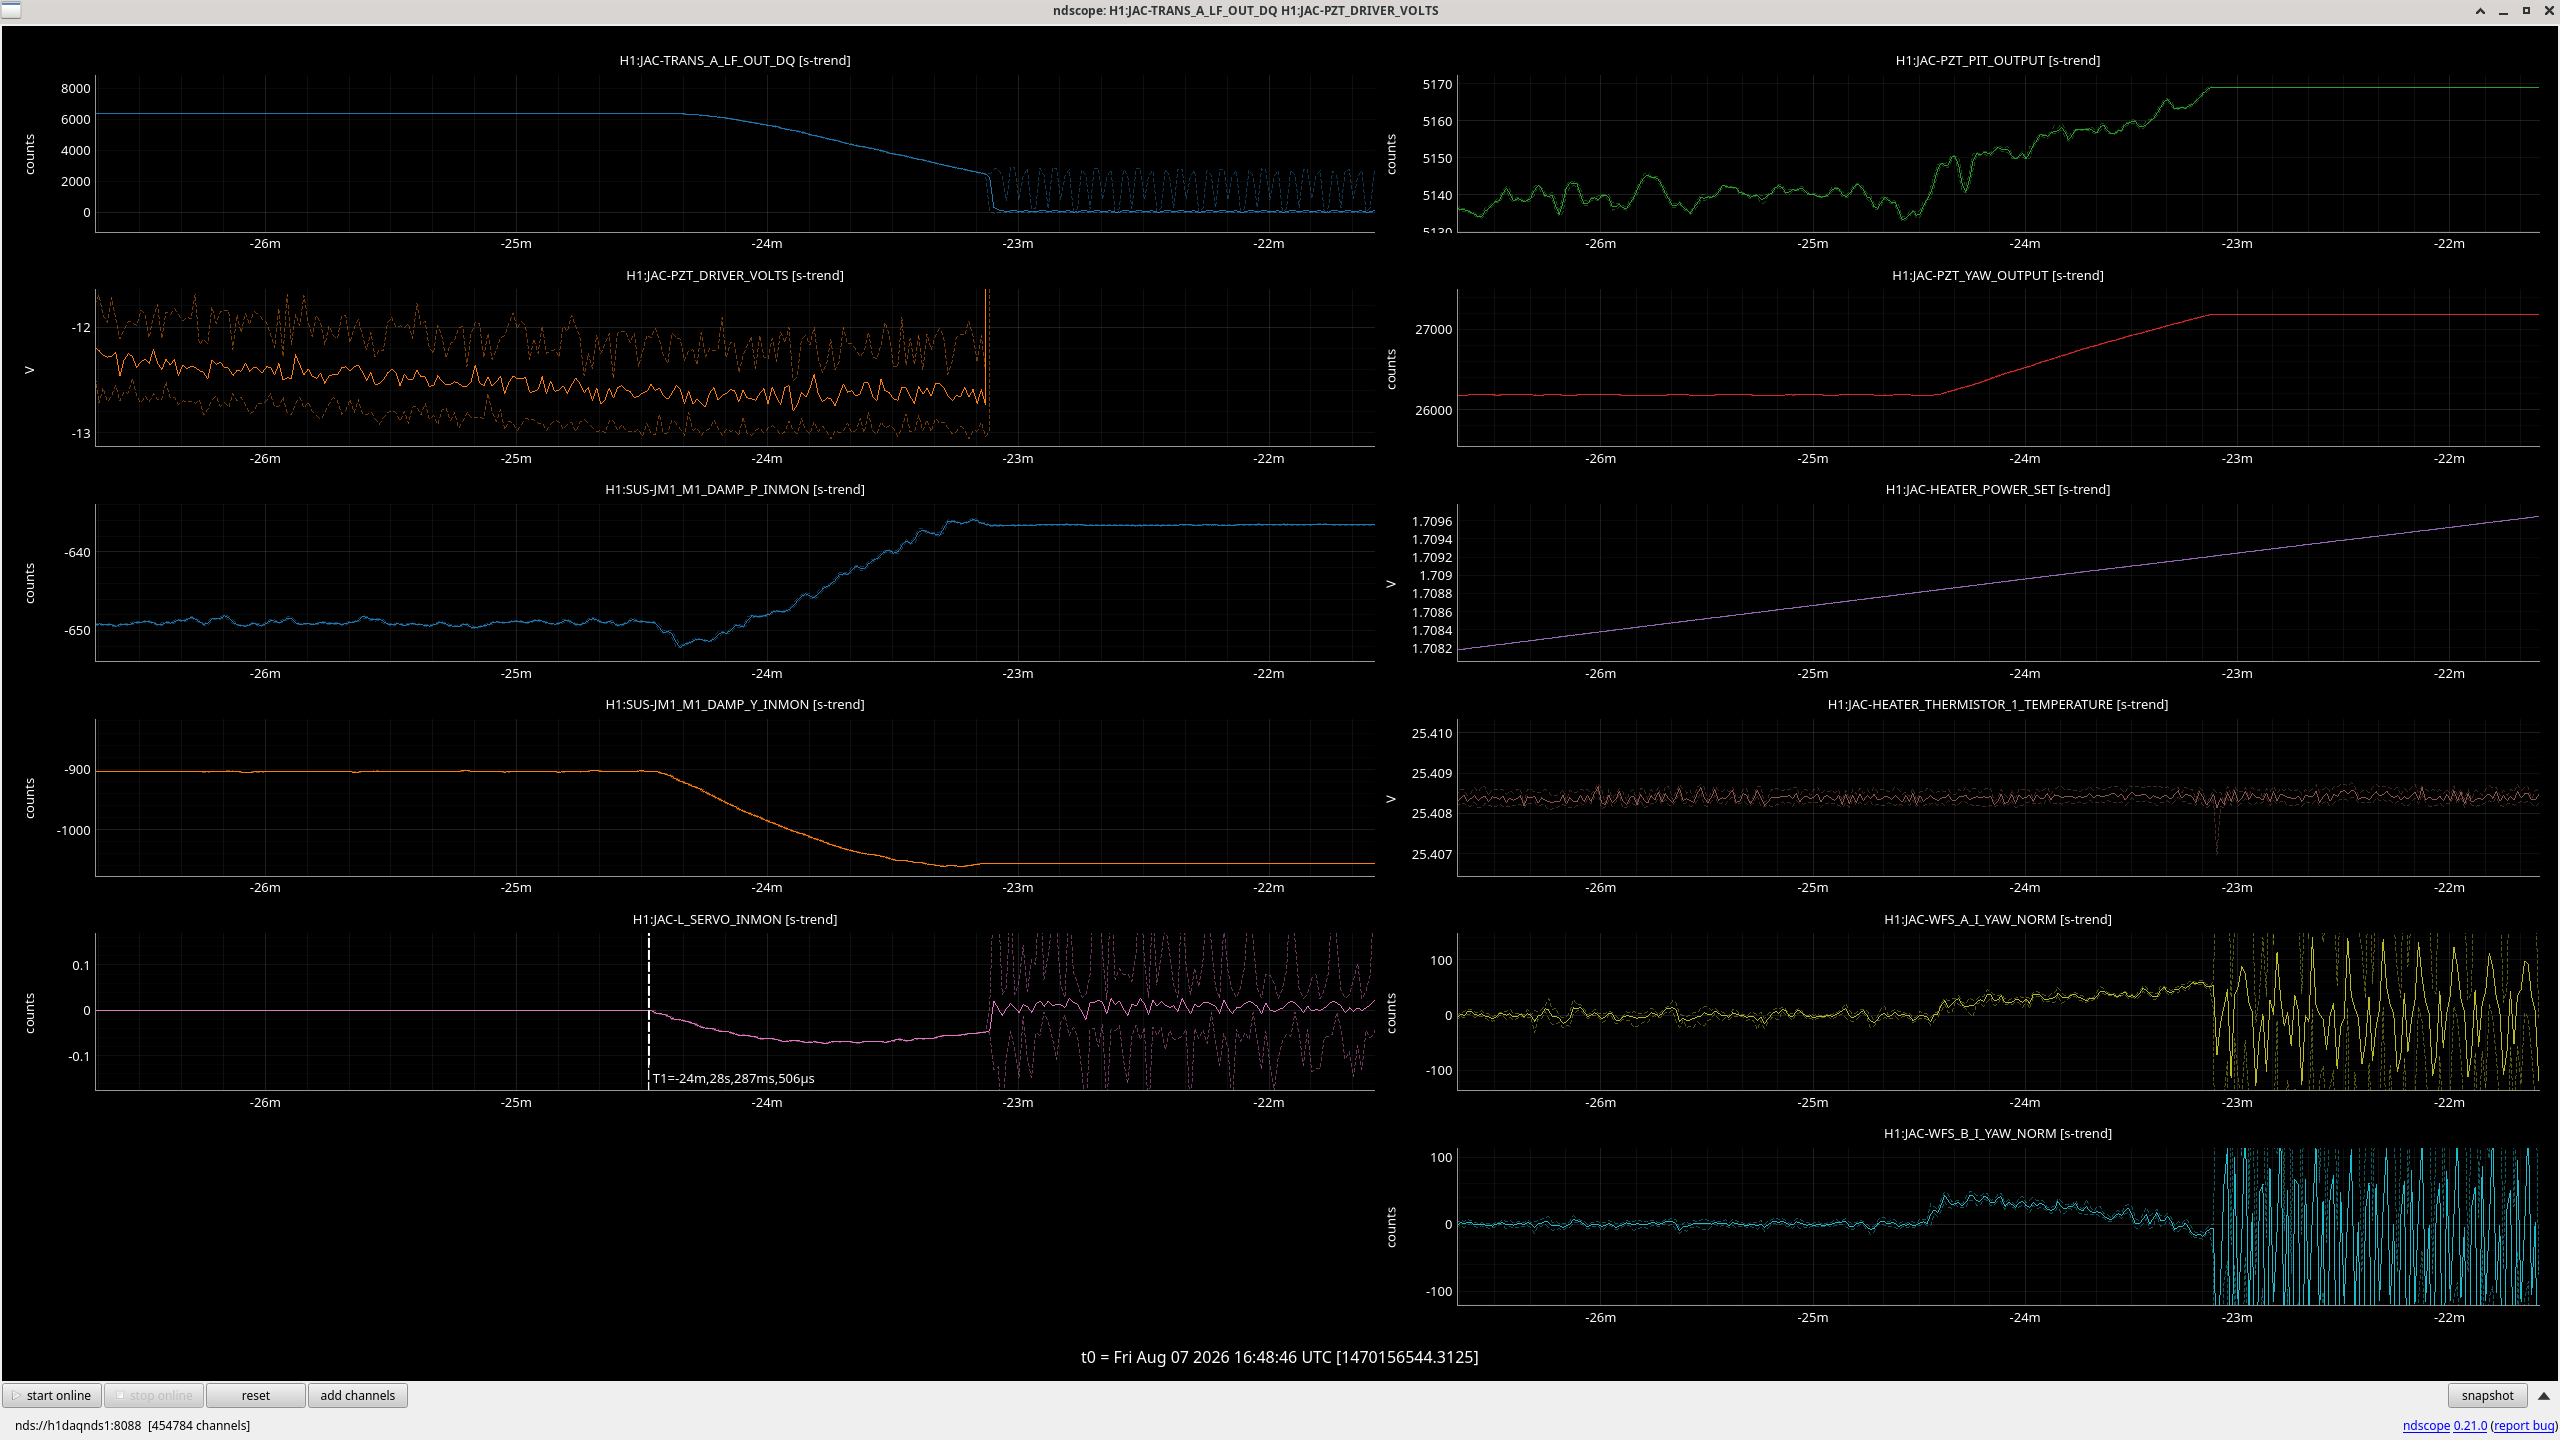
This morning JAC lost lock due to temperature drift (temperature control was on) and at the same time WFS went crazy. After that JACK_LOCK guardian couldn't lock it, just kept scanning without success because the alignment was very much off.
When this happens, what you should do is:
For the lockloss and WFS behavior see jac_lockloss.png.
JAC lock voltage was drifting lower and lower, which meant that you must have cooled JAC down, but the temperature servo was heating it more. Ultimately we need a temperature servo to keep the lock PZT voltage constant rather than keeping the temperature sensed by the thermistor.
After the lock voltage alredy hit the bottom rail, it took about a minute for JAC to completely lose it. During this time, JAC_L error increased as the JAC slowly became off-resonant, and of course the same signal is seen by all WFS segments. Since WFS centering is not perfect, this increased WFS P and Y signal. JAC ASC tried to counter this by twisting JM1 and the PZT mirror without success.
Finally the WFS was turned off but mirrors were already heavily misaligned at that point.
I changed the heater power from 0.8 to 2W, and the temperature increased up to ~25.4 degrees. The heater guardian setpoint was also changed to 25.41, and engaged at 9:07AM.
We performed a high-power test of JAC. The input power was ramped from 2 W to 62 W using the Guardian power up/down states, and JAC stayed locked through the entire ramp without any problem.
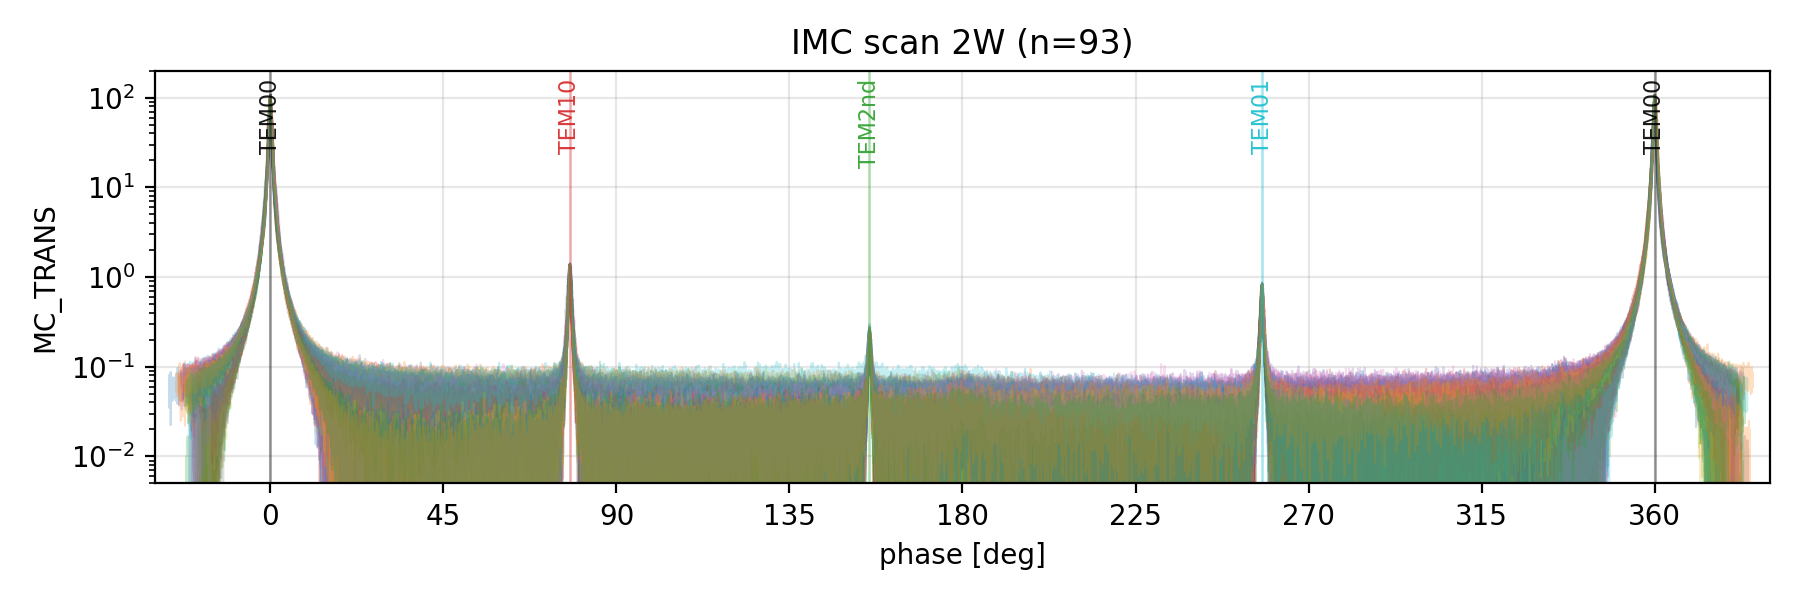
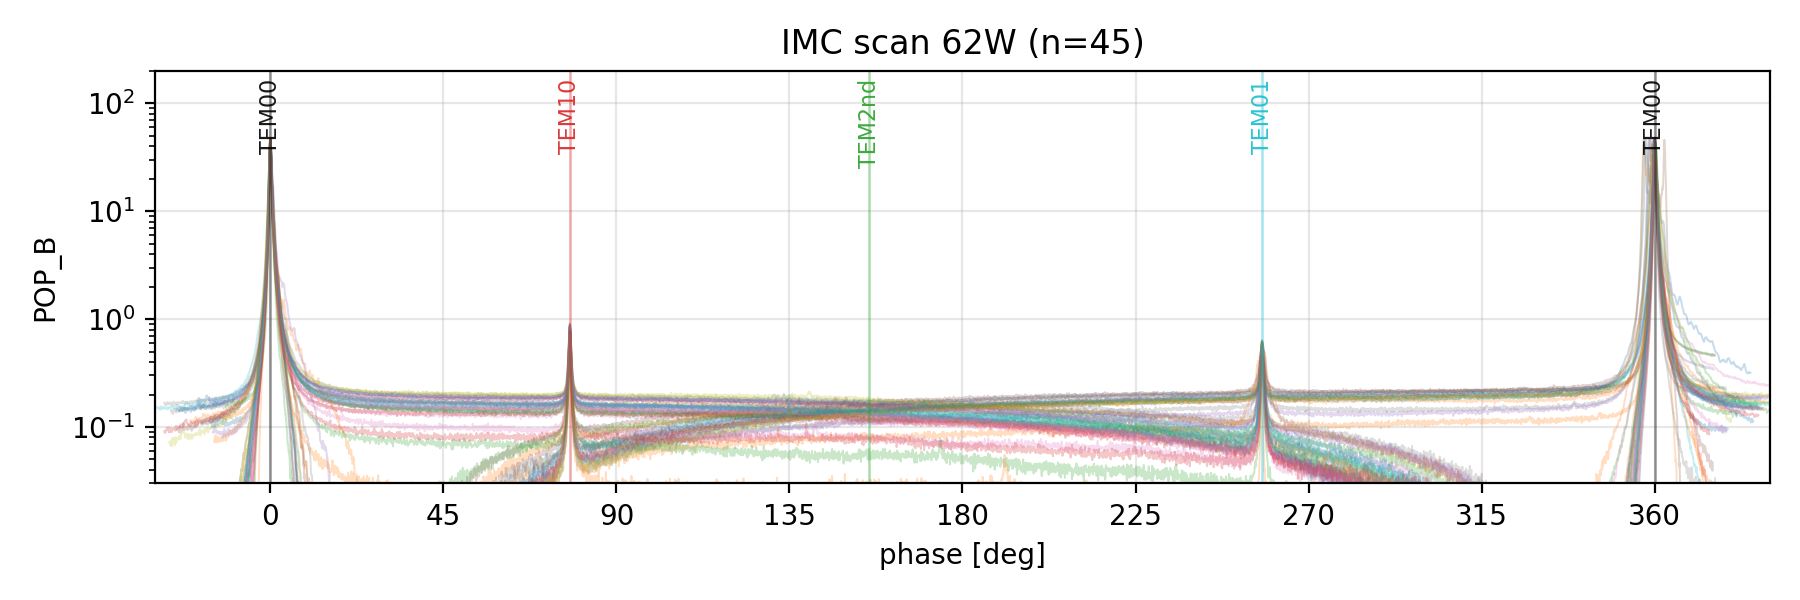
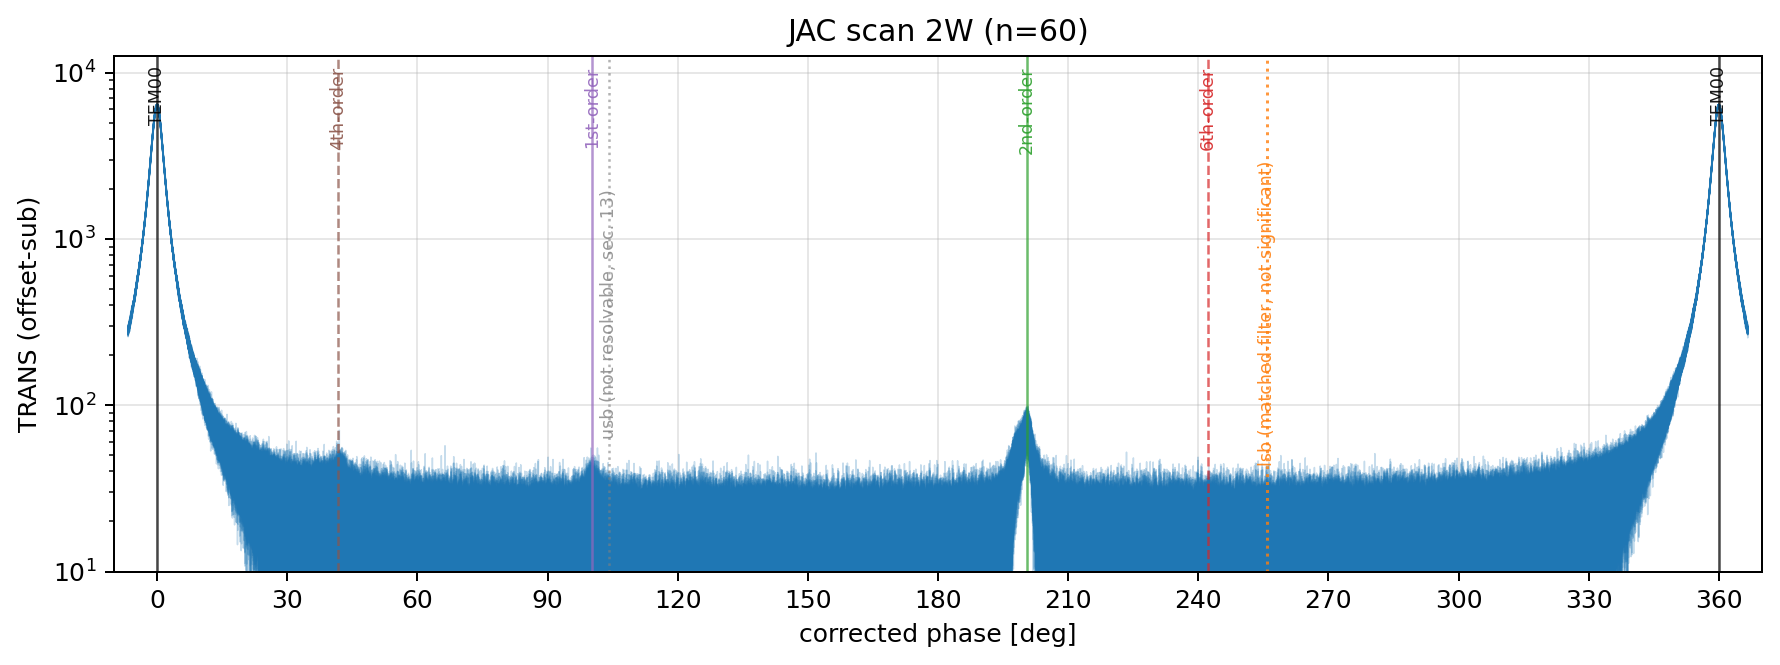
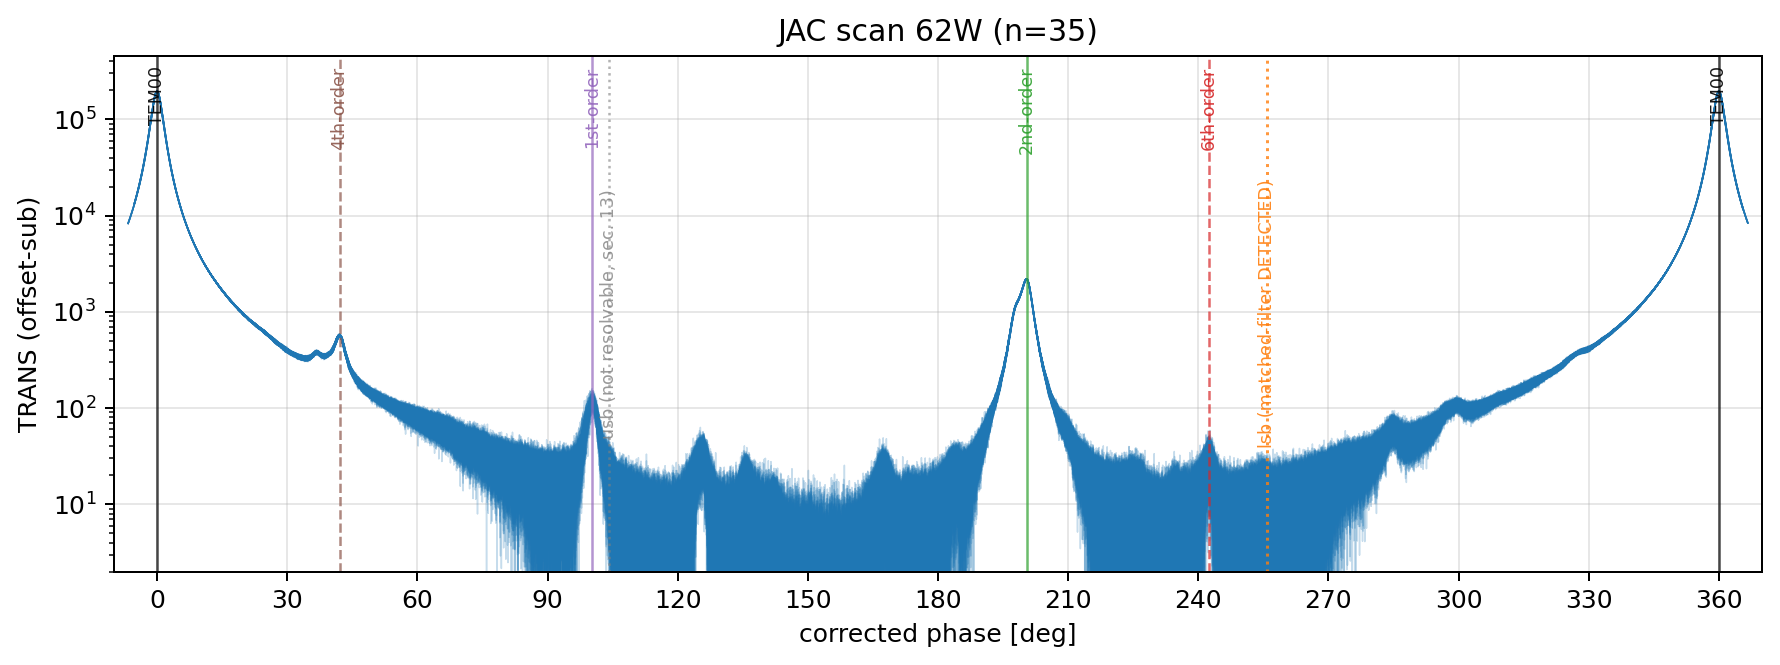
To quantify thermal effects on the mode matching, cavity scans of both the IMC and JAC were taken at 2 W and at 62 W. The main conclusion is that the thermally induced mode-matching change is negligible for both the IMC and JAC.
JAC stayed locked through the entire ramp from 2W to 62W. The OLG was measured at 2W and 62W, the difference was about 3dB, and this increase is caused by the discrepancy of the power normalization value and actual power to the JAC REFL PD.
During the following test JAC lost lock a few times (deliberately and otherwise); in every case the trigger PD responded correctly and the shutter closed as designed. The ASC loops were also closed during the power increase and worked without issue.
The analysis follows the method already posted in alog 88984. For the 62 W scan the readout was switched to POP_B : MC2_TRANS starts to saturate at high power, and a saturation-induced tail dragging is visible in its response, which would contaminate the analysis. (Actually, POP_B has also the contamination, but I concluded that we can ignore that effect, since we can't see any 2nd order peak in the scan as discussed below.)
The IMC mode matching is at a very good level to begin with, and the thermal lensing improve the mode matching: the second-order mode content are 0.22% for 2W and <0.3% (62 W). As the attached scan plots show, there is no observable second-order peak in 62W plot, so the upper limit of 0.3% was estimated by the noise floor. Note taht the first-order modes are caused by intentional misalignment.
To estimate the thermal change for JAC, we also scan the JAC PZT. Scan parameters: PZT driver swept 51–311 V (triangle, 10 s period), 300 s at 2 W and 60 s at 62 W, reading channels JAC-PZT_DRIVER_VOLTS / JAC-TRANS_A_LF.
The mode mismatch is 1.1% for 2W and 1.0% for 62W. Again, no significant thermal change. Since the mismatch is visible at the >1% level, moving the PSL mode-matching lens could probably improve it somewhat; whether we do this is left for later.
As a byproduct, the 43 MHz modulation index was extracted from the scan with a matched filter on the lower sideband (62 W, 12.7–13.5σ): m ≈ 0.009, consistent with the expected 0.01.
Masayuki Nakano, Khanh Vu
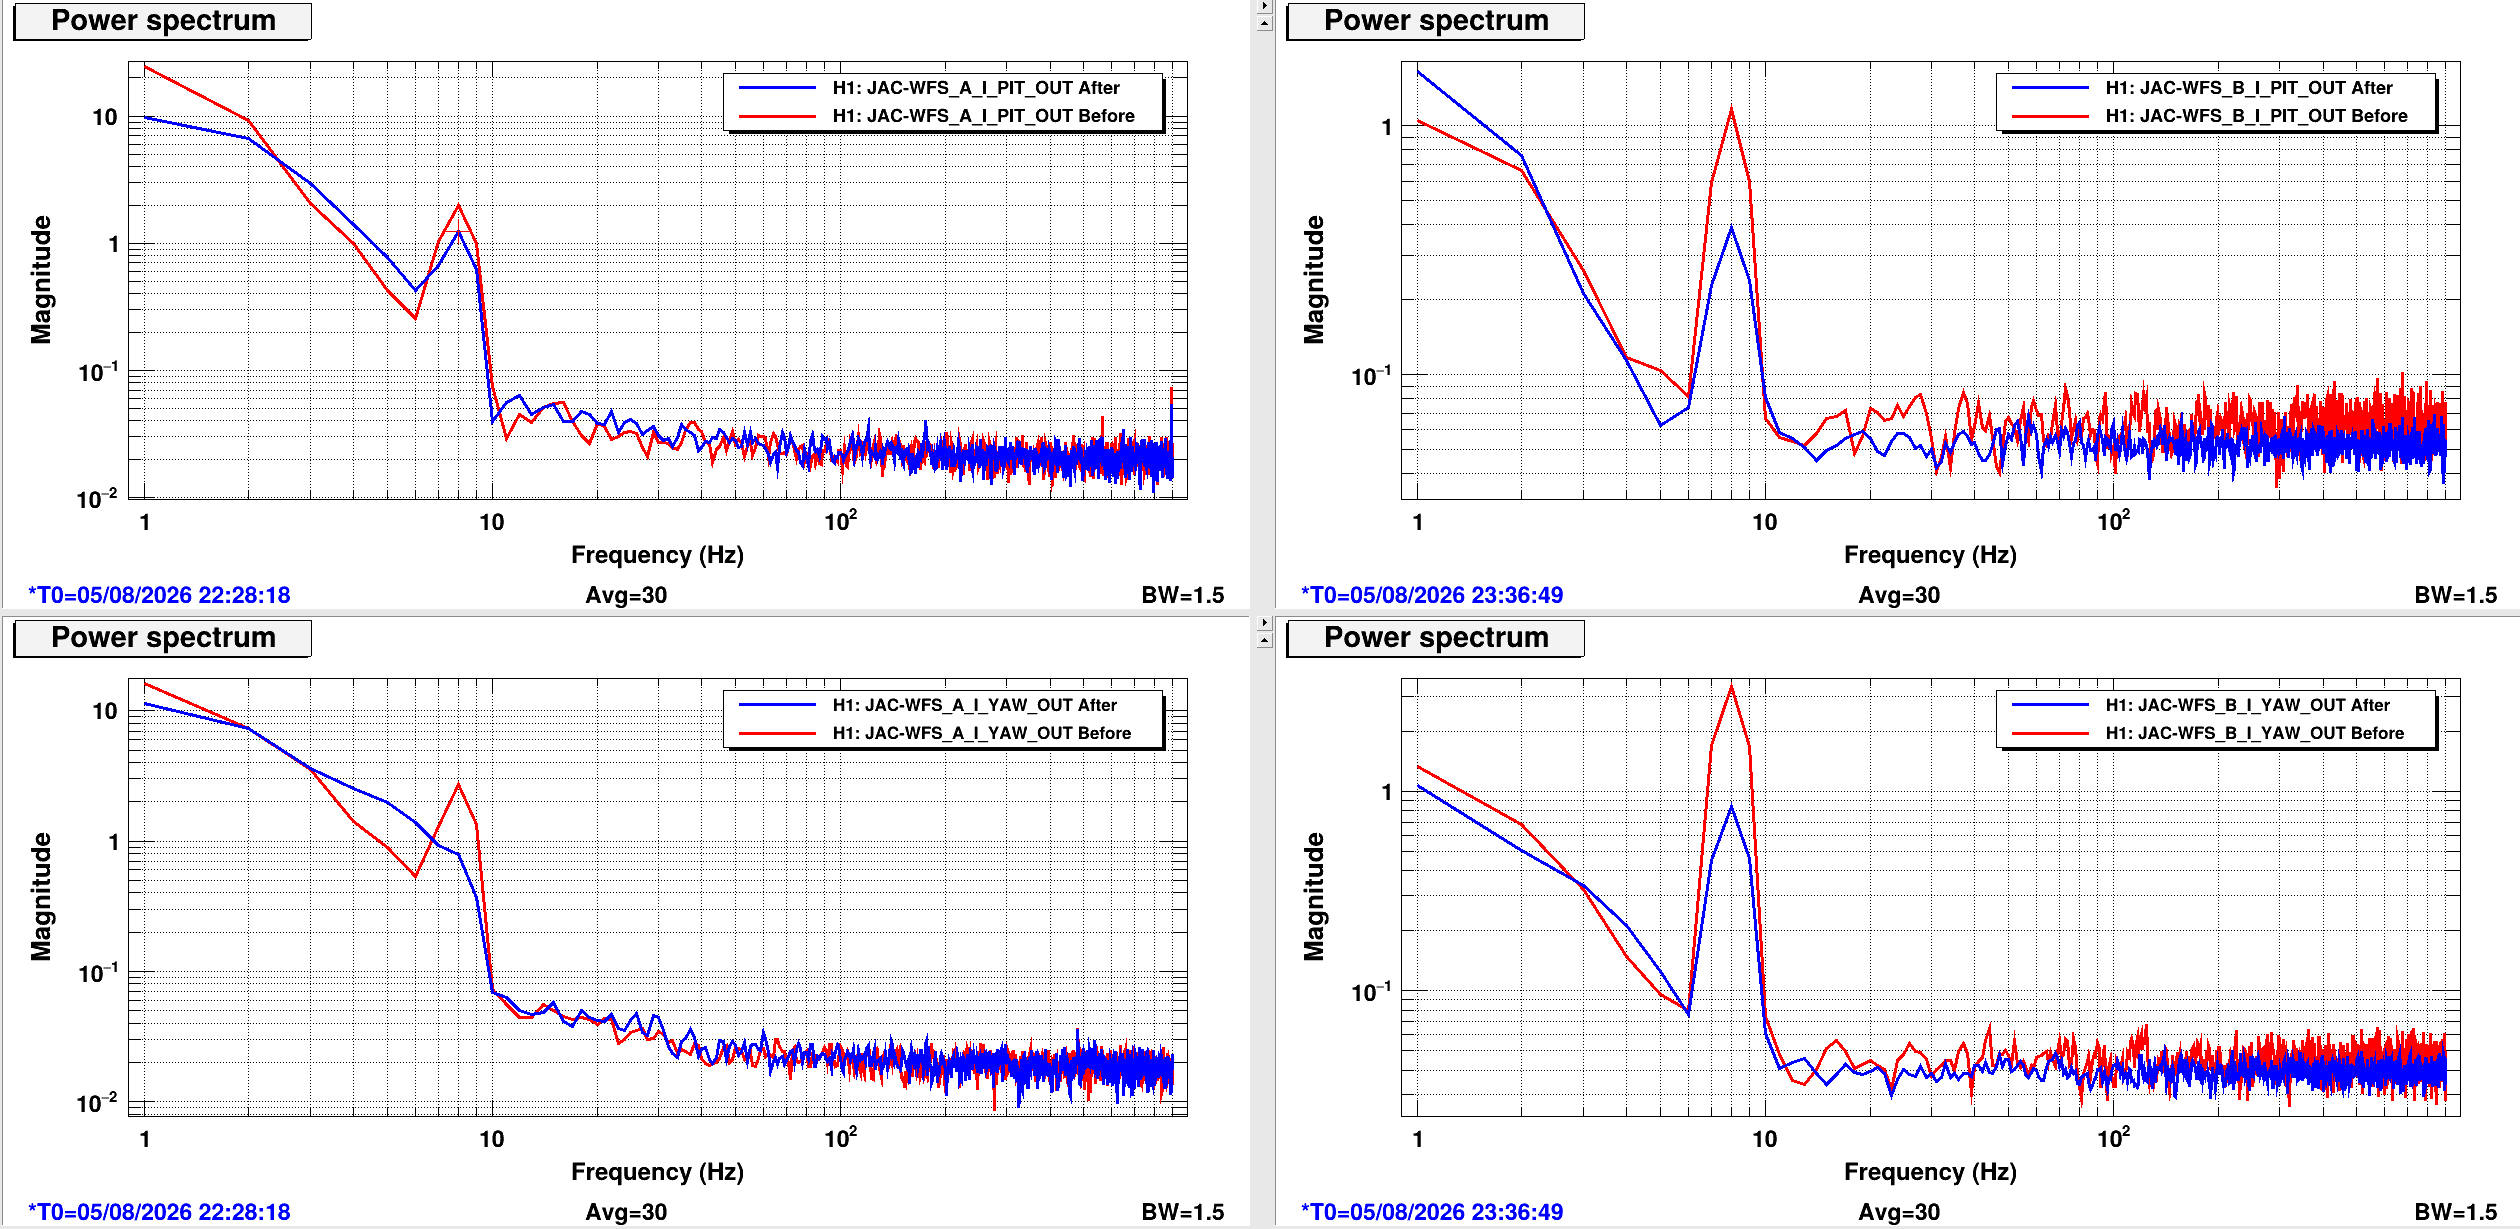
This afternoon we worked on balancing the wavefront sensors for JAC. As shown in the plots below, the coupling of the length signal into the pitch and yaw channels of both WFS A and WFS B is significantly reduced after the adjustment, indicating that the balancing was successful.
To measure the length coupling, we injected a 0.1 excitation into the JAC length loop error point at 8 Hz. The 8 Hz peak appeared in both the pitch and yaw channels of WFS A and WFS B, indicating an imbalance among the four quadrants of the wavefront sensors. To reduce this coupling, we modified the WFS input matrices, which convert the four sensor segment signals into pitch and yaw signals. Instead of using equal weights of 1 for every segment, we adjusted each weight based on the measured imbalance.
We first monitored the signals from all four segments of each wavefront sensor and calculated new matrix values. For each sensor, we summed the four segment signals and divided by four to obtain the average signal that each segment should ideally receive. We then calculated the fractional deviation of each segment from this average and used it to determine a correction factor. The new matrix entry for each segment is given by:
New weight = 1 − (Average − Segment)/Average
For example, the measured signals for channel I of WFS A were:
| A_I1 | A_I2 | A_I3 | A_I4 |
| 10.32 | 8.39 | 10.9 | 11.35 |
The sum of the four segments is 40.96, giving an average of 10.24. Segment A_I1 is 0.08 above the average, corresponding to a fractional deviation of approximately 0.008 (0.8%). Its new matrix weight therefore becomes approximately 0.992. Since this segment receives slightly more signal than the average, its weight is reduced accordingly. The same calculation was applied to all four segments of both WFS A and WFS B, and the updated matrices were loaded into the system.
The comparison of the pitch and yaw signals for channel I of WFS A and WFS B is shown below. The 8 Hz length coupling is reduced in all cases compared to the original matrices, demonstrating that the new balancing improves the wavefront sensor performance.
Jennie Wright, Masayuki Nakano, Khanh Vu

This morning we worked on several tasks on the IOT1 table, including installing the camera and shutter, profiling the beam, and calibrating the DC power.

We identified a new location for the camera using the beam transmitted through JACR_M5. During this process, Masayuki noticed that the beam was being clipped by the shutter. We suspect that the beam may have been clipped for some time. We then installed the camera in its new location, and Masayuki aligned the shutter on the table.

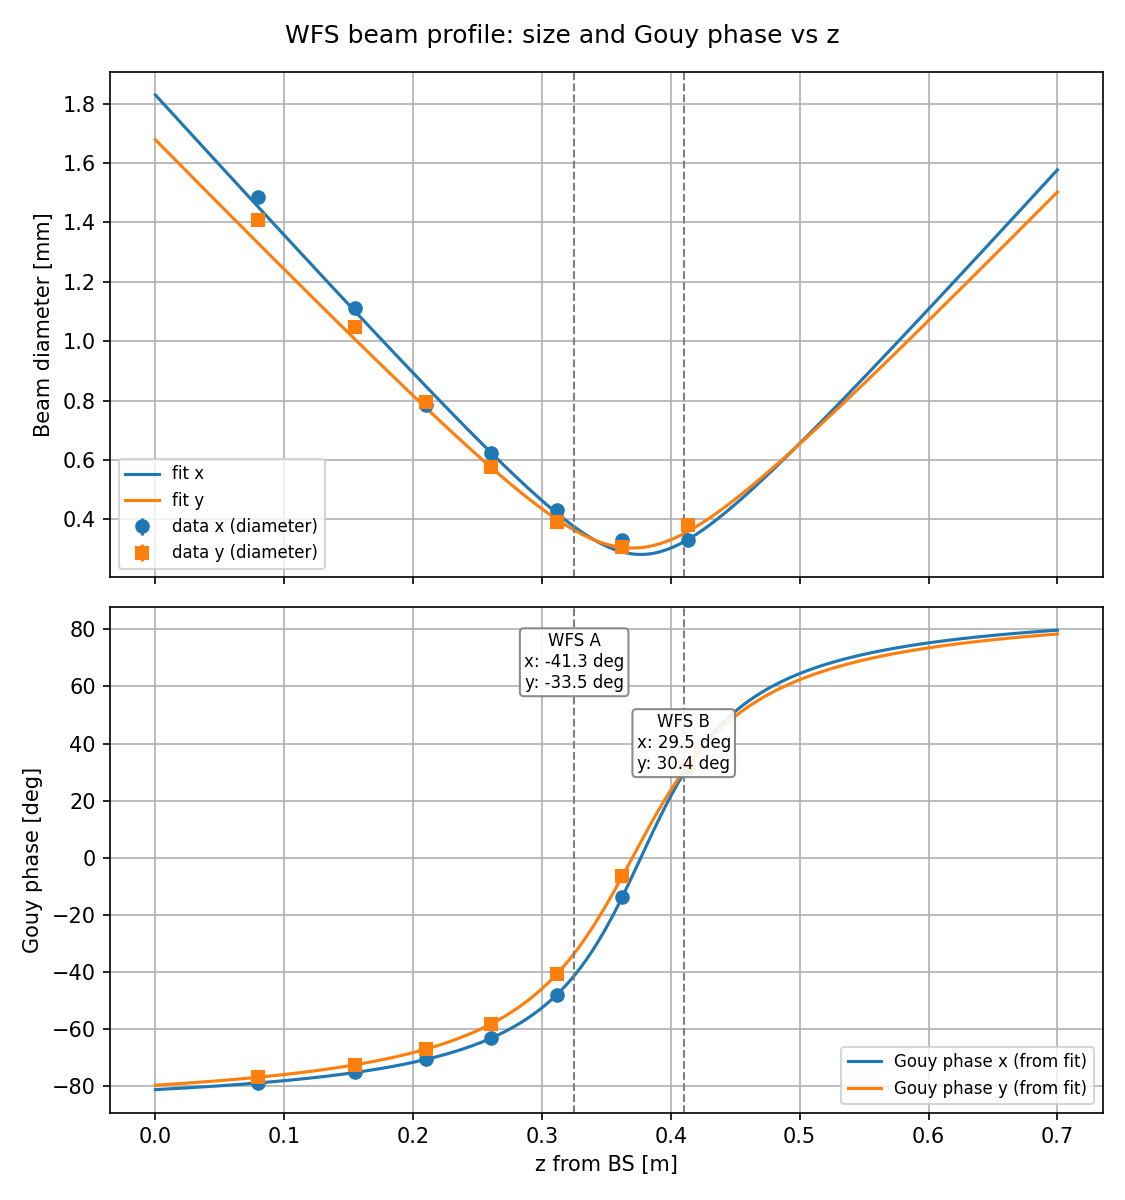
Next, we profiled the beam for the wavefront sensors. We found that the Gouy phase separation between the two WFSs is approximately 70 degrees. We decided to leave the current configuration as it is since the separation is good enough. Masayuki will make a plot and perform a more detailed calculation later.

We also maximized the laser power in the REFL path by optimizing the waveplate angle. When JAC is unlocked, the measured power on the RFPD is 5.1 mW, and the trigger PD voltage is 0.28 V. When JAC is locked, the measured power decreases to 0.4 mW, and the trigger PD voltage is 0.02 V. Since the beam is split evenly, each WFS receives approximately 2.55 mW of optical power.

Finally, we calibrated the DC readout of RFPD by converting counts to mW. Before performing the calibration, Masayuki checked the alignment and recentered the RFPD. He then recorded two sets of measurements, each averaged over 10 seconds:

Measurement #1

* JAC_REFL_A_LF_INMON: 1072.3966186523437 counts
* DC power: 4.4 mW

Measurement #2

* JAC_REFL_A_LF_INMON: 1073.5228637 counts
* DC power: 4.5 mW

After the calibration, we updated filter number 10 with the new coefficients.
The beam profile between the beamsplitter and the JAC WFS was measured. Here I fit a Gaussian beam to those measured beam sizes and convert the WFS locations into Gouy phase.
The measured beam diameters were fit independently in x and y with the standard Gaussian beam model, w(z) = w0 * sqrt(1 + ((z - z0)/zR)^2) with zR = pi * w0^2 / lambda and lambda = 1064 nm:
| w0 [um] | z0 [m from JACR_BS4] | zR [cm] | |
|---|---|---|---|
| x | 141.2 | 0.377 | 5.89 |
| y | 151.9 | 0.370 | 6.81 |
The beam is slightly astigmatic, so x and y are treated separately throughout.
The positions of WFS A and WFS B were measured with a ruler from the same reference as the profile scan: WFS A at z = 0.325 m, WFS B at z = 0.410 m. The corresponding Gouy phases, psi(z) = arctan((z - z0)/zR), are:
| WFS A [deg] | WFS B [deg] | Separation [deg] | |
|---|---|---|---|
| x | -41.3 | +29.5 | 70.8 |
| y | -33.5 | +30.4 | 63.9 |
The separation is 71 deg in x and 64 deg in y, not the optimal 90 deg. This is not optimal, but it is not terrible either: the two WFS remain well separated in Gouy phase and the sensing matrix would not be close to degenerate. Given the time available we did not optimize the layout.
If we want to optimize it later, the fix is straightforward: moving WFS A upstream (toward the BS) by about 5 cm in x / 7 cm in y, i.e. from z = 0.325 m to roughly z = 0.27 m, brings the separation to 90 deg. WFS B does not need to move.
Additional context for the work described above: The motivation for the table work came from the difficulties we had with the sensing and input matrices of the JAC ASC loops. In pitch, the PZT and JM1 signals are well separated, but their responses in yaw are too similar. This is problematic because we need the two wavefront sensors to distinguish between the motions of the two actuators.

While identifying a new location for the camera, Masayuki noticed that the shutter was clipping approximately half of the beam on the left side. We suspect that the beam may have been clipped for some time and that this may be related to the yaw issue, since the clipping affects yaw more strongly than pitch.
Today we installed the iris to block the ghost beam on the JAC REFL path with an iris, and to re-measure the beam profile with it in place. The ghost beam was produced by the laser window which picks off the partial power of the JAC reflection beam (~0.4%). Since this laser window doesn't have the wedge on it, the AR reflection is not well separated. We observed this interference during the original beam profile measurement in this thread.
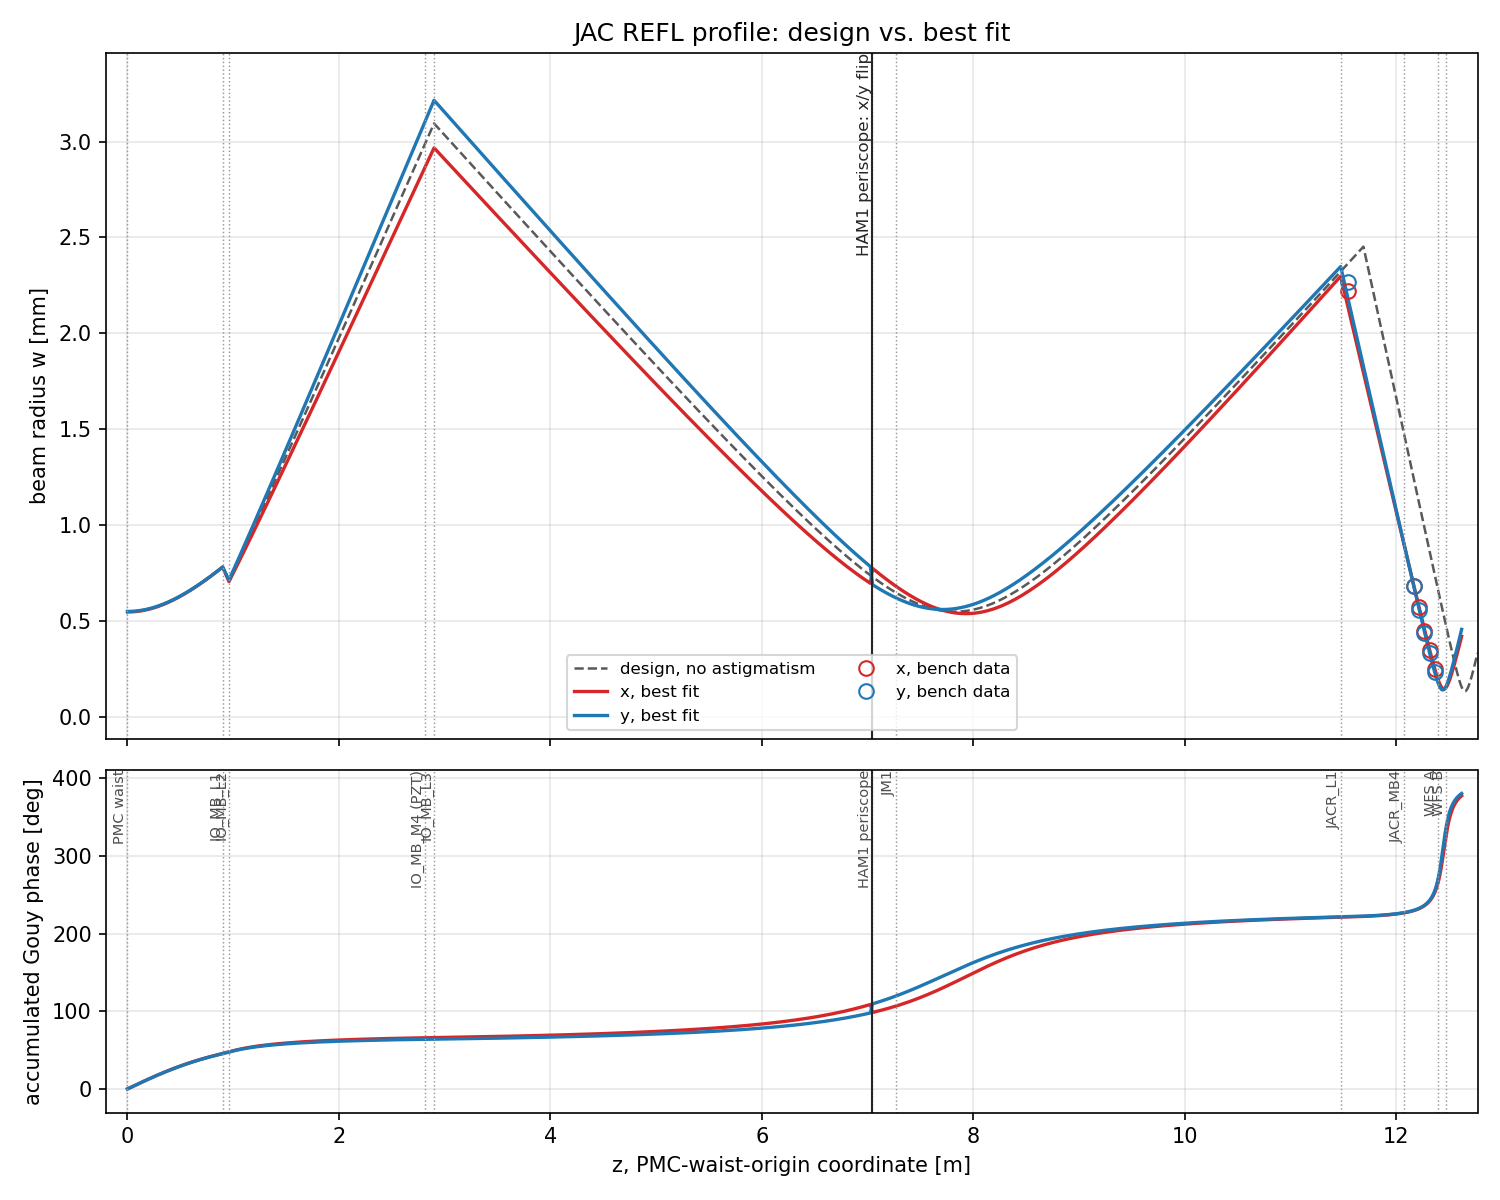
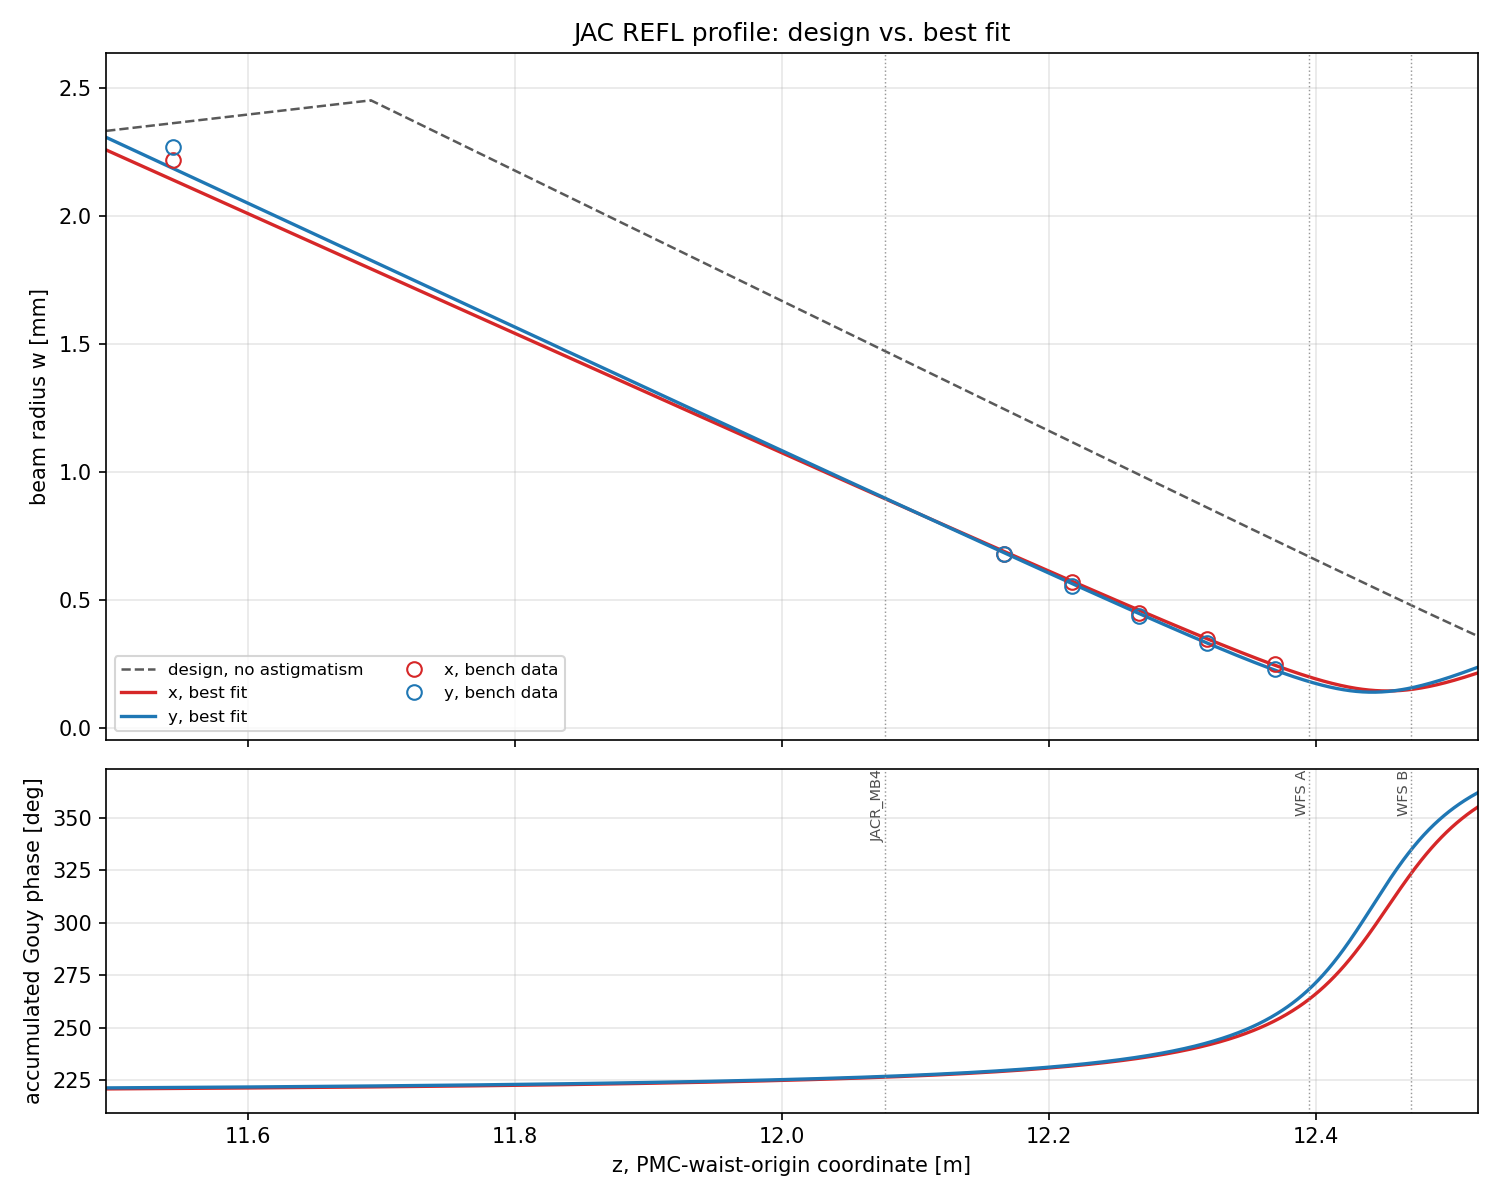
And now, the iris dumps the ghost beam, and we made a new the beam profile measurement. I made a good JAC REFL optical model which obtained by the fitting the beam profile measurement. We will use this model for the WFS signal calibration.
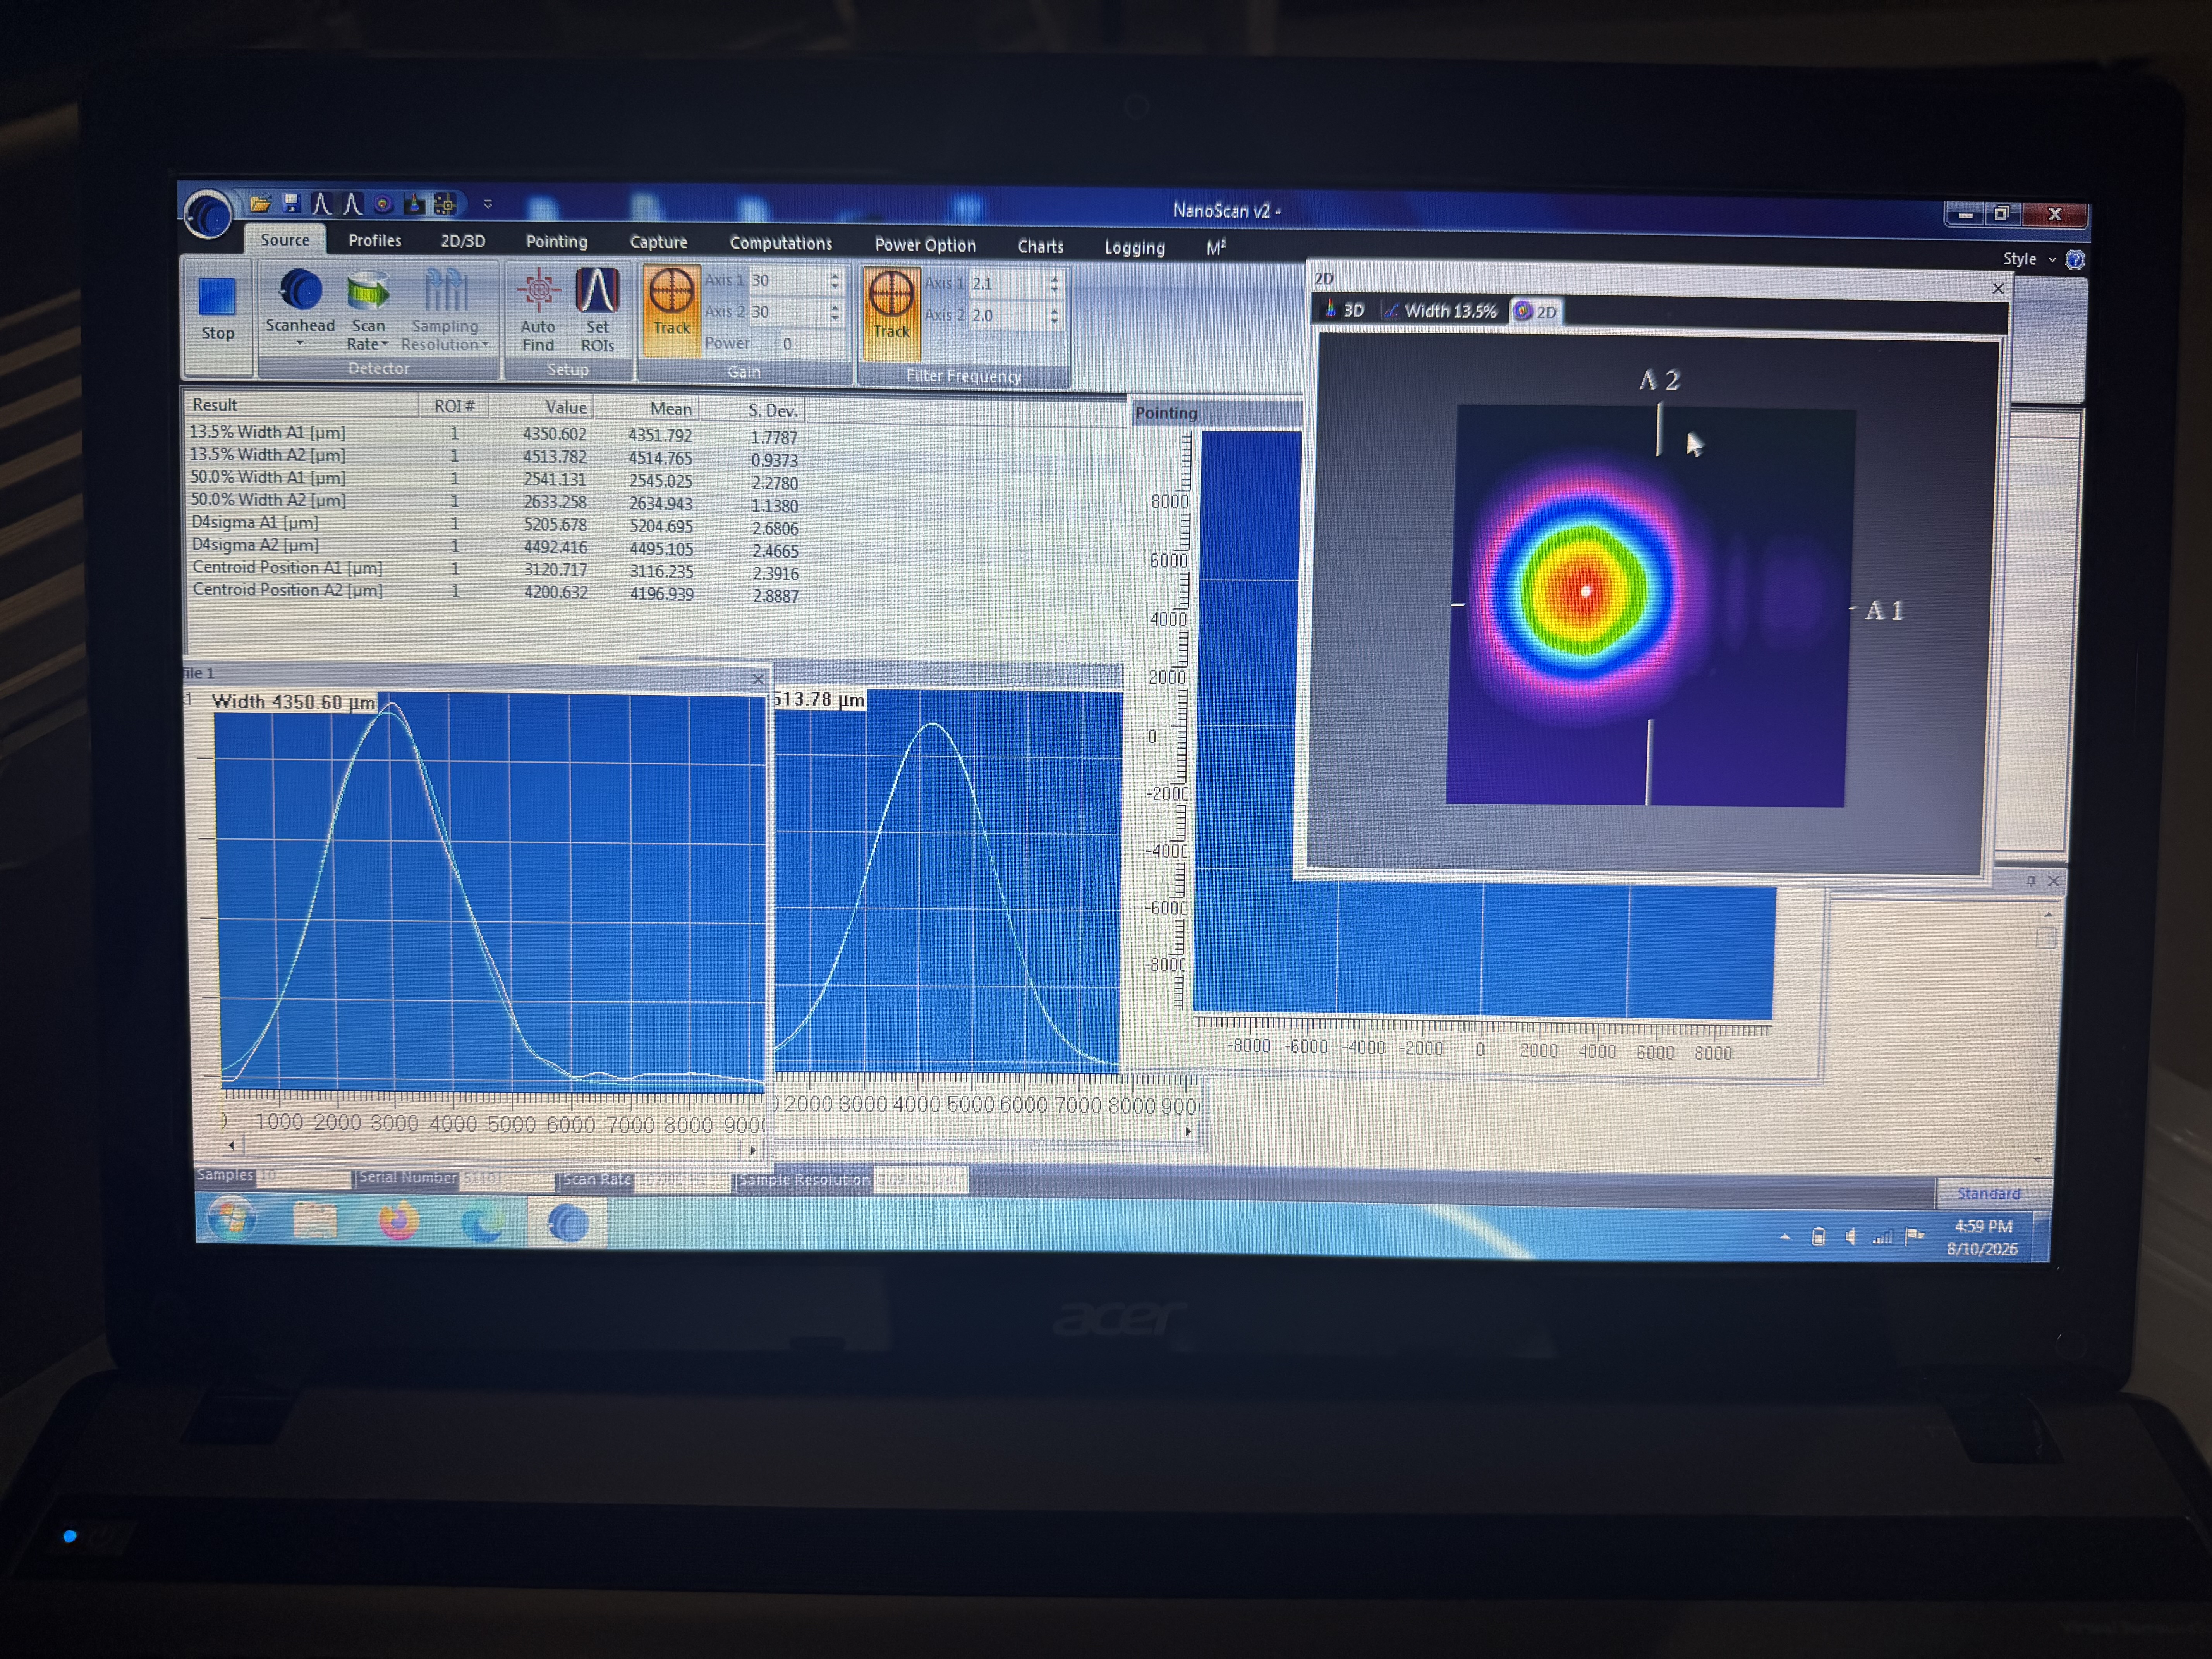
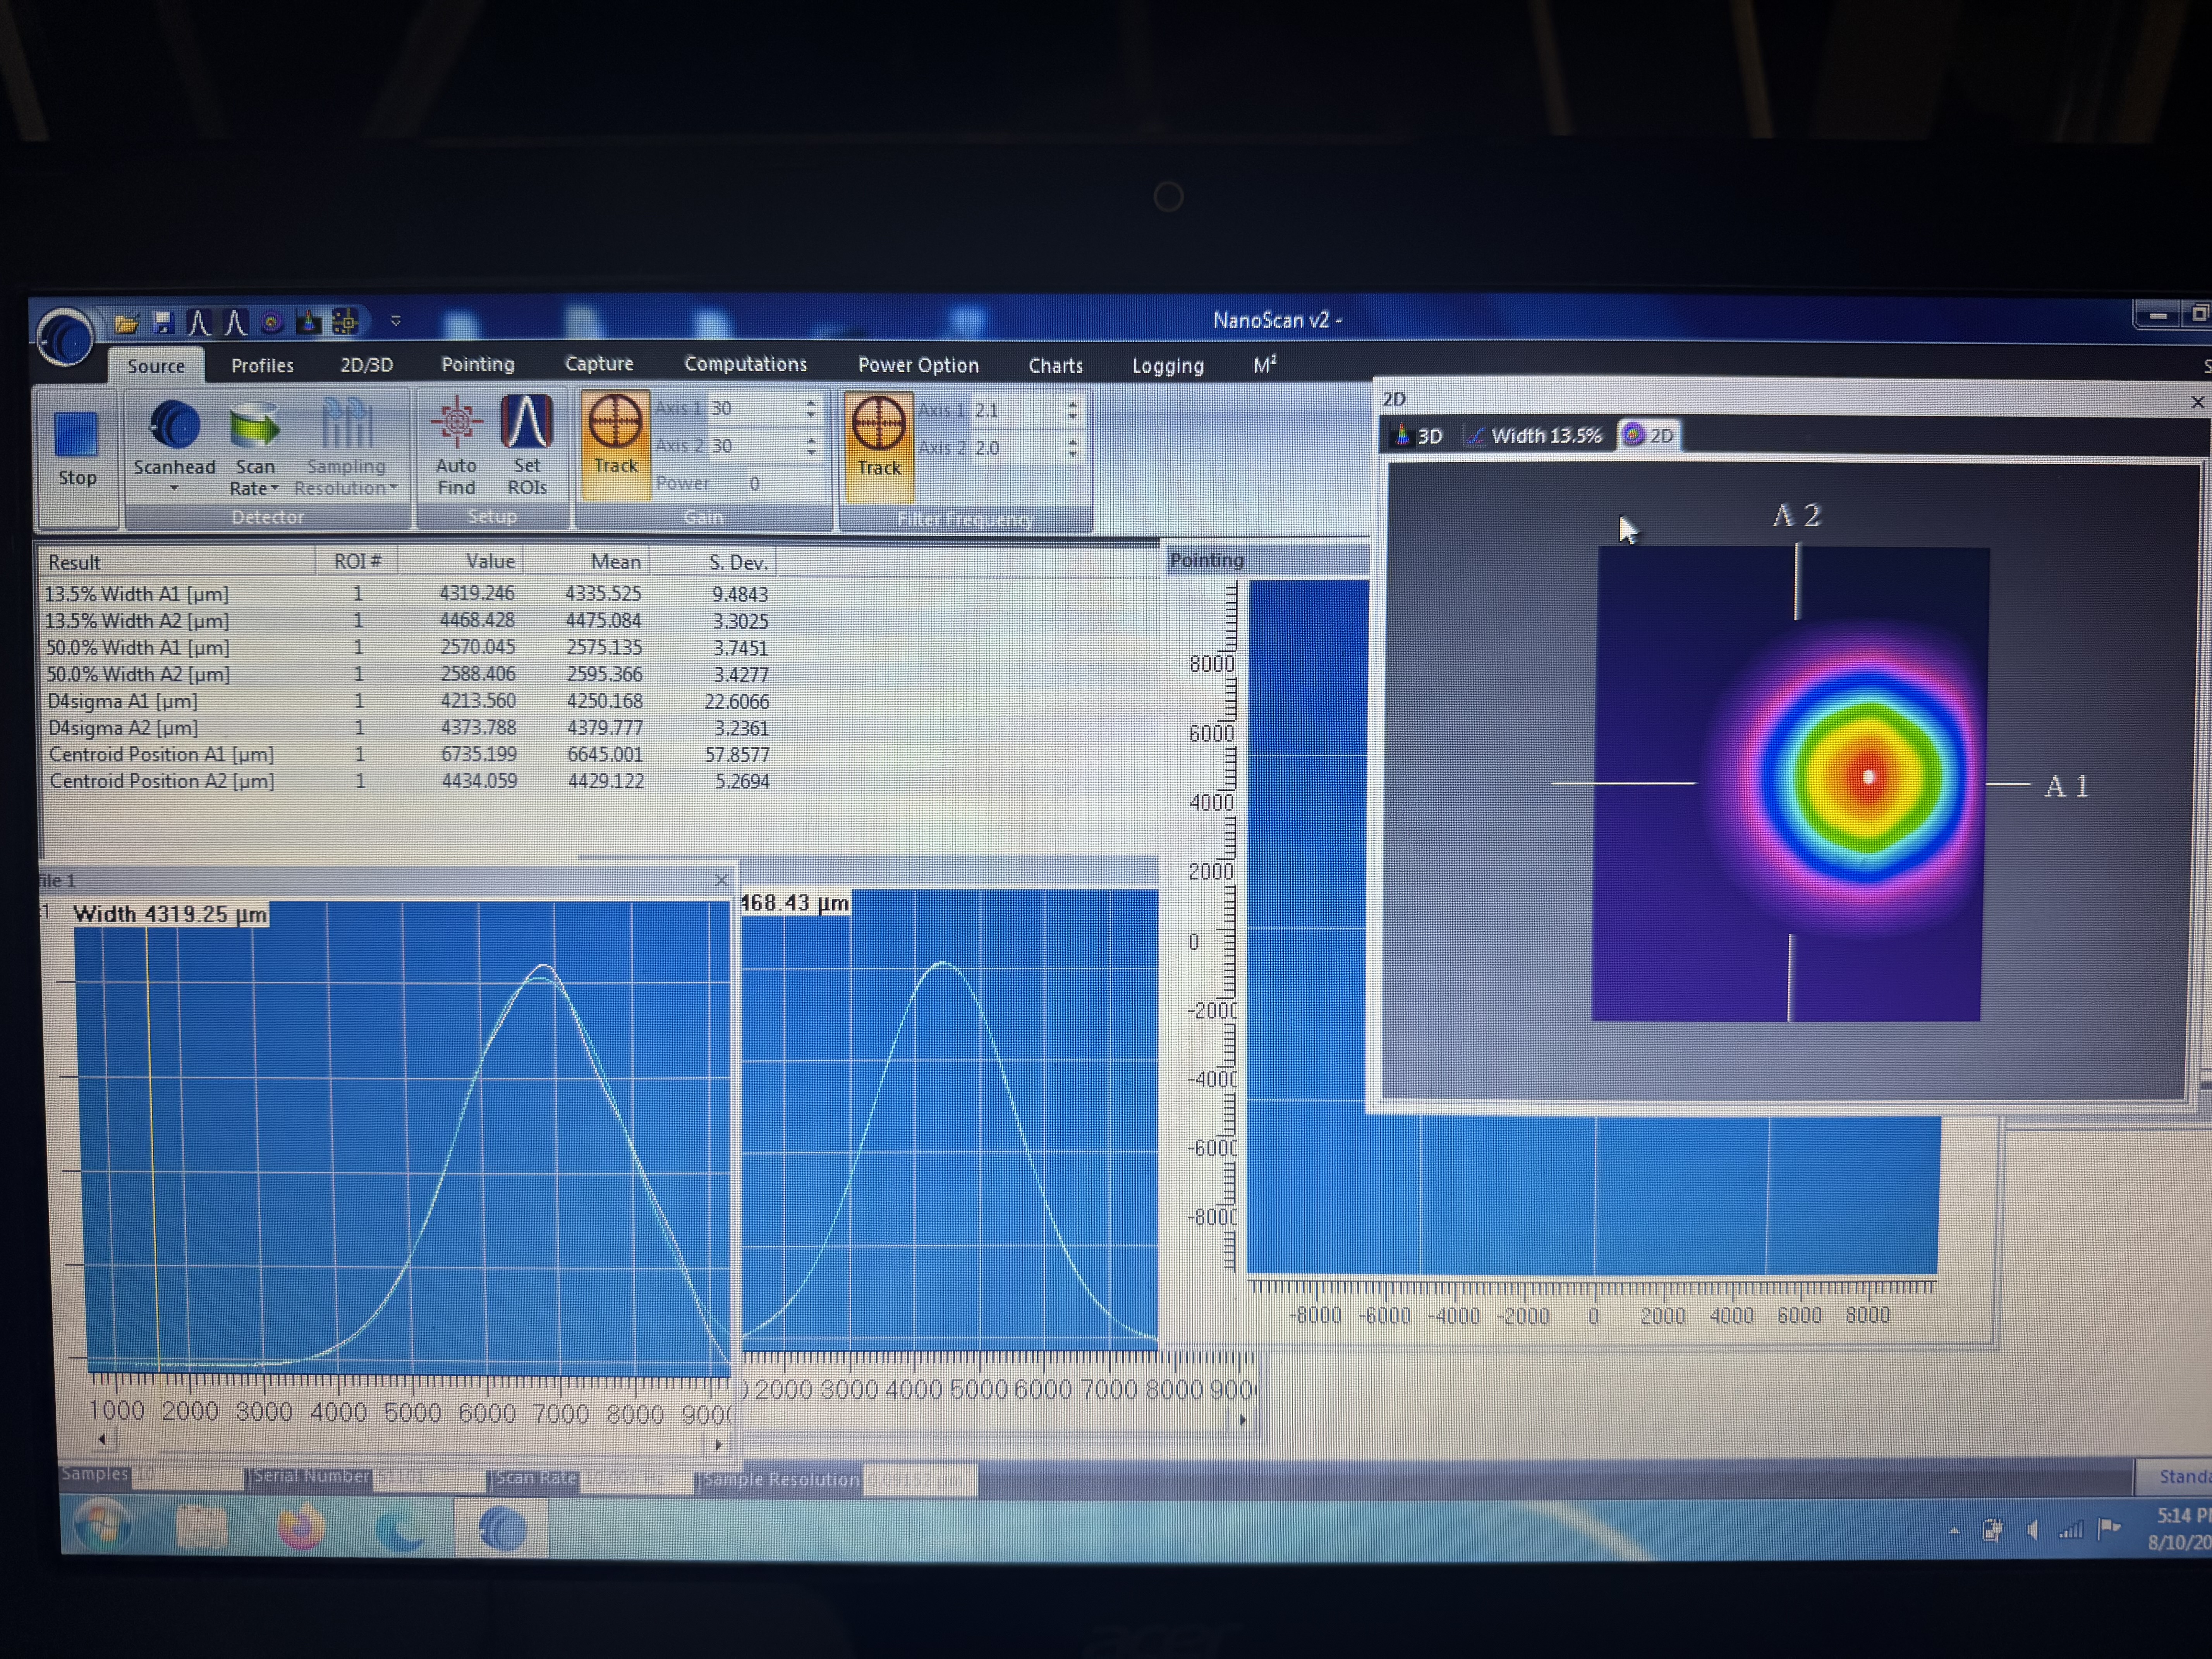
An iris was placed on the REFL path, between the first pick-off mirror and the first lens. To position it, the beam profiler was set just after the beam shutter, and the iris was closed while watching the profile, until the ghost was blocked and the main beam was left untouched. Actually, Since the ghost beam is very close, the main beam is partially blocked as shown in the attached pics. We will see if it would have any effect on our WFS signals.
1/e2 diameters along the REFL path, with JACR_MB4 as the origin:
| z [inch from JACR_MB4] | -21 | 3.5 | 5.5 | 7.5 | 9.5 | 11.5 |
|---|---|---|---|---|---|---|
| horizontal [μm] | 4440 | 1360 | 1140 | 895 | 696 | 500 |
| vertical [μm] | 4540 | 1360 | 1111 | 873 | 661 | 461 |
On-table distances were also measured: JACR_L1 to JACR_MB4 = 24", JACR_MB4 to WFS A = 12.5", JACR_MB4 to WFS B = 15.5".
I made a model of the beam propagation of the JAC REFL path from PSL to JAC and IOT1. This model was fitted to the new profile, with the PMC waist as origin.
Taken as known. The positions of lenses in PSL (IO_MB_L1/L2/L3) and of the JAC waist are the design values, i.e. the PSL bench to HAM1 relative distance is trusted.
Taken as unknown. The design placed the IOT1 table only loosely, and the periscope that matches the HAM1 beam height to the table height was estimated roughly. The distance from the JAC input to the IOT1 table is therefore the principal free parameter, allowed ±30 cm; it enters the calculation as the position of JACR_L1 measured from the PMC waist. The profile measurement was referenced to JACR_MB4, which carries its own error, so the JACR_MB4-JACR_L1 distance is a second free parameter.
The profile carries astigmatism, so a yaw tilt was allowed on each of the four lenses (three on the PSL bench, one on IOT1). This is deliberately over-parameterised: the individual tilts should not be read as physical alignment errors. However, the aim of this analysis is not to measure how each lens sits but a model accurate enough for the following calculation. So as long as the aquired prameters are physically reasonable, we can use these numbers as the following calculations.
One note:
The HAM1 periscope (JAC_M1/JAC_M2) rotates the beam 90 degrees about its axis, so the transverse planes swap on the way to JAC: bench x (YAW) descends from the upstream sagittal channel and bench y (PIT) from the tangential one. A tilt therefore gives astigmatism of opposite sign depending on which side of the periscope the lens sits. This is the reason why the x/y beam size flipped at periscope in the attached plot.
| parameter | fitted | vs design |
|---|---|---|
| JACR_L1 position from PMC waist | 11.4768 m | -21.5 cm |
| JACR_MB4 to JACR_L1 | 0.6004 m | -0.36" |
| yaw tilt, IO_MB_L1 / L2 / L3 | -16.9° / -7.1° / -1.8° | - |
| yaw tilt, JACR_L1 | -3.2° | - |
The fitted path from the JAC input to the IOT1 table comes out about 21.5 cm shorter than design, which is the scale of looseness that was expected there.
Astigmatism at the WFS planes
Expressed as the difference in accumulated Gouy phase between the two transverse axes:
| model | from the measured profile alone | |
|---|---|---|
| WFS A | -4.10° | -4.96° |
| WFS B | -10.61° | -10.32° |
Taking the cavity eigenmode as the reference, the fitted injection-lens tilts imply a mismatch of 0.48 % (tangential) and 0.43 % (sagittal), 0.91 % combined. Small enough not to conflict with the measured mode matching (~1%).
PMC eigen mode
| axis | w0 [μm] | zR [mm] |
|---|---|---|
| tangential (u) | 546.312 | 881.232 |
| sagittal (v) | 549.028 | 890.016 |
The waist sits at z = 0 in both axes. Downstream of the periscope the tangential channel becomes bench y (PIT) and the sagittal channel bench x (YAW).
z is given from the PMC waist (the model's own origin) and from JACR_MB4 (the origin the bench profile was measured against).
| element | z from PMC waist [m] | yaw tilt [deg] | source |
|---|---|---|---|
| PMC waist | 0.000000 | - | origin |
| IO_MB_L1 | 0.900000 | -16.86 | design / tilt fitted |
| IO_MB_L2 | 0.960000 | -7.12 | design / tilt fitted |
| IO_MB_M4 (PZT) | 2.812000 | - | design |
| IO_MB_L3 | 2.900000 | -1.75 | design / tilt fitted |
| HAM1 periscope (JAC_M2) | 7.040000 | - | design; x/y swap |
| JM1 | 7.268000 | - | design |
| JAC input mirror | 7.576000 | - | design |
| JAC waist | 7.826000 | - | design |
| JACR_L1 | 11.476799 | -3.15 | fitted |
| JACR_MB4 | 12.077174 | - | fitted (via JACR_L1 distance) |
| WFS A | 12.394674 | - | measured from JACR_MB4 |
| WFS B | 12.470874 | - | measured from JACR_MB4 |
| parameter | fitted value | design | allowed range |
|---|---|---|---|
| JACR_L1 from PMC waist | 11.476799 m | 11.691967 m | ±30 cm |
| JACR_L1 to JACR_MB4 | 0.600375 m | 0.609600 m | ±1" |
| yaw tilt, IO_MB_L1 | -16.8588° | 0 | ±20° |
| yaw tilt, IO_MB_L2 | -7.1210° | 0 | ±20° |
| yaw tilt, IO_MB_L3 | -1.7534° | 0 | ±20° |
| yaw tilt, JACR_L1 | -3.1527° | 0 | ±20° |
Jennie W, Khanh V,
Since Keita and I realised that the WFS A and B quadrants 2 and 3 are swapped between the RF channels and the DC channels, I have been trying to trace down where the error is. Last week we fixed the problem by swapping the cables for WFSA segment 2 and 3 and WFS B segment 2 and 3 cables at the IOT1 feedthrough panel.
I don't think it is in the RF signal chain as when we unplugged WFS HF segment 2 from the outside of the feedthrough, the channel that corresponds to WFS segment 2 went dark in EPICS.
Since we are still laser SAFE in the corner, Khanh and I took a laser pointer onto the JAC table and tried to see if we could only shine it on one quadrant of the QPD. Since the QPD is as large as the beam this was not really practical. We instead moved a beam card in front of the PD and slowly drew it downwards.
Since quadrants 2 and 3 are the two we suspect are swapped, we looked at which of these showed some light first.
We used the response to the table lights being blocked with the card to see if there was a difference in the readout from each QPD segment. Using the laser point for this did not work as the beam reflects off the card and the QPD casing.
Segment 3 showed light before segment 2 when moving the card down from the top of the diode.This implies the readout channels for 2 and 3 are swapped. The step in power was not as obvious as with a laser beam so I would like to recheck this once we go laser hazard.
Khanh and I also took the side panel off the table and traced the individual WFS cables from the QPD boxes to the feedthrough. These cable are all plugged in correctly on the inside of the feedthrough.
Next step is to get Fil's help to either check the DC pin outs on the WFS boxes or check the channels on the RF PD chassis at ISC-R1.
Summary: We think the JAC WFS QPDs have two segments wired incorrectly but only on the DC readouts, not the RF readouts.
There's no reason to suspect that DC connection is somehow wrong, the issue was RF cross-wiring (which we "fixed" by making another cross-wiring) and we already knew that.
FYI, this is what happened on Monday:
We were able to move the JAC refl beam spot on the WFS using JM1 as well as picos and nothing weird was observed. PIT was PIT, YAW was YAW, you can move from e.g. segment 1 to segment 2 by YAW motion, then from 2 to 3 by big PIT etc. If segment 2 and 3 were swapped in DC, the beam would have hopped from segment 1 to segment 3, not to 2, after YAW motion, but that was never the case. So QPD connections seemed good.
We confirmed (by pico-ing the beam on WFS while using DC signals to guide us) that DC segment 2 corresponded to RF segment 3, and DC segment 3 to RF segment 2, both for WFS A and B. Clearly the RF chain was somehow cross-wired. When we disconnected the segment 2 RF cable connecting IOT1 and the field rack on IOT1 feedthrough, segment 3 signals in digital world (e.g. H1:JAC-WFS_A_I3_OUT etc.) showed big jumps in the dark offset, and vice versa, if I remember correctly. As a quick "fix" we made another cross-wiring to undo whatever cross-wiring that existed by swapping the RF connection of segment 2 and segment 3 on the feedthrough on IOT1 (alog 91272). This caused an inconsistency between the cable labels and the feedthrough marking, i.e. somethingsomething_A2 cable is now connected to WFSA segment 3 TNC on the feedthrough, A3 cable to segment 2, and the same thing for WFSB.
Considering the above, it's unlikely that the RF cross-wiring is in IOT1. It should be downstream somewhere.
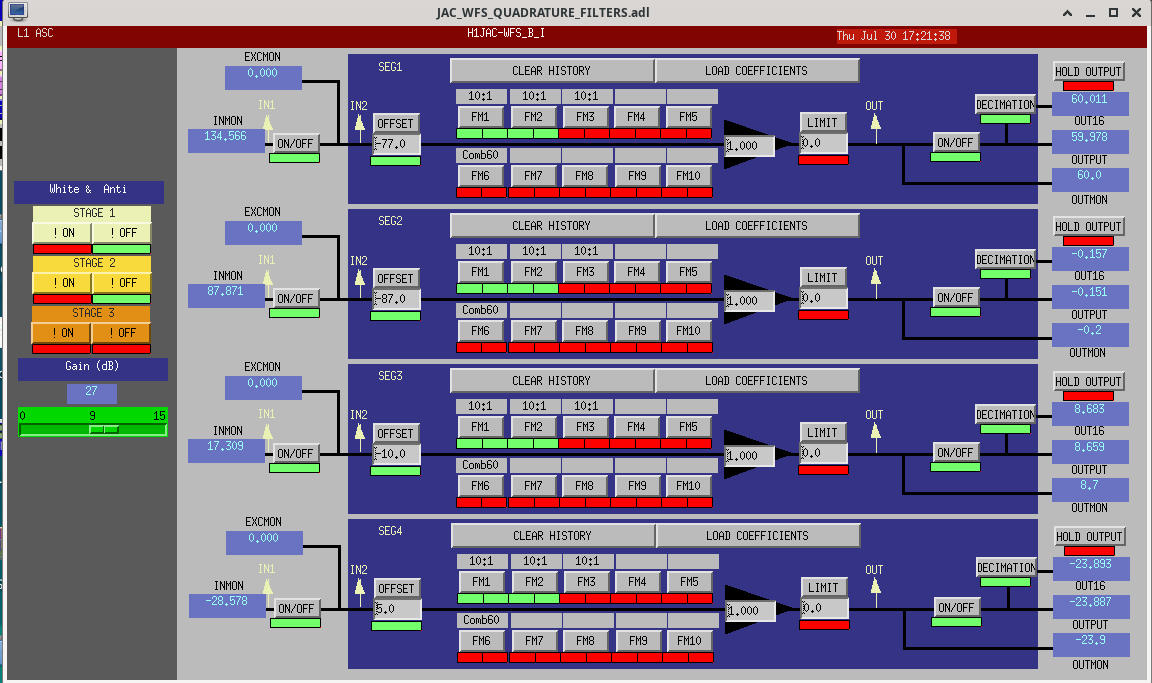
JAC WFS analog whitening was in a weird state where it didn't match digital anti-whitening. Fixed it by pressing "ON" for the first and the second whitening filter.
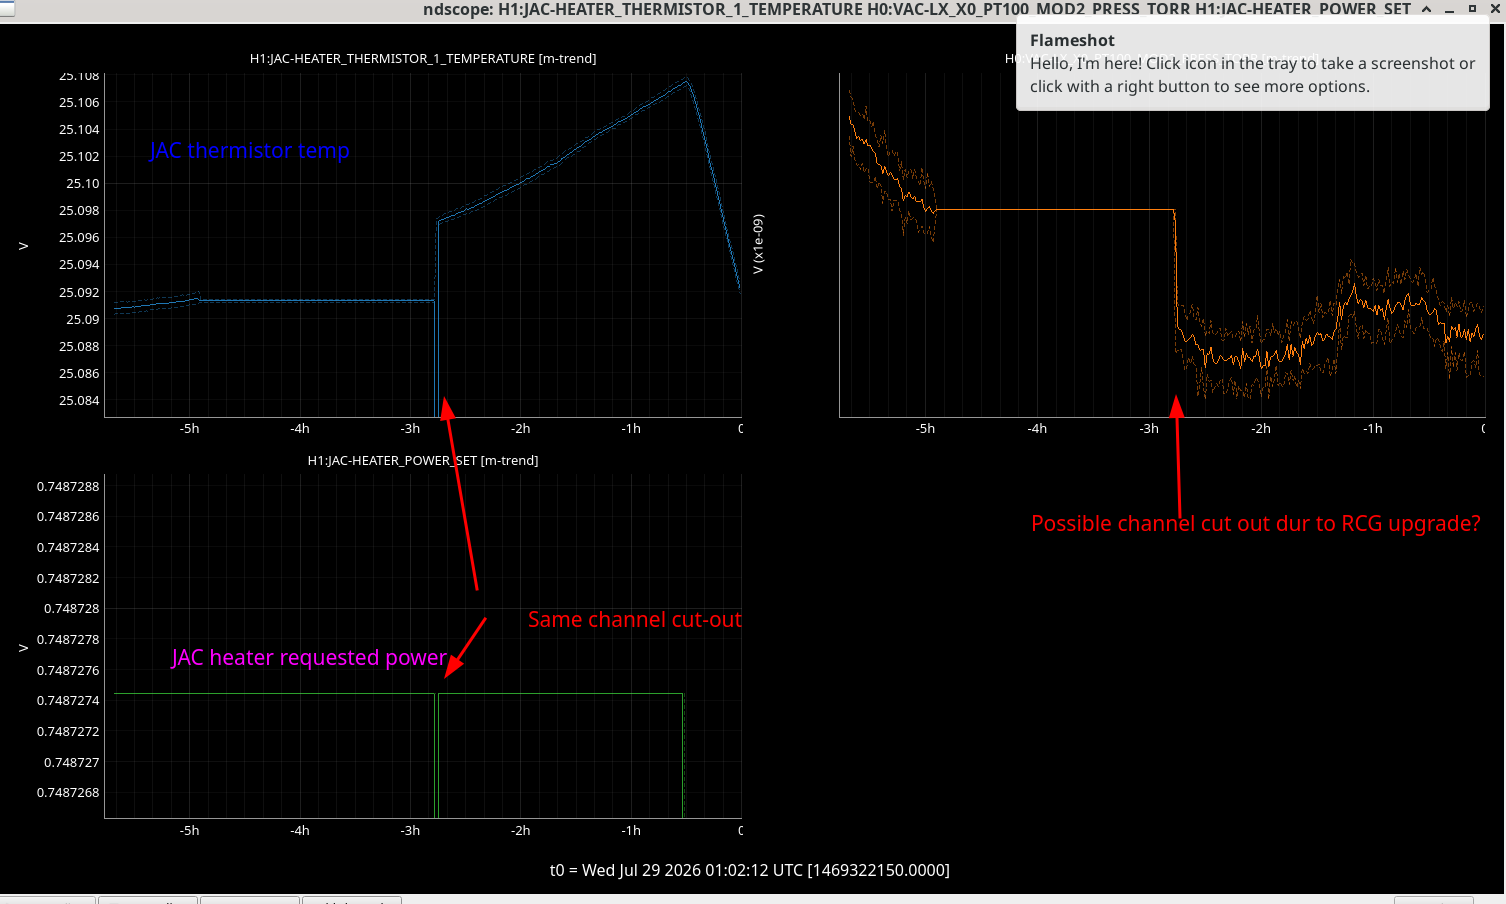
Gerardo pointed out that the HAM1 pressure had been rising for about an hour. Ryan checked that the JAC heater guardian was off. However, the JAC heater was still on at steady power. I called Jennie, and she turned the JAC heater power to zero. It had been set with a value of 0.749, which is not high compared to its usual value. We will monitor HAM1 pressure to see if it turns around.
HAM1 pressure appears to be dropping now.
As far as I can tell from trending Backhoff channels for the JAC heater we have been at the same set heater power all day (~0.7W).
So not sure how it was the heater causing this.
The last time we had this problem it was because we were dumping 3W of power into the heater.
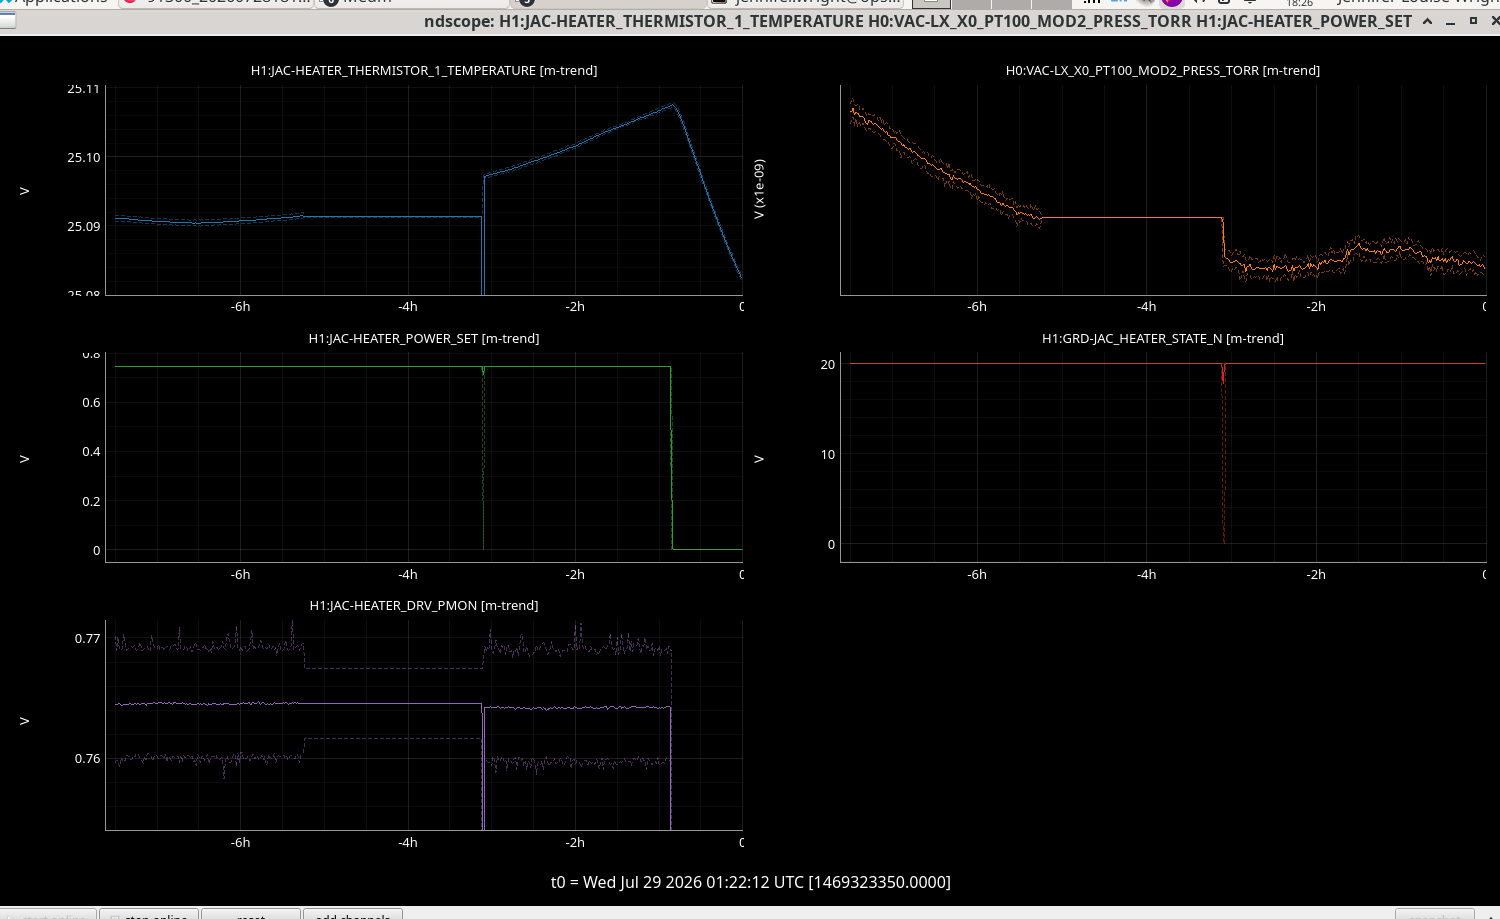
Included are long term trends of the heater power set value in Watts and the JAC thermistor we use for control in degrees. I also included the HAM1 pressure.
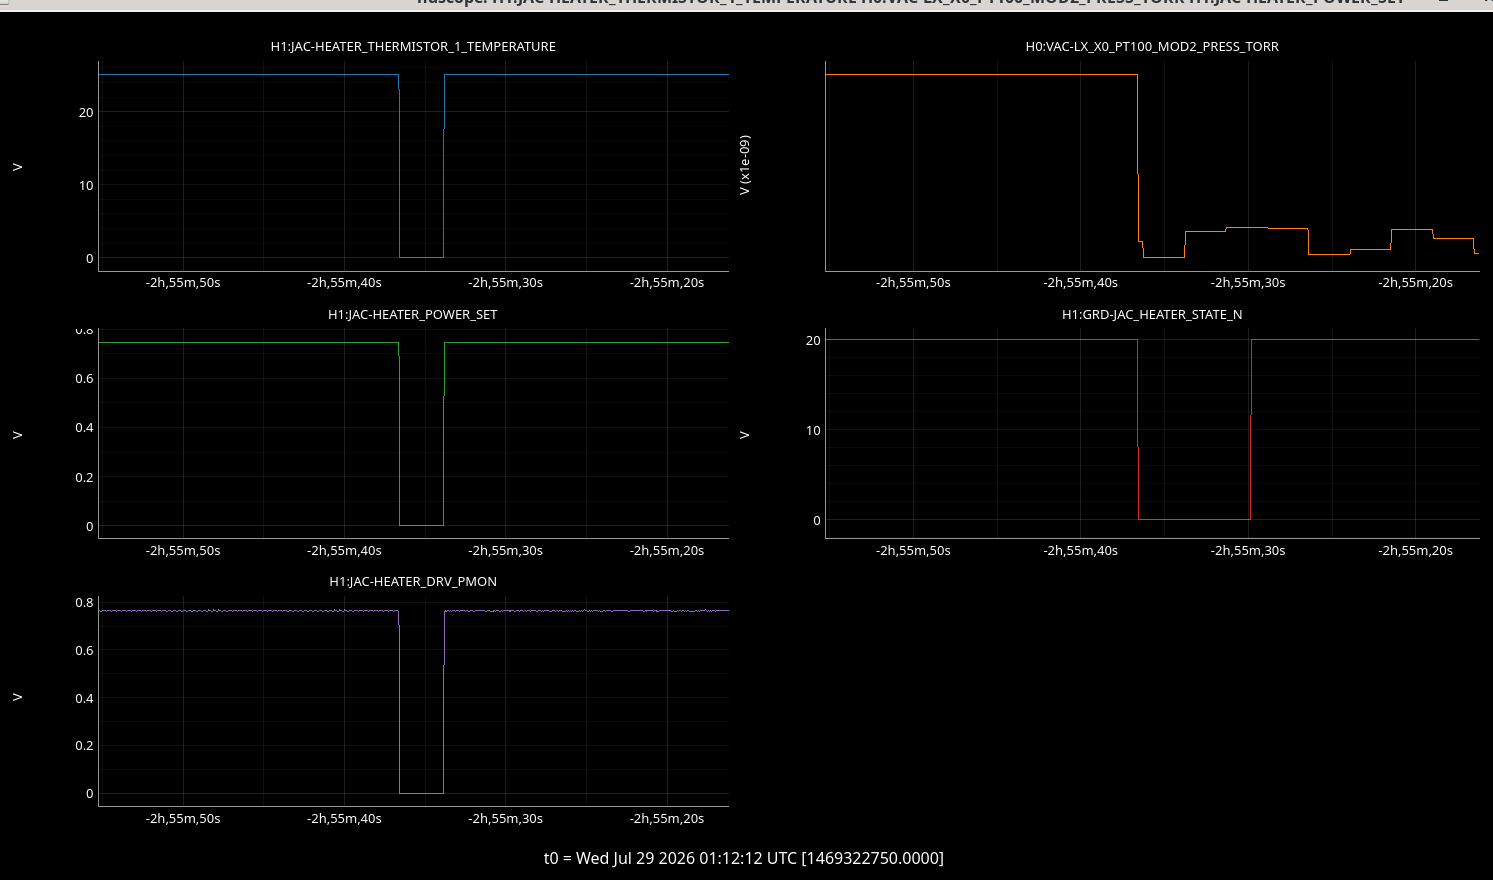
There was a channel cut-out about 3 hours ago in all the JAC heater channels, but I assume this was something to do with the RCG upgrade.
They all went to 0 including the JAC heater guardian. Its on state is 1 and off is 20.
During the cut-out it went to 0 so should not have turned the heater control loop on.
This zoomed in picture of the time all these channels went to 0 is the second attachment.
Here is a long term trend showing the constant readback power from the JAC heater in the bottom left plot and the JAC guardian state in the bottom right.
The temperature on the JAC thermistor has been rising sharply for the last three hours.
Summary: This makes me suspicious that some Beckhoff channel cutting out caused this temperature spike and thus the pressure spike but not sure what.
Pending Filter Files:
h1calcs had a modified filter file waiting to the loaded. The running filter file was last loaded 16jul2026, H1CALCS.txt was modified at 10:52 27jul2026 and not loaded. I made a local copy of the modified file, then removed the changes by doing a subversion revert. This cleared the CFC flag on h1calcs.
SDF Diffs:
Several models have outstanding SDF diffs (screen shots attached below)
| model | num diffs |
| susmc2 | 2 |
| susam | 8 |
| susomcab | 6 |
| susom1ab | 16 |
| susom2ab | 8 |
| susom3ab | 16 |
| isibs | 11 |
| isiham3 | 1 |
| isiham7 | 54 |
| calinj | 1 |
| calex | 1 |
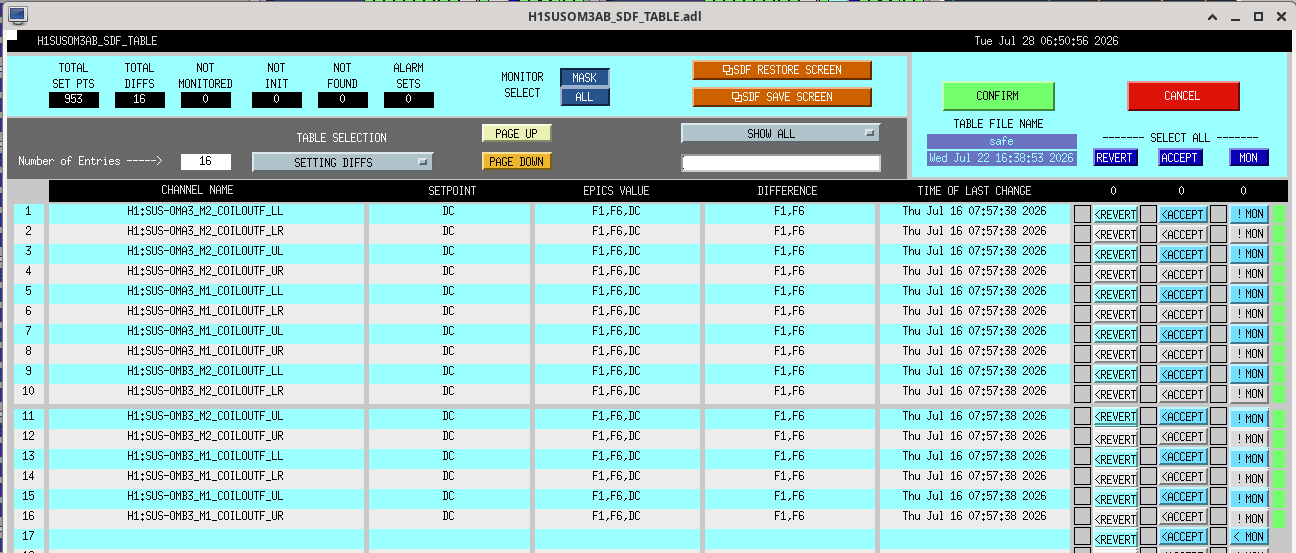

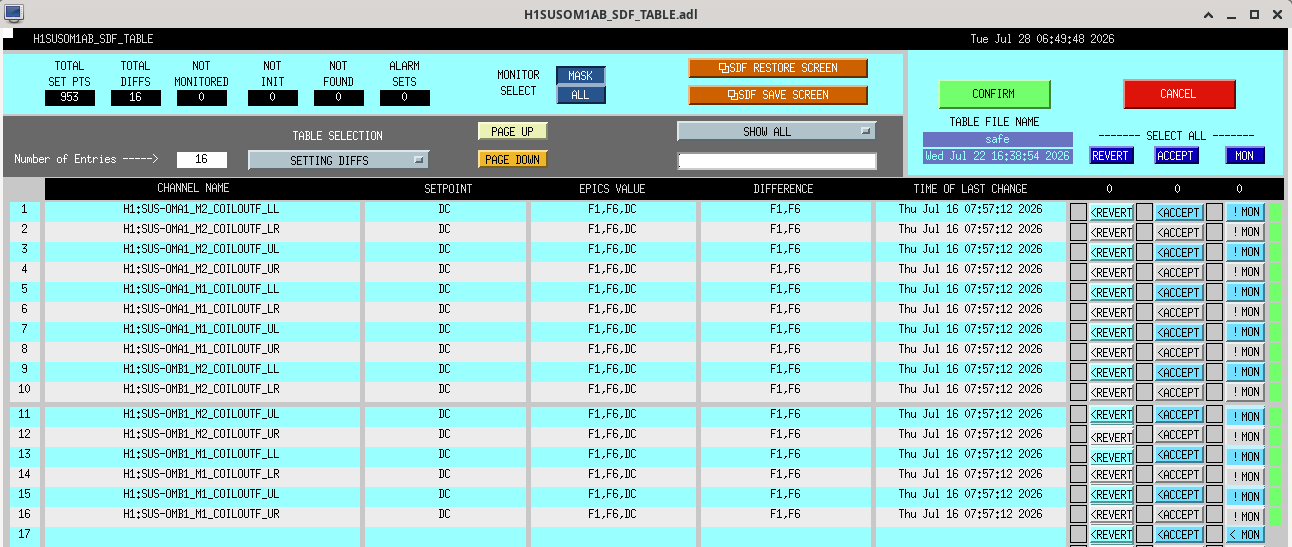
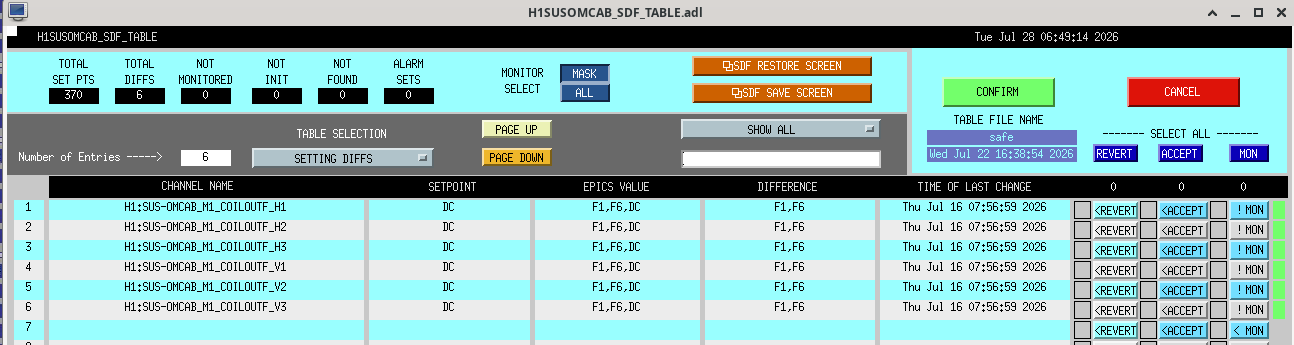
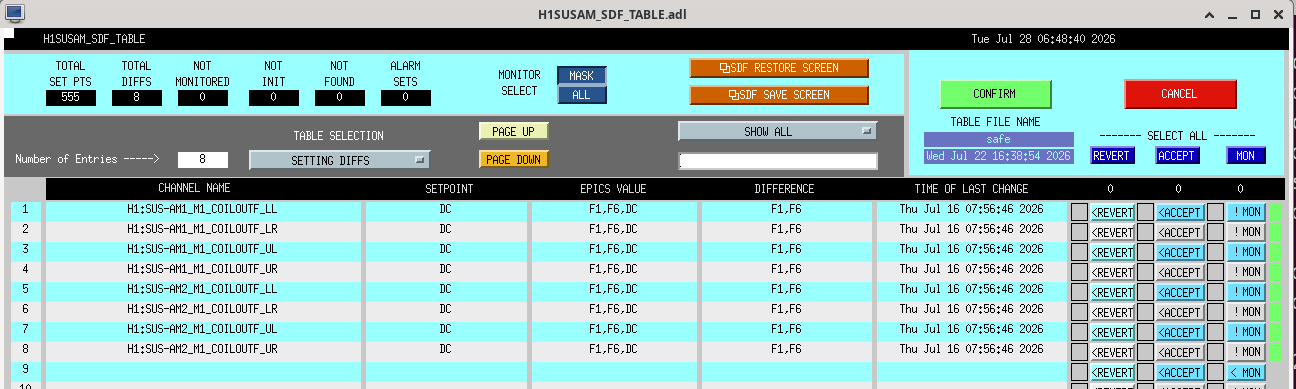



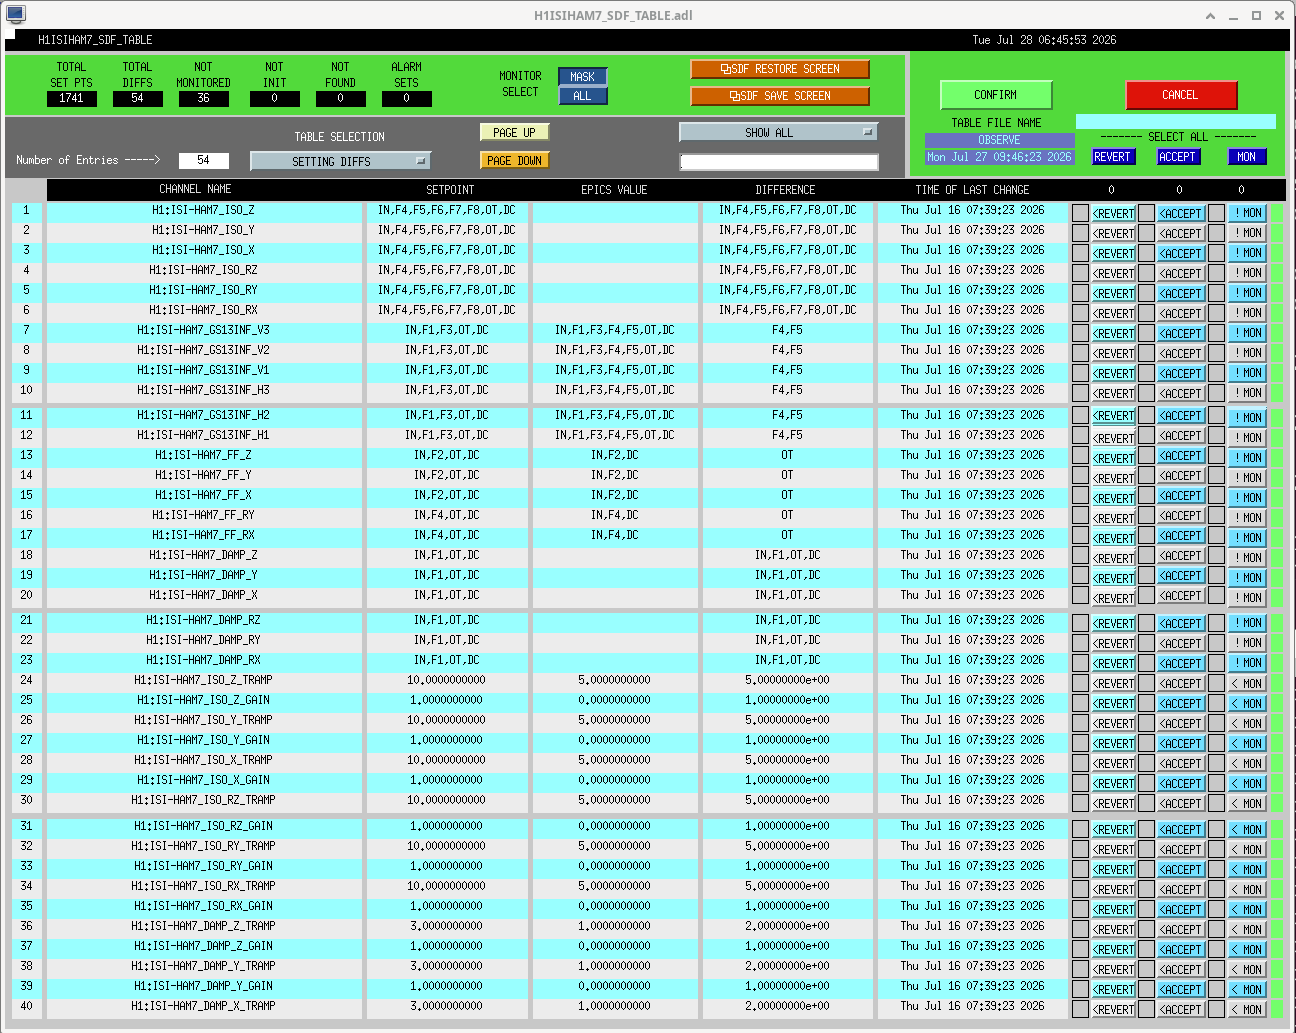

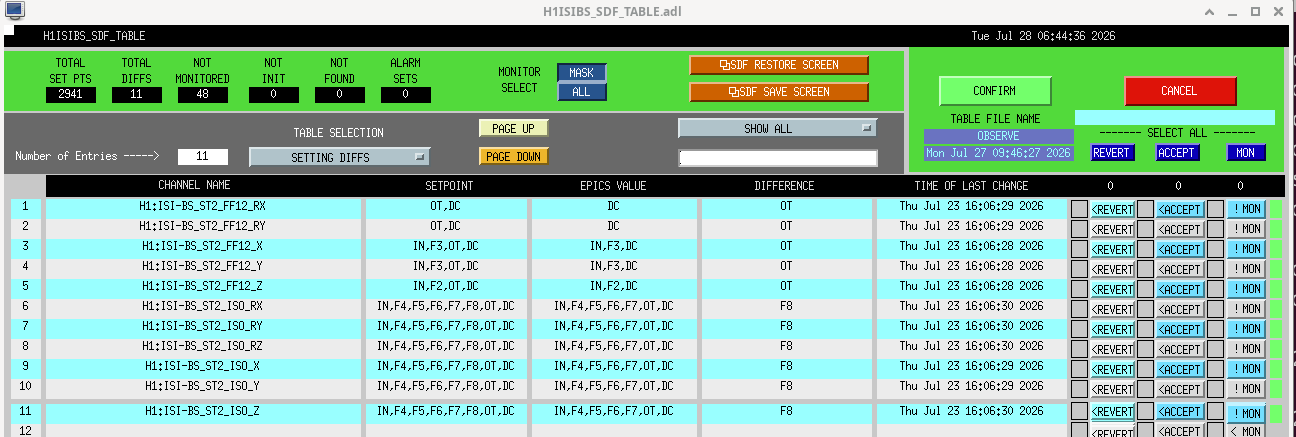

Got some screen shots of a few different SDF Diffs.
I took these screenshots after Corey had already taken the SUS to SAFE state.
Also the LASER Stop button had already been pressed.
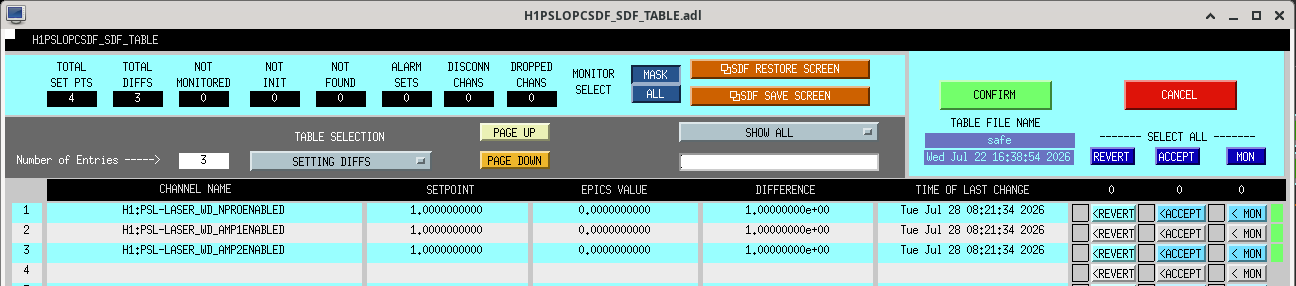
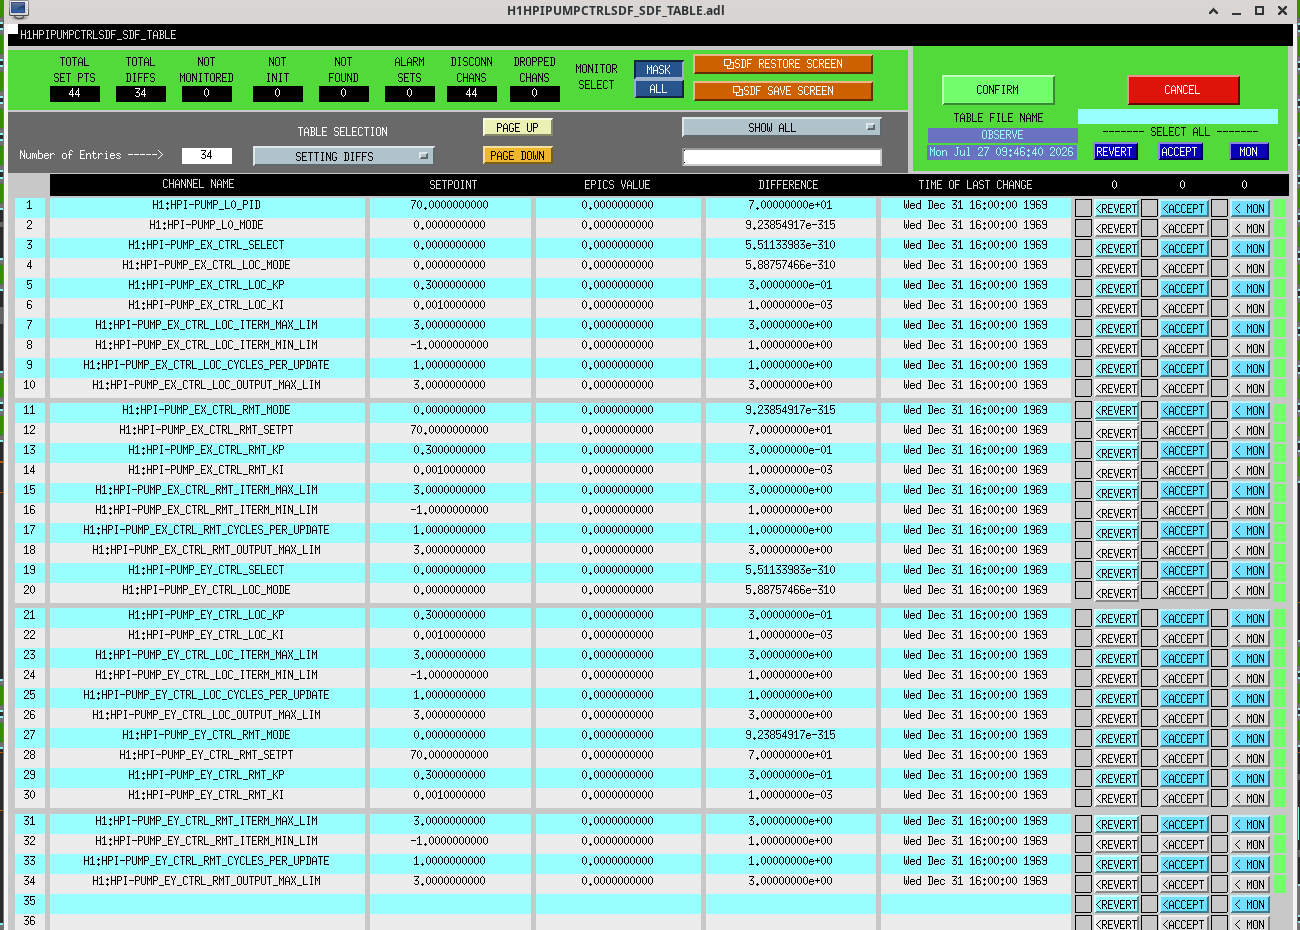
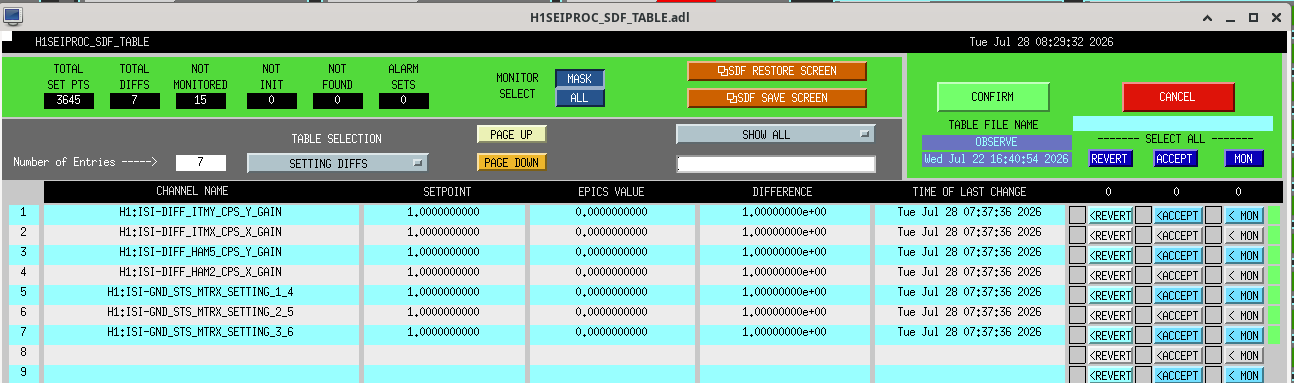
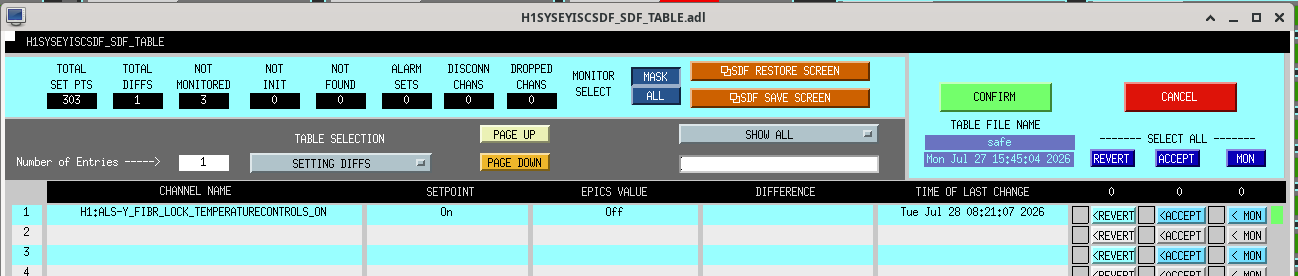
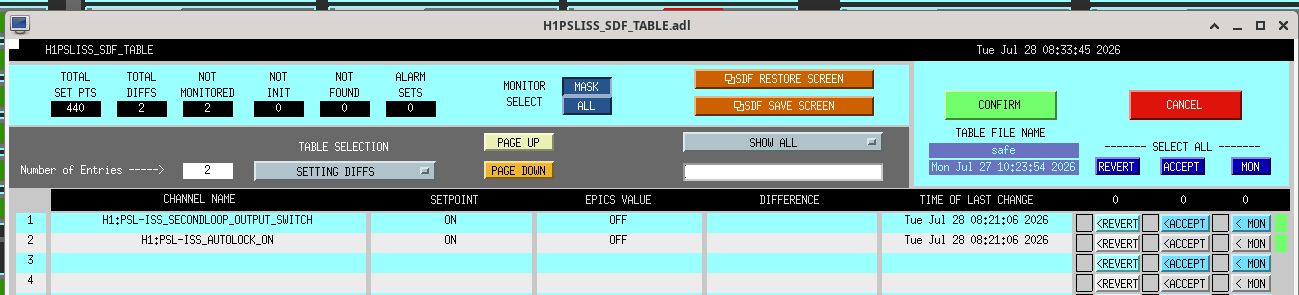
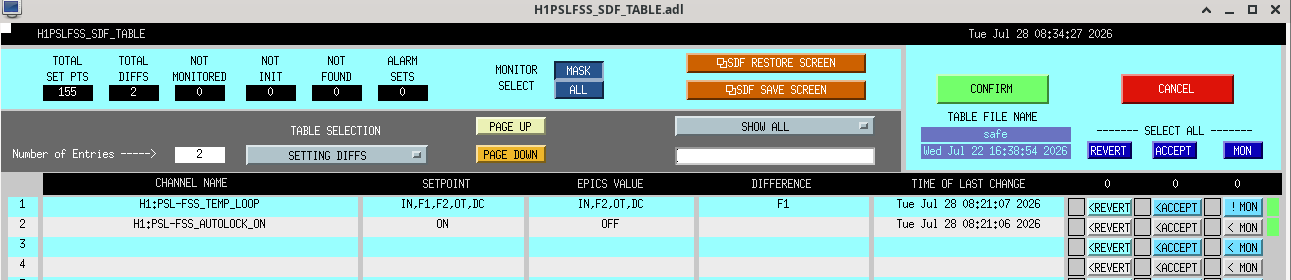

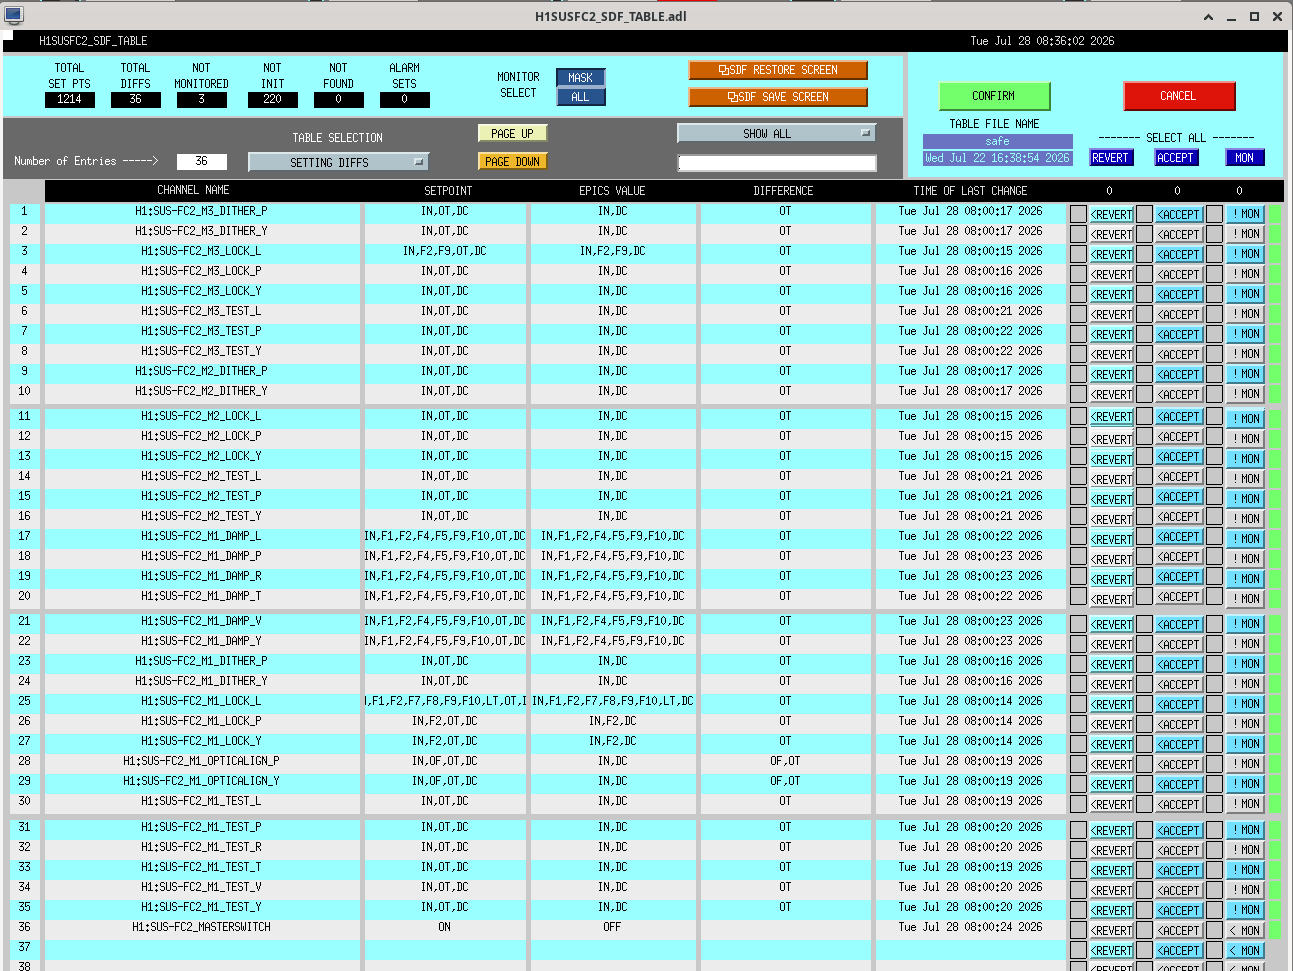
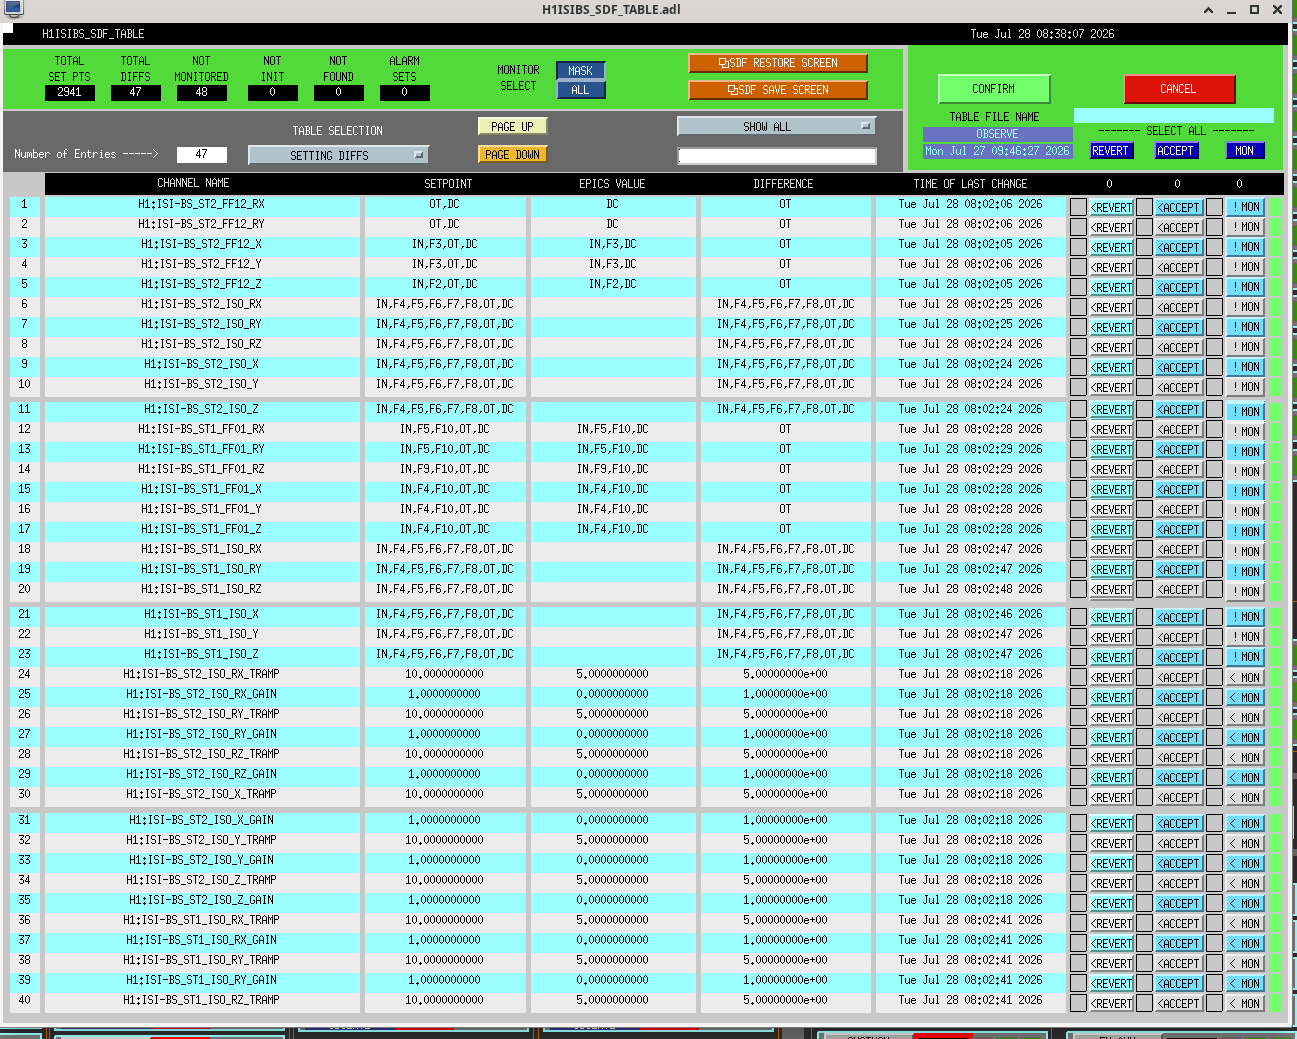
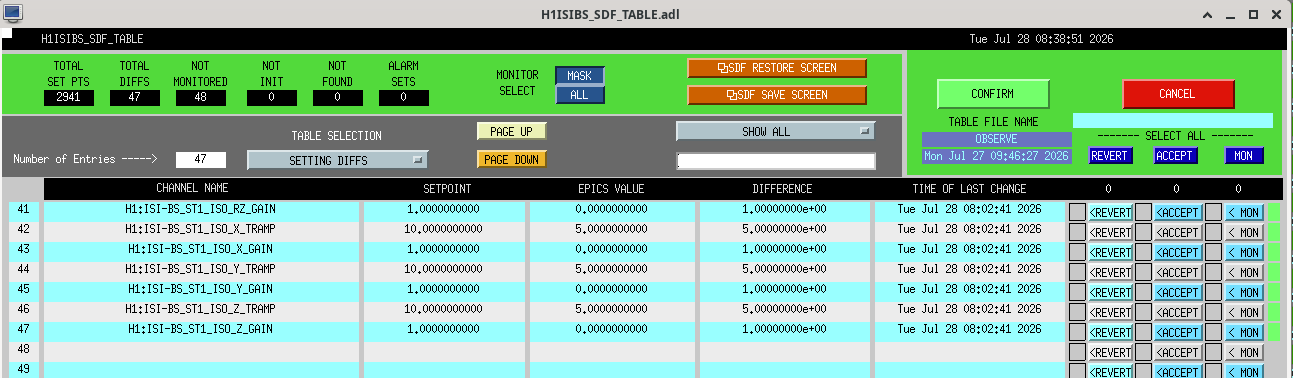
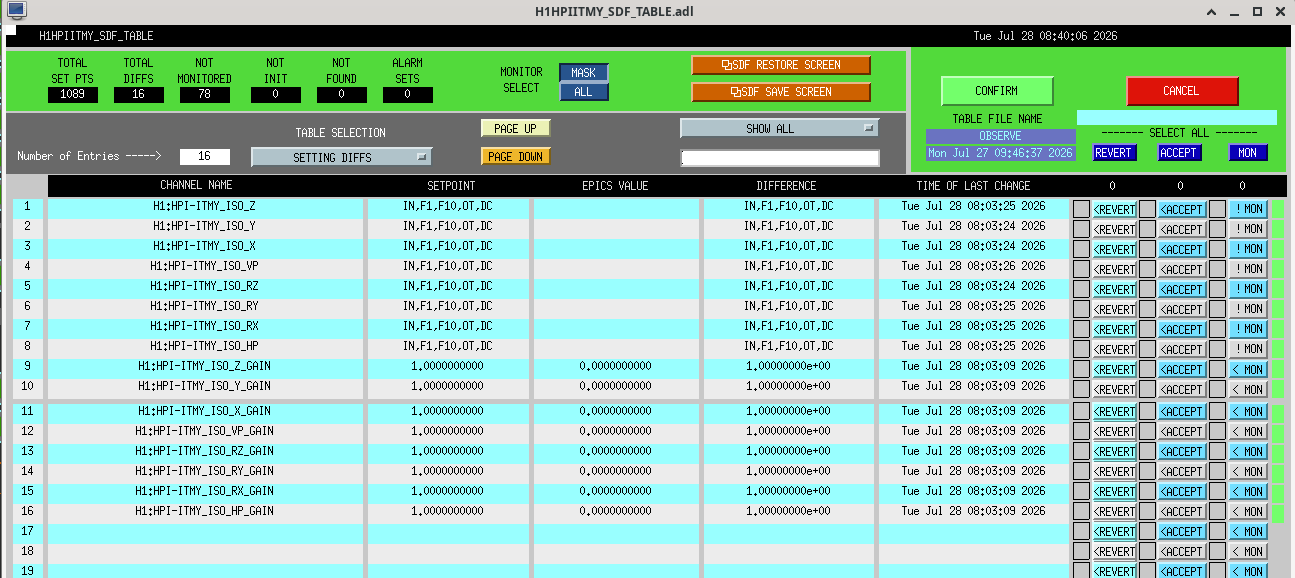
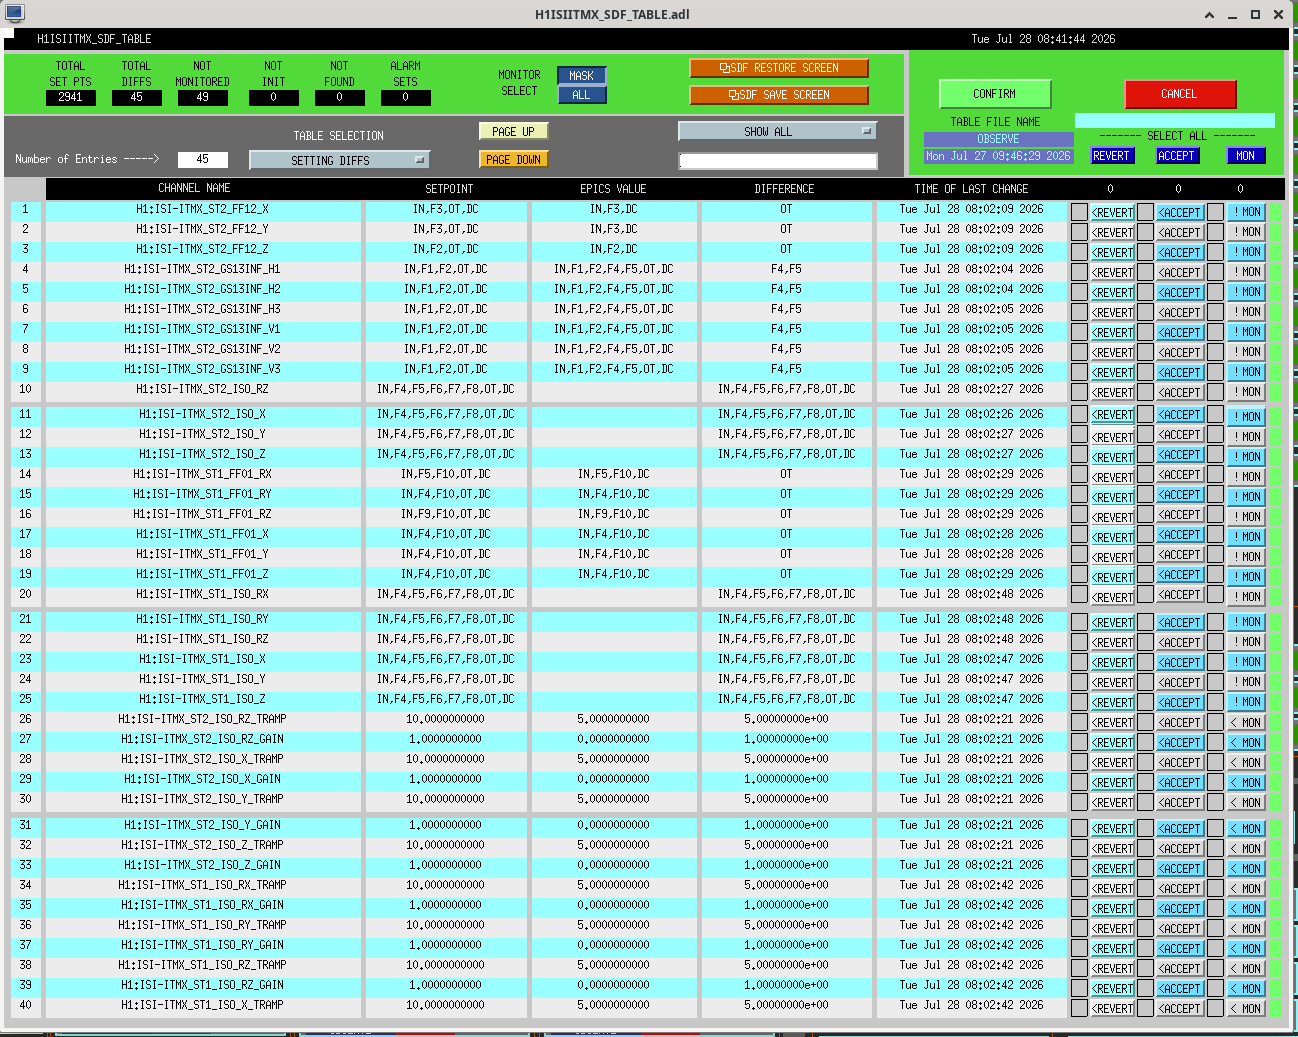

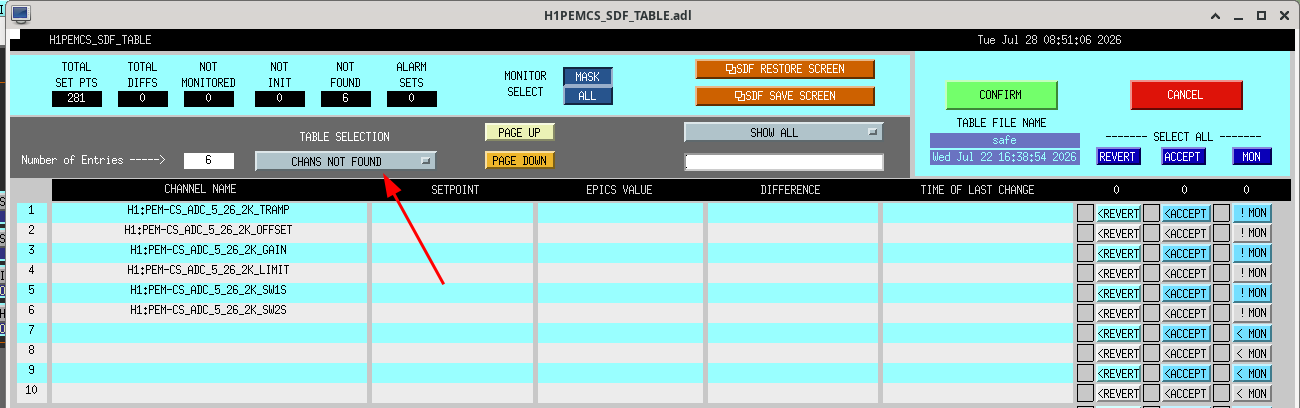
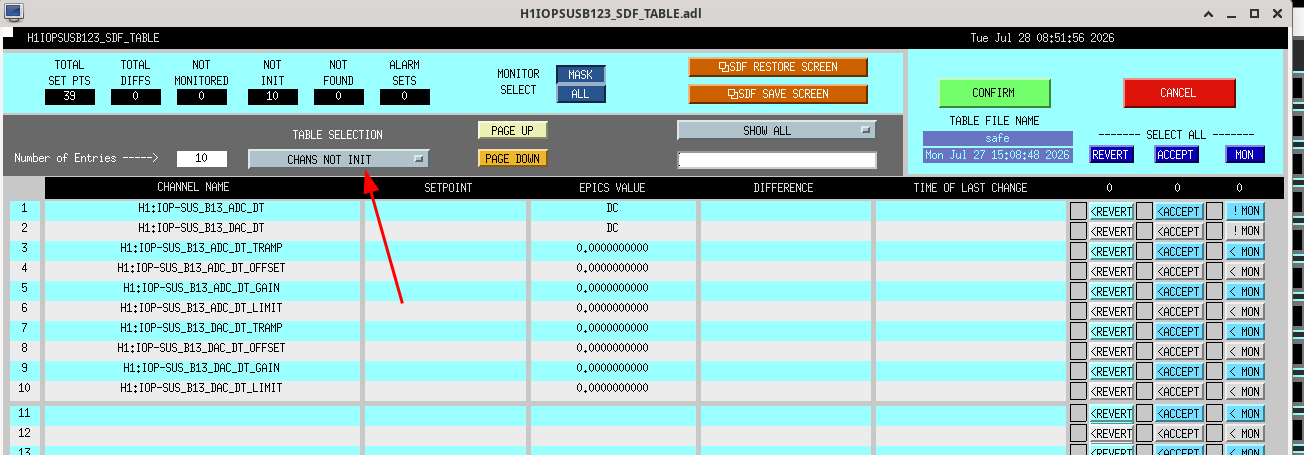
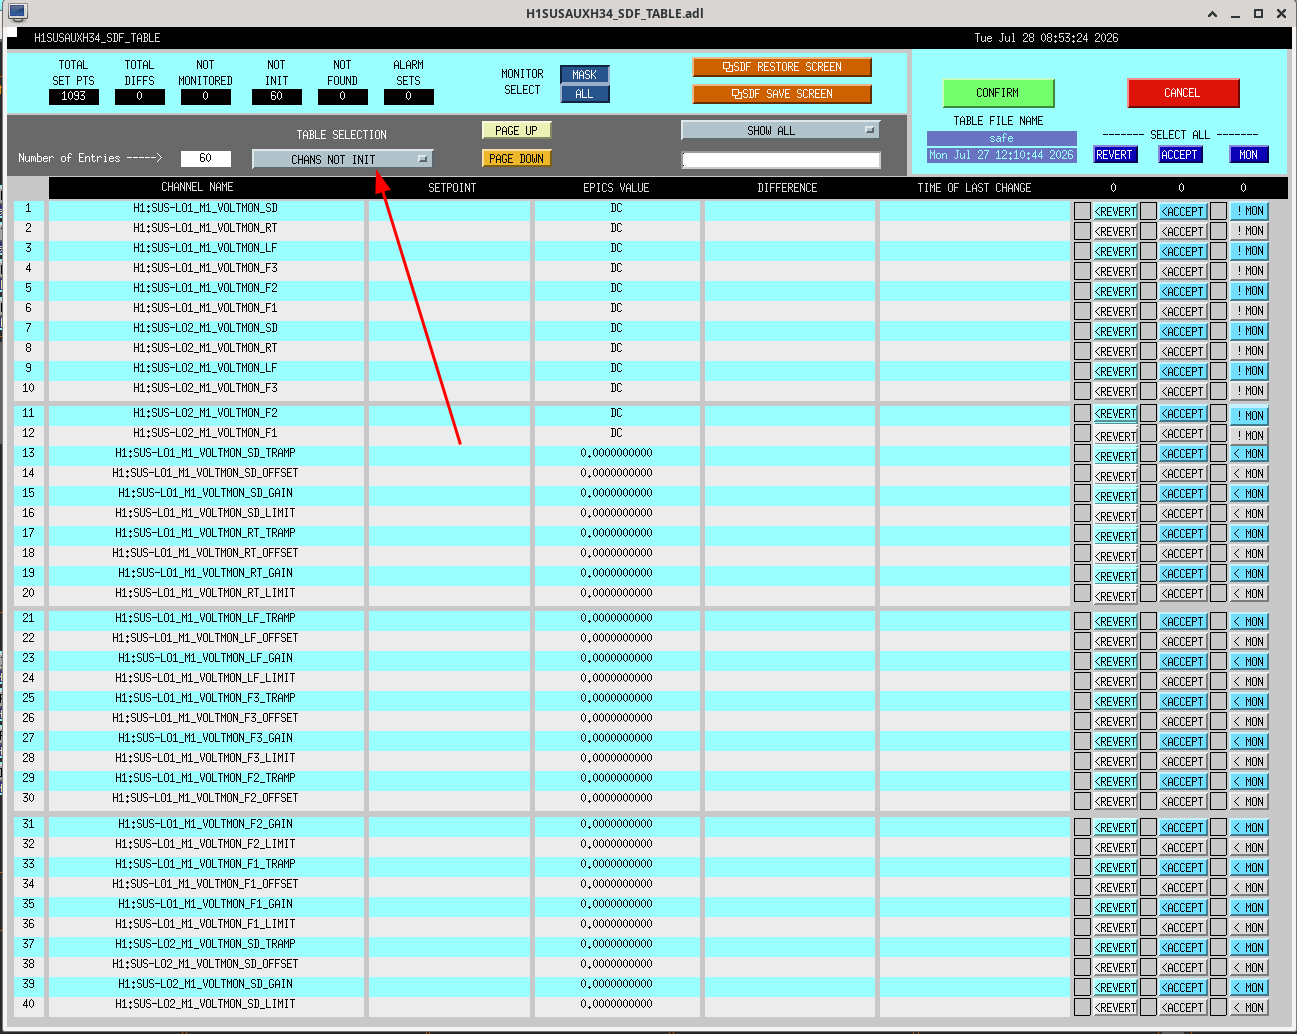
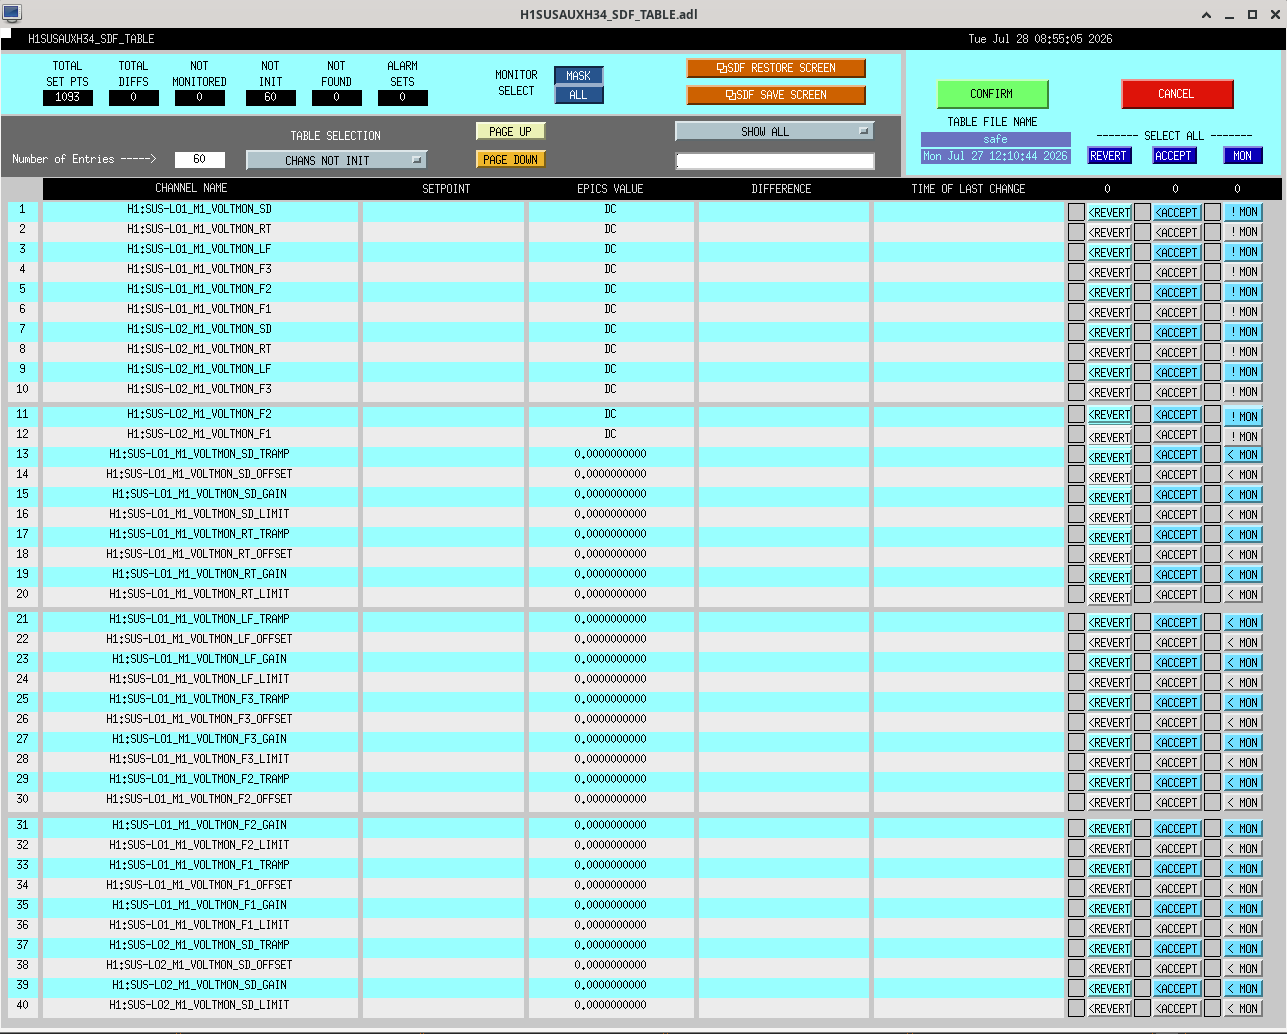
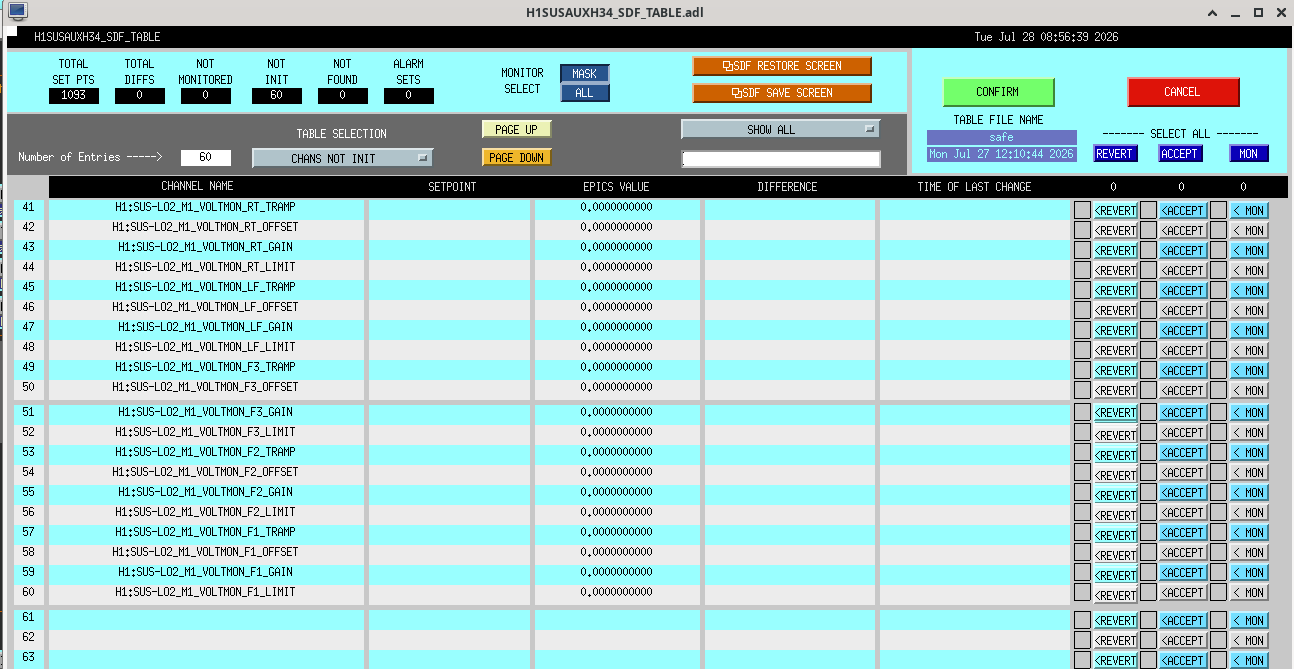
From what I can tell, I think we are mostly in a good spot for SDFs. The few items to note:
The two SDF screens we have are out of date. There have been many models added or names changed that we have not kept up with, and made this a bit harder. We will update these asap.
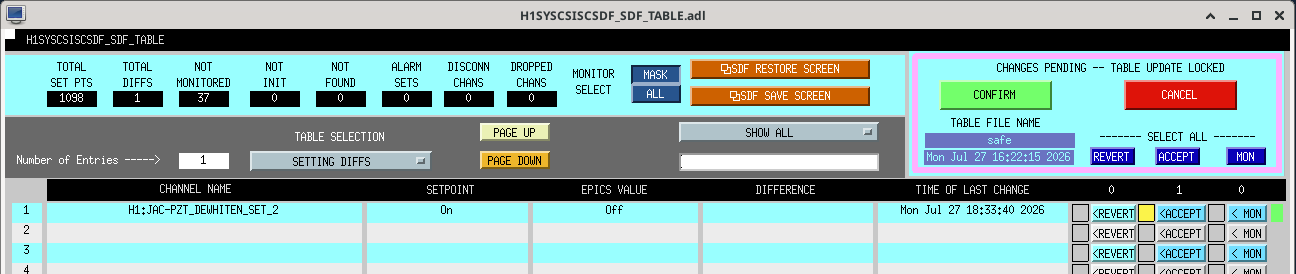
Jennie Wright, Khanh Vu

This morning, we entered the calculated values into the sensing matrices on the JAC menu. We encountered a few points of confusion that are worth mentioning:

1. The calculated matrix contains 16 values because it is a 4x4 matrix, with four possible angular actuator offsets and pitch and yaw readout channels from two wavefront sensors. However, the matrices on the JAC panel contain only eight inputs. This design assumes that, ideally, a yaw actuation produces only a yaw signal and a pitch actuation produces only a pitch signal. In practice, the system is not perfectly decoupled, so we observe cross-coupling between pitch and yaw, leaving us with more than eight matrix entries.

2. For the PZT actuator, the relationship between pitch and yaw is reversed. A pitch offset produces a signal in the yaw channel, while a yaw offset produces a signal in the pitch channel. This is due to the configuration of the optical components, and this convention has been maintained in the control system.

We will continue working on the sensing matrix on Monday to determine how to account for these issues.
Jennie Wright, Khanh Vu

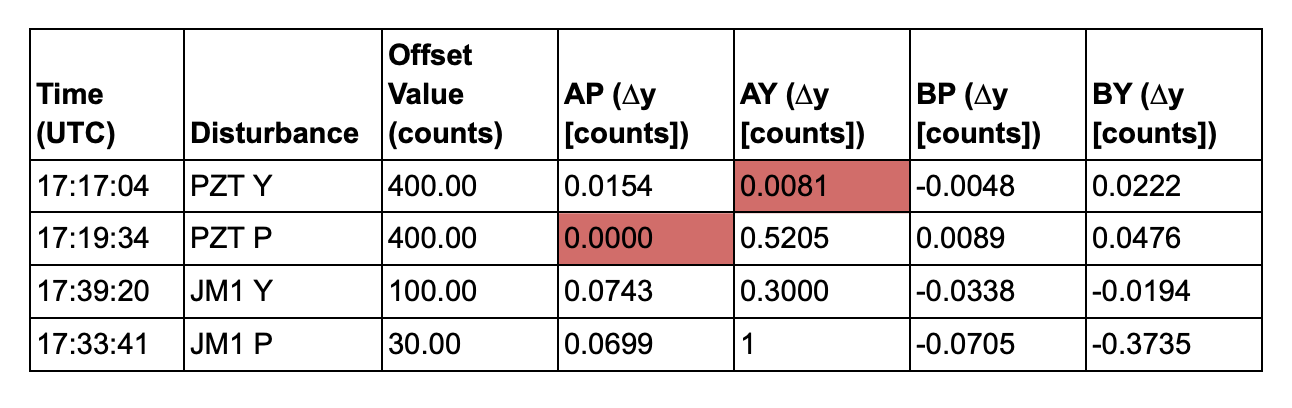
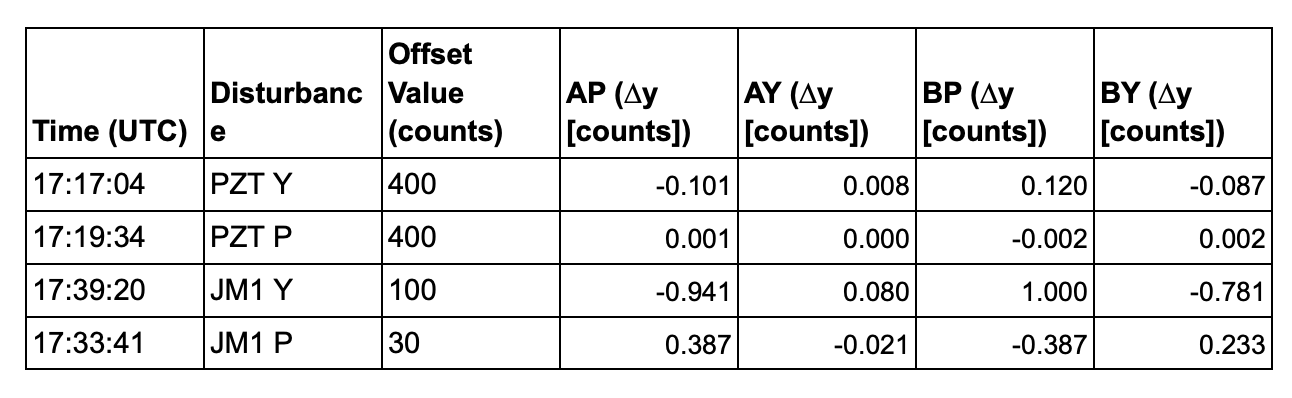
This morning, July 22, we measured the input matrix of the wavefront sensors using step responses applied to the PZT and JM1. The collected data are attached below.

We turned on the offsets of the PZT and JM1 for both pitch and yaw, adjusted each offset, and measured the corresponding responses in the pitch and yaw channels of wavefront sensors A and B. For PZT yaw and pitch, we increased the offset by 400. We used smaller increments of 100 for JM1 yaw and 30 for JM1 pitch. The JM1 lock filters contained integrators and were not enabled in the actuator path, so we used the test filters to introduce the disturbances. After each measurement, we returned the offset to its original value so that the measurements were applied evenly.

The collected data matrix is attached below. The two values highlighted in red were obtained from noisy data and therefore have high uncertainty. However, both values are very close to zero.

We then calculated the inverse matrix. Because the measurements were made using different offset values, we normalized the data by first dividing each response by its corresponding offset value and then dividing all values by the largest resulting value.
J. Kissel,

Executive Summary
We're continuing to debug issues seen with the IMC locking. One question that came up was whether we *can* confirm that all binary IO switching of the H1SUSMC2 M3 stage coil driver -- an *unmodified* Triple Acquisition Driver (see D0901047-v4) -- using the transfer functions between DAC output and the FASTIMON coil driver monitor circuits. And the real question they *want* answered is "is the BIO on the H1SUSMC2 M3 stage functioning normally, or is that broken and that's what's causing the issues with the IMC?"

The short answer: NO, one cannot confirm the ACQUIRE switching with confidence with any of these coil driver monitor circuits. The TACQ driver is one of those drivers where the monitor pick-offs span a complex switchable output impedance network rather than a simple resistor. As such, neither VMON or the FASTIMON can measure the response of that switchable output impedance network, since you're monitoring the voltage across it. Elenna's TF posted to LHO:91155, which has the TACQ driver frequency response correctly compensated, also shows that at least the analog state matches the digital compensation state.

BUT -- I'm 95% confident that both LP and ACQ filters the H1SUSMC2 BIO switching are working normally, and switching the analog coil driver state. This is based on some weak coil driver monitor transfer function evidence, looking at the BIO monitor readbacks for the M3 Stage, and two decades of experience looking at the function of these things.

DETAILS

Attached is the simplest cleanest demonstration of the *lack* of visibility of the Acquire Filter:
    - Excite the transfer function from the DRIVEALIGN L2L filter bank, so you can send excitation to all four coils at once. Make sure there's no filters on, and the gain is set to 1.0.
    - Change the M3 EUL2OSEM matrix to have the L to UL, LL, UR, LR coefficients from 0.25 to 1.0.
    - Use the 'secret' state feature of the binary IO control, to switch the coil driver state to negative; i.e. State 1 = -1, State 2 = -2, State 3 = -3, and State 4 = -4.
    - This allows you to Turn OFF all coil driver frequency response compensation filters. Do so, turn them off, so that you're actually exposing the what frequency response of the coil driver you can measure.
Templates of the excitations can be found in
    /ligo/svncommon/SusSVN/sus/trunk/HSTS/H1/MC2/SAGM3/Data/
        2026-07-21_H1SUSMC2_M3_L_to_FASTIMON_NoCompensation_tfs.xml
        2026-07-21_H1SUSMC2_M3_L_to_VOLTMON_NoCompensation_tfs.xml

One can see in this "clean" version of the fast-imon TF 1st attachment. One only really sees the response change when the low-pass filter is turned ON vs. OFF. One might argue that there *is* a little change between STATE 1 and STATE2 (turning the Acquire filter ON, bypassing R14), but this is dirt coupling; we expect the zero:pole response to change from (9:82) Hz pair to a (1:46) Hz pair.

My justification that "it's a real change, even though it's dirty," and that the FASTIMON does show that the switch is working -- if I take the same transfer function to the voltmon circuit, 2nd Attachment (which measures the voltage across a single resistor, but *upstream* of the acquire network), one sees no change at all between STATE1 and STATE2. Said differently -- because we *do* see a change in the FASTIMON TF between STATE 1 and STATE 2, albeit not the real TF change which we know we shouldn't be able to see, but still -- a change -- is weak proof that the acquire filter is changing, and the BIO is functional.

Remember:
 - From LLO:4495, for an unmodified TACQ Driver, we expect the poles and zeros to be changing as follows:
        State         Switch State                       Freq. Resp            DC Transconductance
                       ACQ  |  LP                          (z):(p) [Hz]             [mA/V]
        STATE 1        OFF  |  OFF                         (9):(82)                   0.33
        STATE 2        ON   |  OFF                      (1.05):(46)                    |
        STATE 3        OFF  |  ON                    (9 11 21):(1 82 210)              |
        STATE 4        ON   |  ON                 (1.05 11 21):(1 46 210)              V

 - For bode plots of the frequency response of all these TACQ driver states, and the difference between a *unmodified* vs. *modified* TACQ driver see L1200226.

 - For an info-graphical representation of the state of the digital compensation w.r.t. the analog filter state, see StateMachineDiagrams_TripAcqDriver-v7.pdf from T1100507.

 - In general, none of the SUS coil driver circuit drawings, nor the SUS coil driver monitor circuit drawings show the complete monitor circuit, so it's difficult at best to parse the total circuit system to understand the calibration. Instead, go to CoilDriverMonitorMath_CurrentMonitor.pdf posted as an other file to D070480-v2 for a complete picture of the monitor system, from which you can derive the math. I summarize it here:
   From the second page of that math, you can see that the transfer function between the Fast IMON circuit output voltage, V_IMON can be calibrated into current across the coil, I_coil by the following transfer function:
       V_IMON                 R25         2
      -------- =  2 * Z_out * ---      = --- * Z_out
       I_coil                 R24         3
where,
     . as part of the design principle, R25 = R35, and R24 = R27 = R29 = R33, and for the D070480-v2 circuit, R25 = 10e3 [Ohm] and R24 = 30e3 [Ohm], hence, R1/R2 = 1/3, and
     . Z_out, in the case of the TACQ driver is the entire complex switchable impedance network.

 - The list of HSTS with modified vs. unmodified TACQ drivers on their lower stages: LHO:32021

 - There *are* modified "narrow-band" coil driver monitor circuits out there, but they're only in PRM M2 and M3, and PR3 M3; LHO:72837


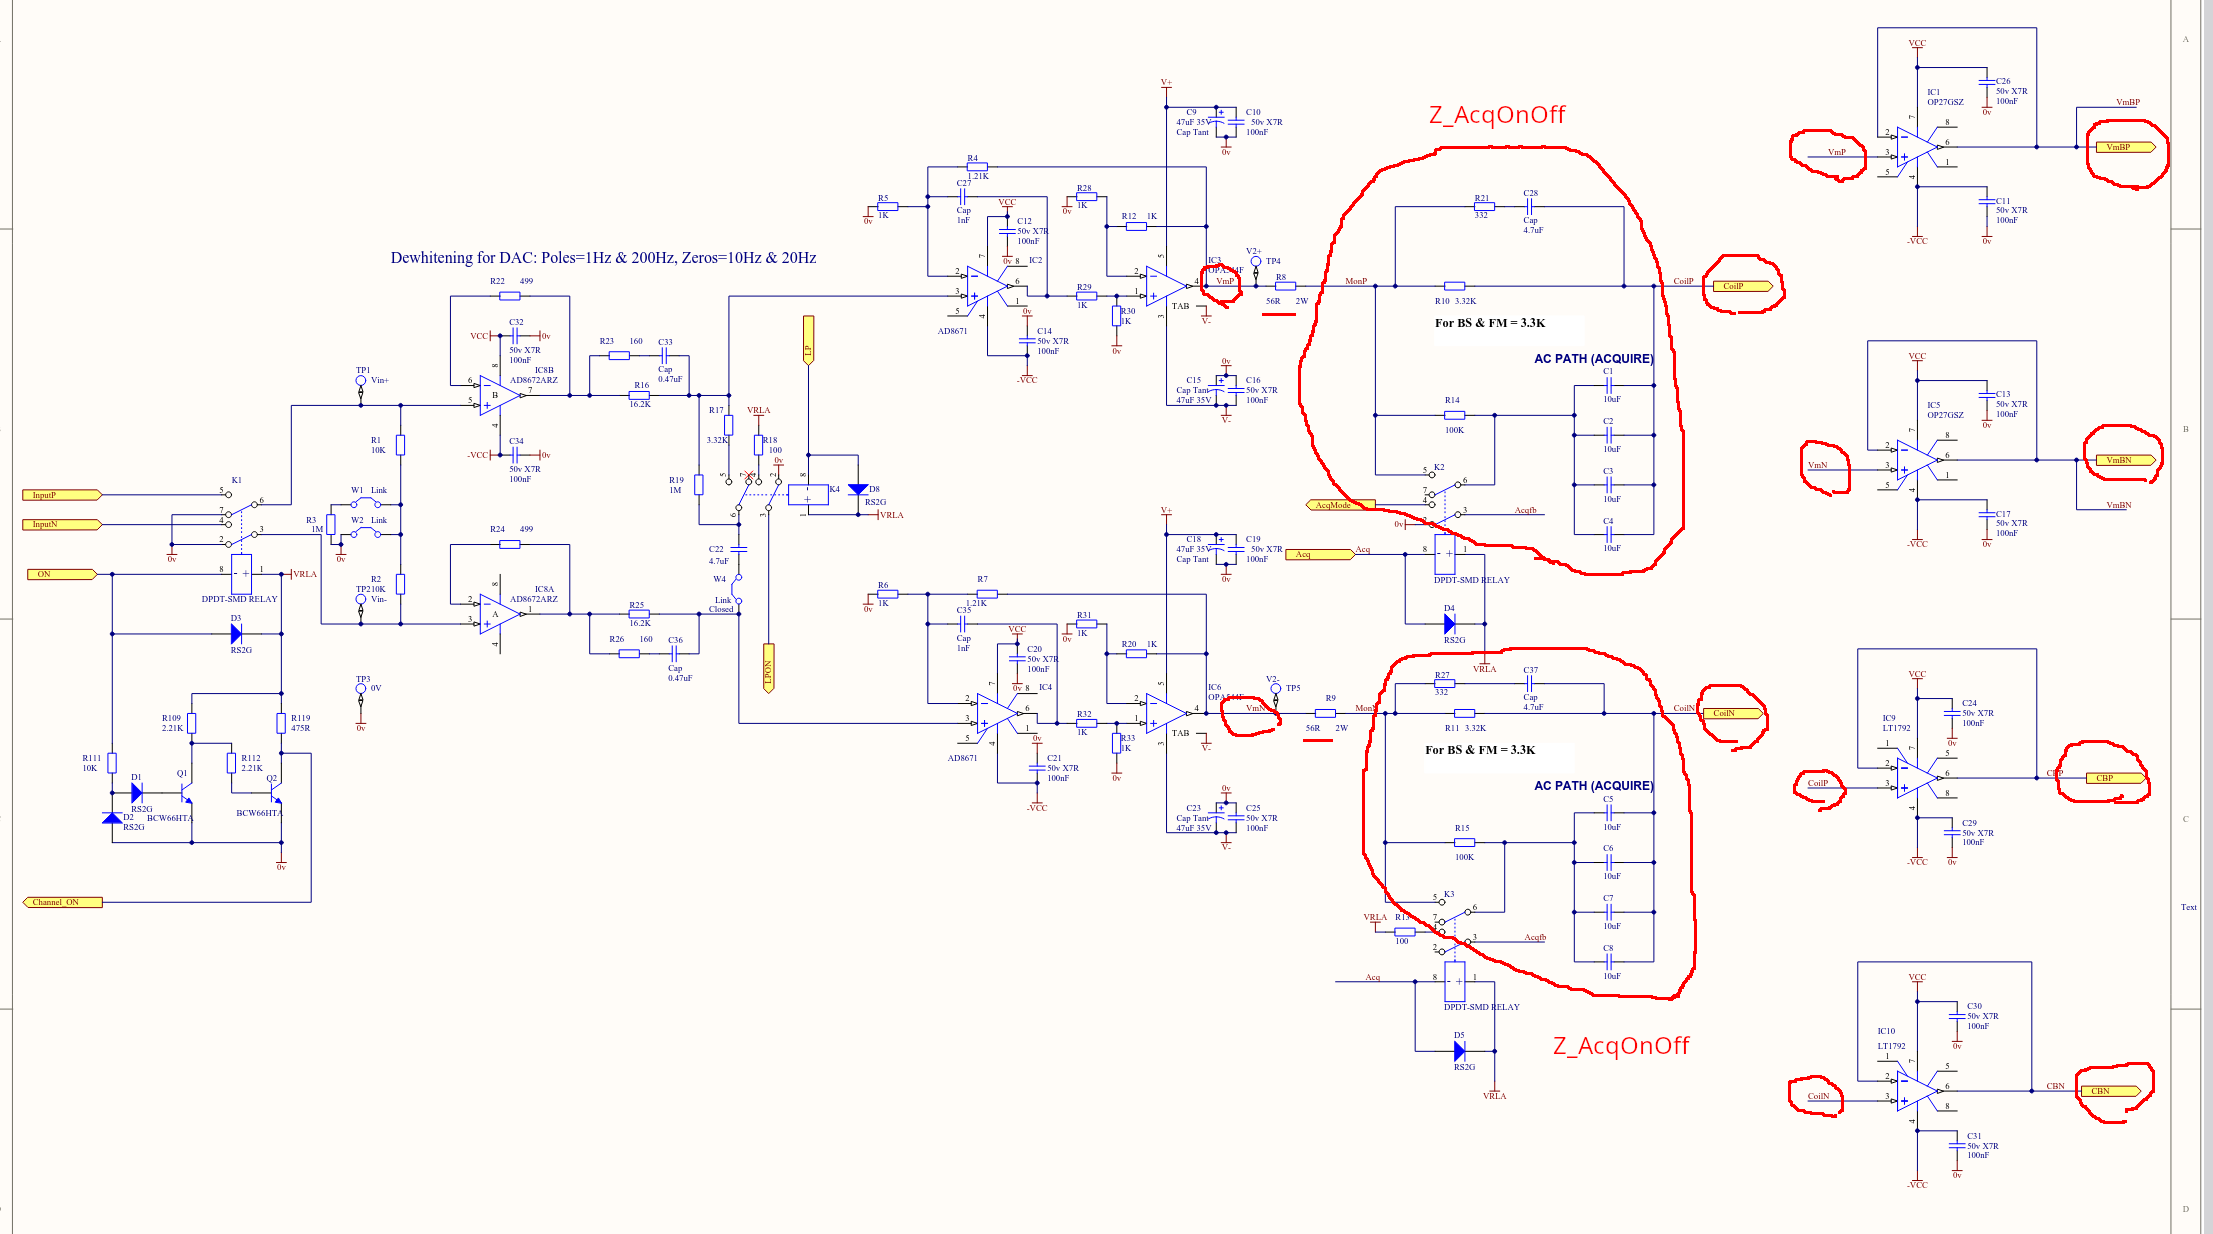
There seems to be no reason that FAST_IMON TF doesn't change in your measurement when acq mode is switched ON/OFF if FAST_IMON is just CBP-CBN scaled with a real factor in https://dcc.ligo.org/DocDB/0002/D0901047/004/Triple%20Acquisition.pdf. Is it?
Coil_current = (CBP-CBN)/Z_coil = (VmBP-VmBN)/(Z_coil+2*56+2*Z_AcqOnOff)
therefore
CBP-CBN = (VmBP-VmBN)*Z_COIL/(Z_coil+2*56+2*Z_AcqOnOff)
where Z_coil is the impedance of the coil and the cable combined, 2*56 is the resistance of R8 and R9 combined and 2*Z_AcqOnOff represents the impedance of the RC network used for Acq ON or OFF combined (there's one Z_AcqOnOff in the CBP path and another in the CBN path).
When you switch the LPF on or off, VmBP-VmBN changes.
When you switch the Acquire mode on or off, Z_AcqOnOff changes.
Either way, if CBP-CBN is used as FAST_IMON, TF from drivealign L2L to FAST_IMON (measured when all digital compensation filters are off) should change according to acq on/off as well as LPF on/off change.
CamillaC, CoreyG, RyanS (locked up the IMC at low power for us, with help from Sheila & JennieW)
For reference, see the following alogs & DCC page: alog61866, alog17788, D1201430
Initial delay to this work was trying to get low power (250mW) from the IMC for a beam to use for this check. However, we now have JAC, so this added some complications for low-power locking; additionally, IMC locking is still fairly new & fresh post-recent-vent-work.
Once we had a nice beam to work with we went out to HAM2. Before we went upstairs, we grabbed an IR card, lexan plate (from the standard guillotine), and a CDS laptop. This time around we don't have the scaffolding at HAM2's West Side, so we decided to climb up from the East Side since we had several blank flange ports to use for hand/foot holds. For each climb, we stepped on the steel platform above the HEPI cage (but this still would break IMC lock...but it came back fast). Did NOT use fall protection since there is a handrail right where we would be working atop HAM2.
Steps For The Check:
Below are photos from this activity along with "before" photos of beams as we found them. Camilla will alog the "after" photos of how the beam looked after some PRM tweaks.
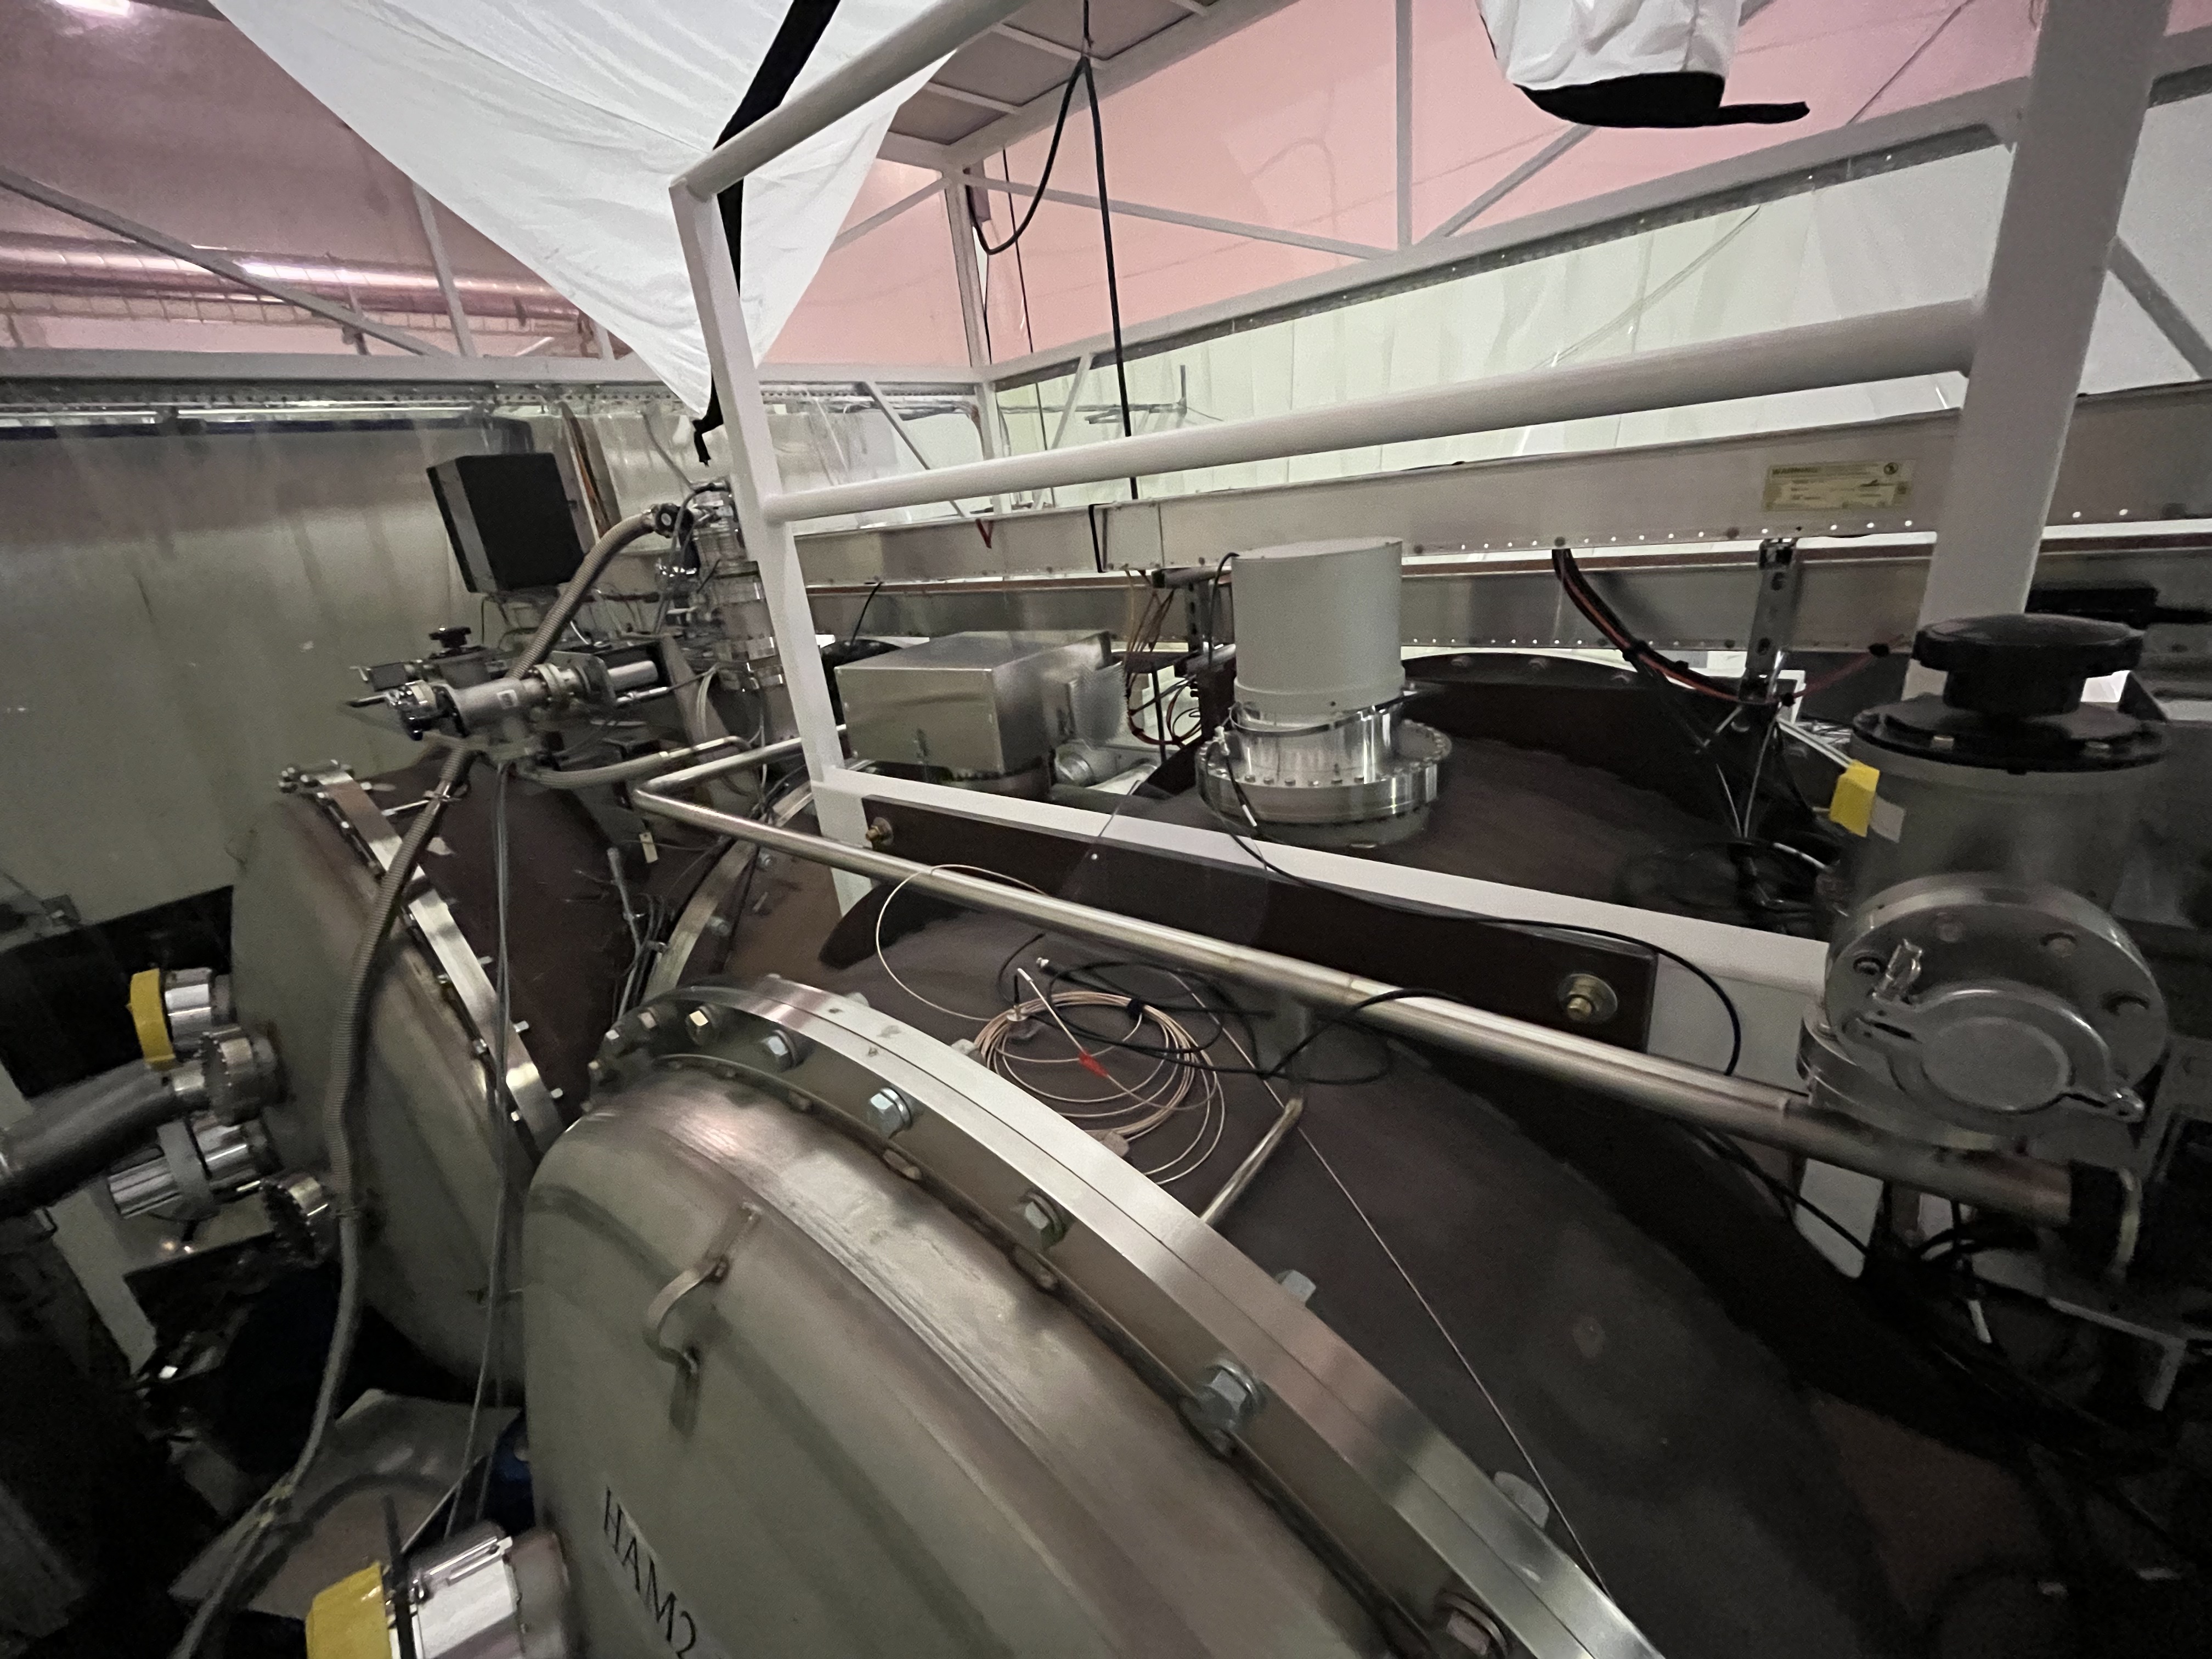
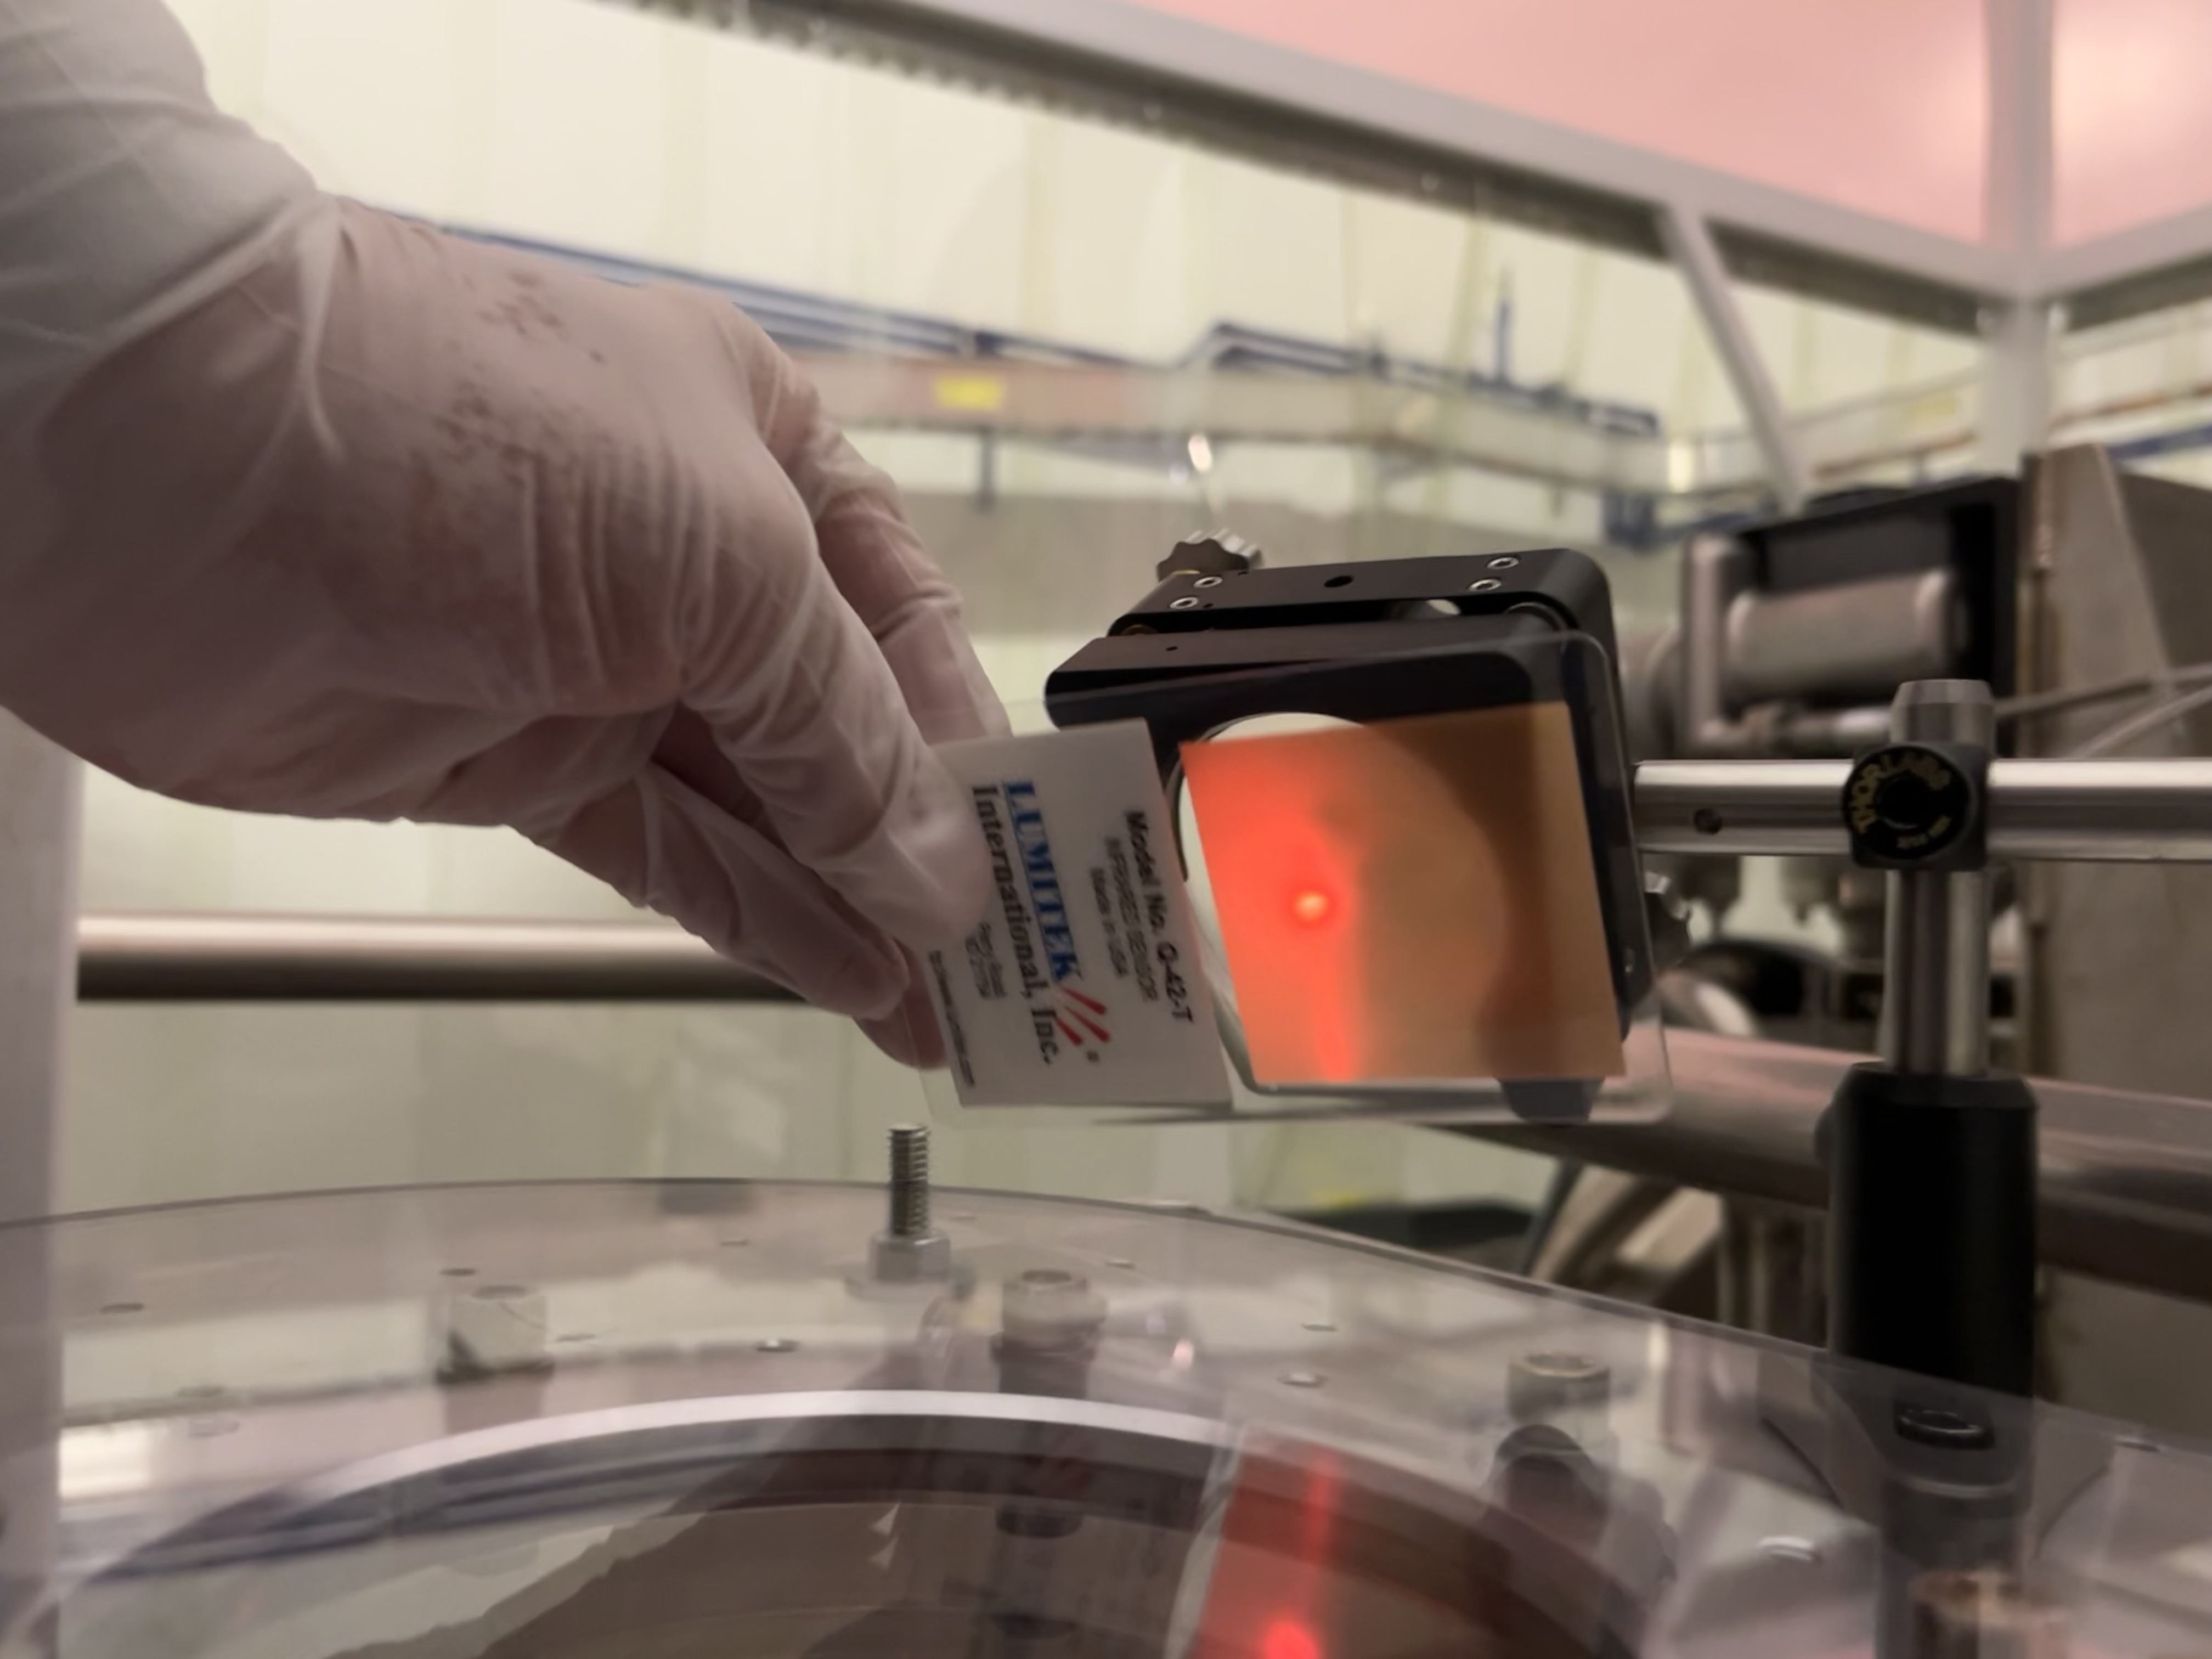
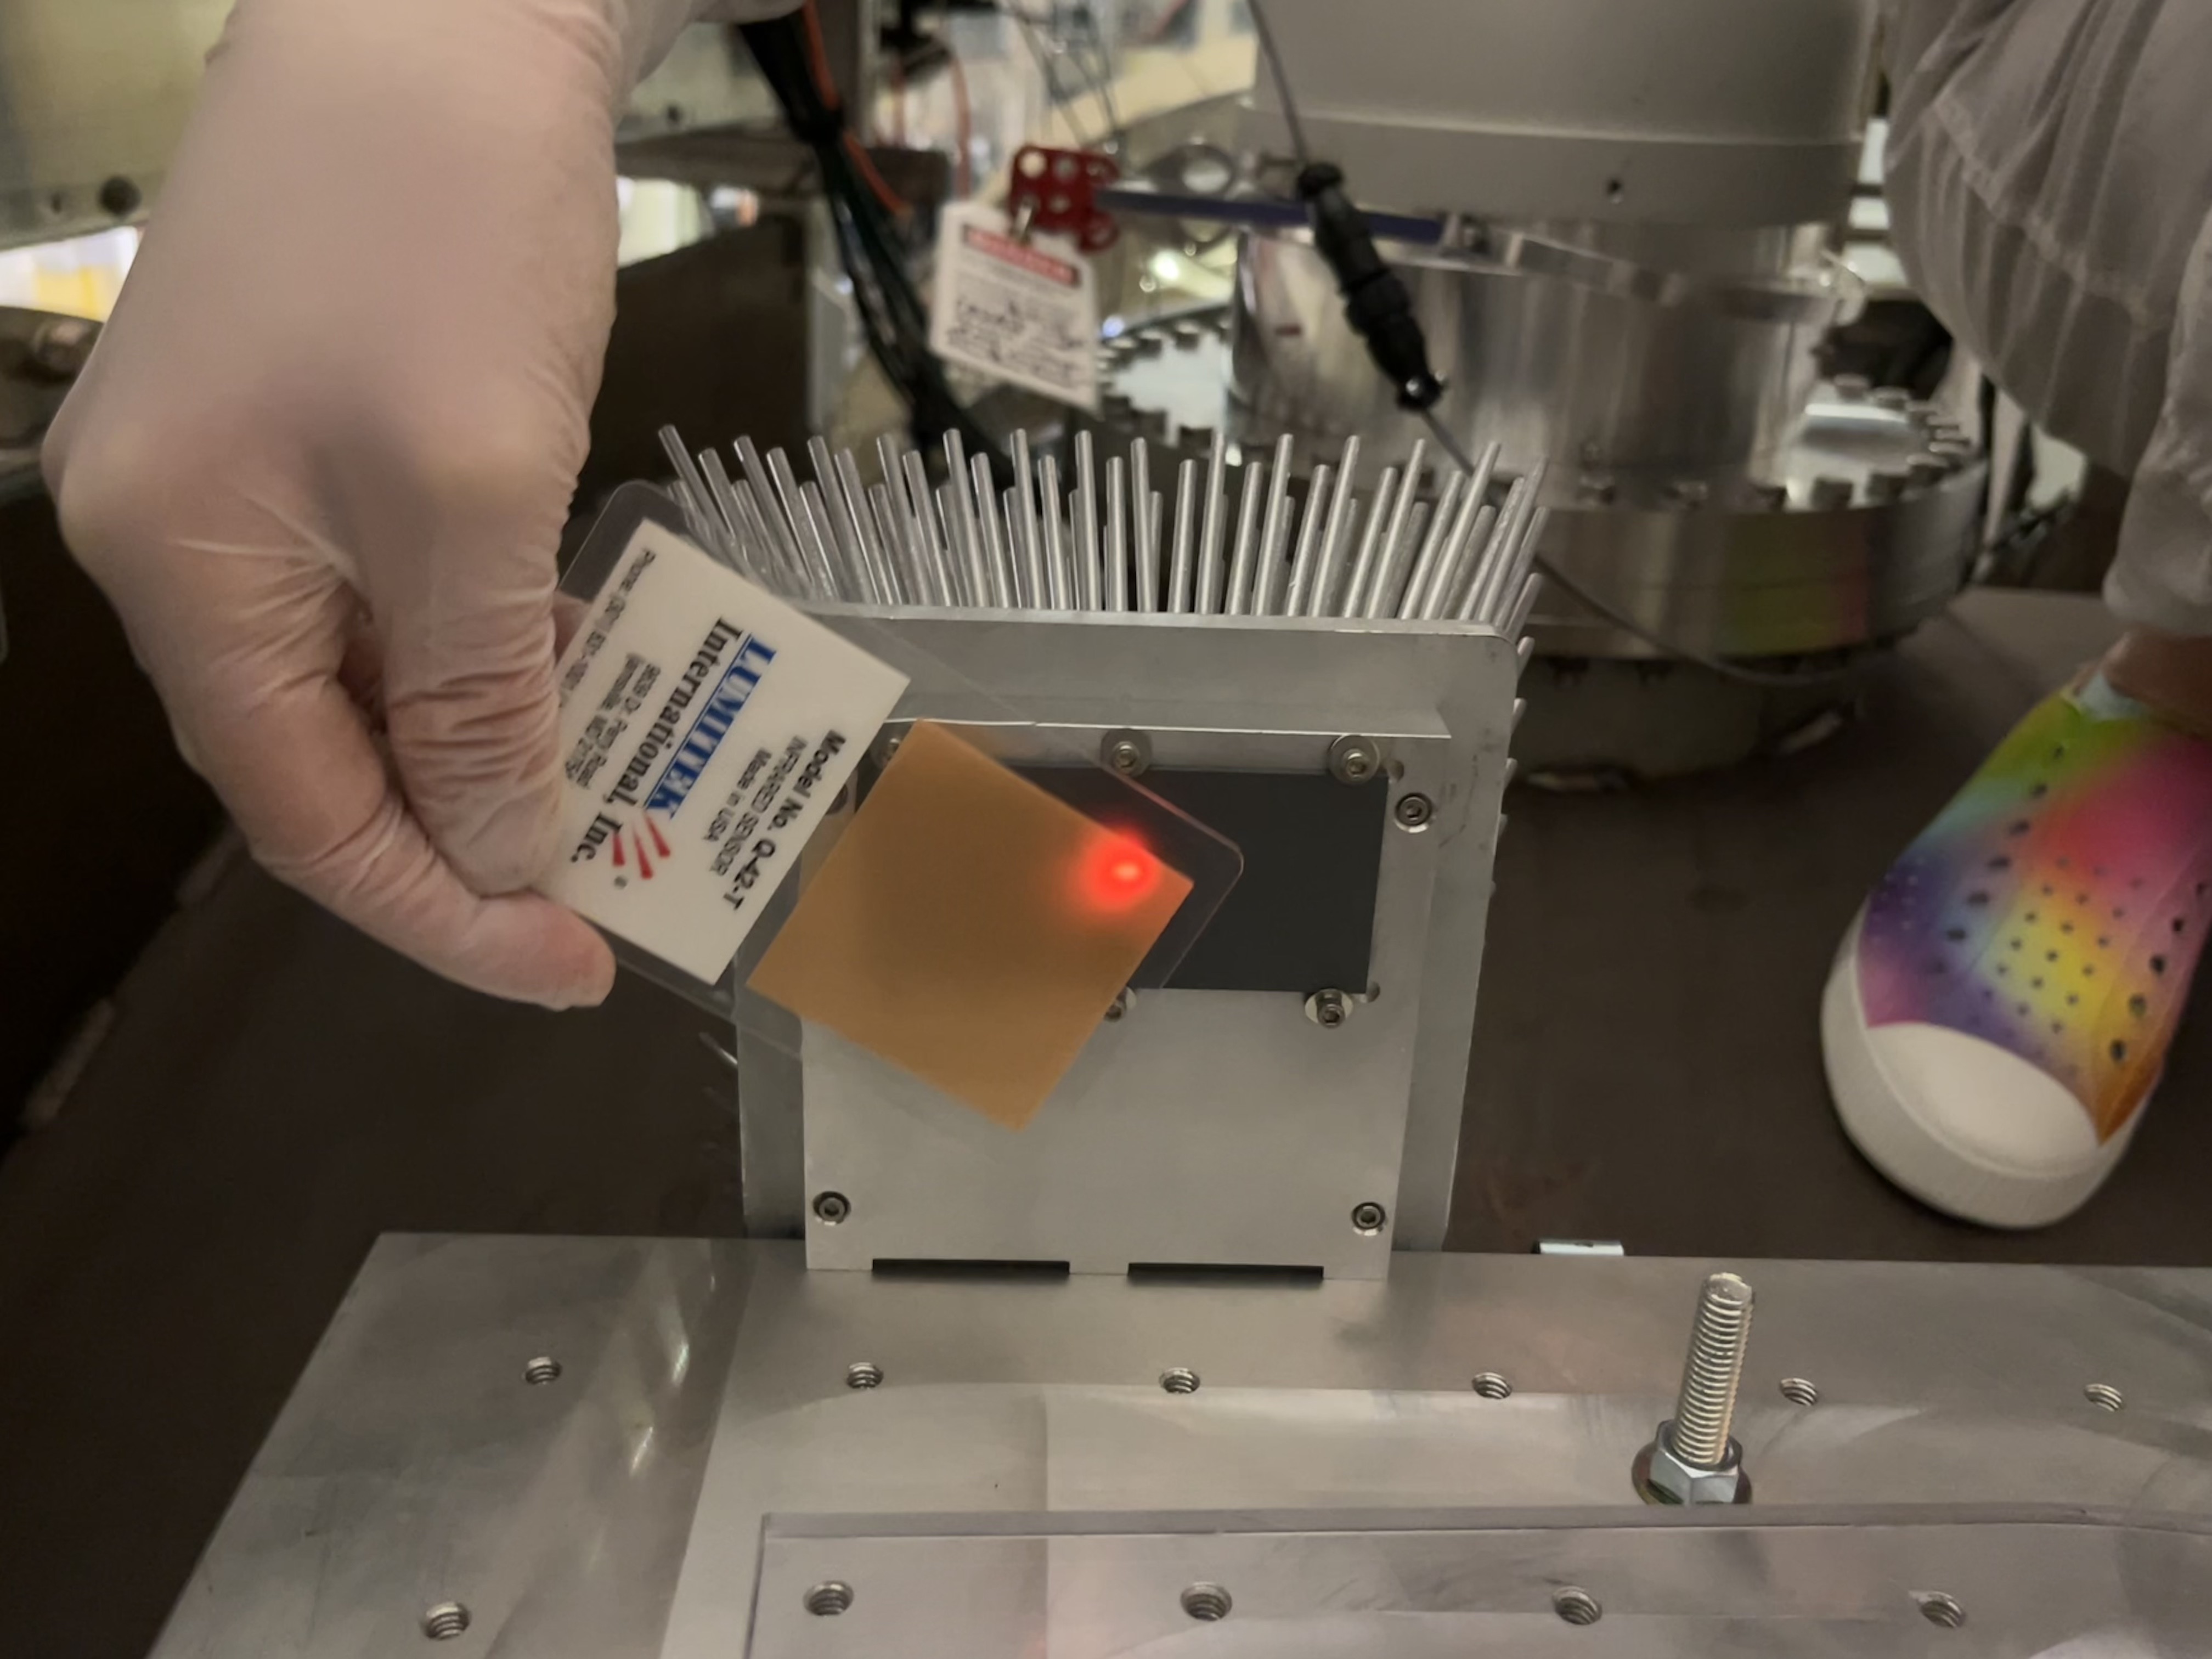
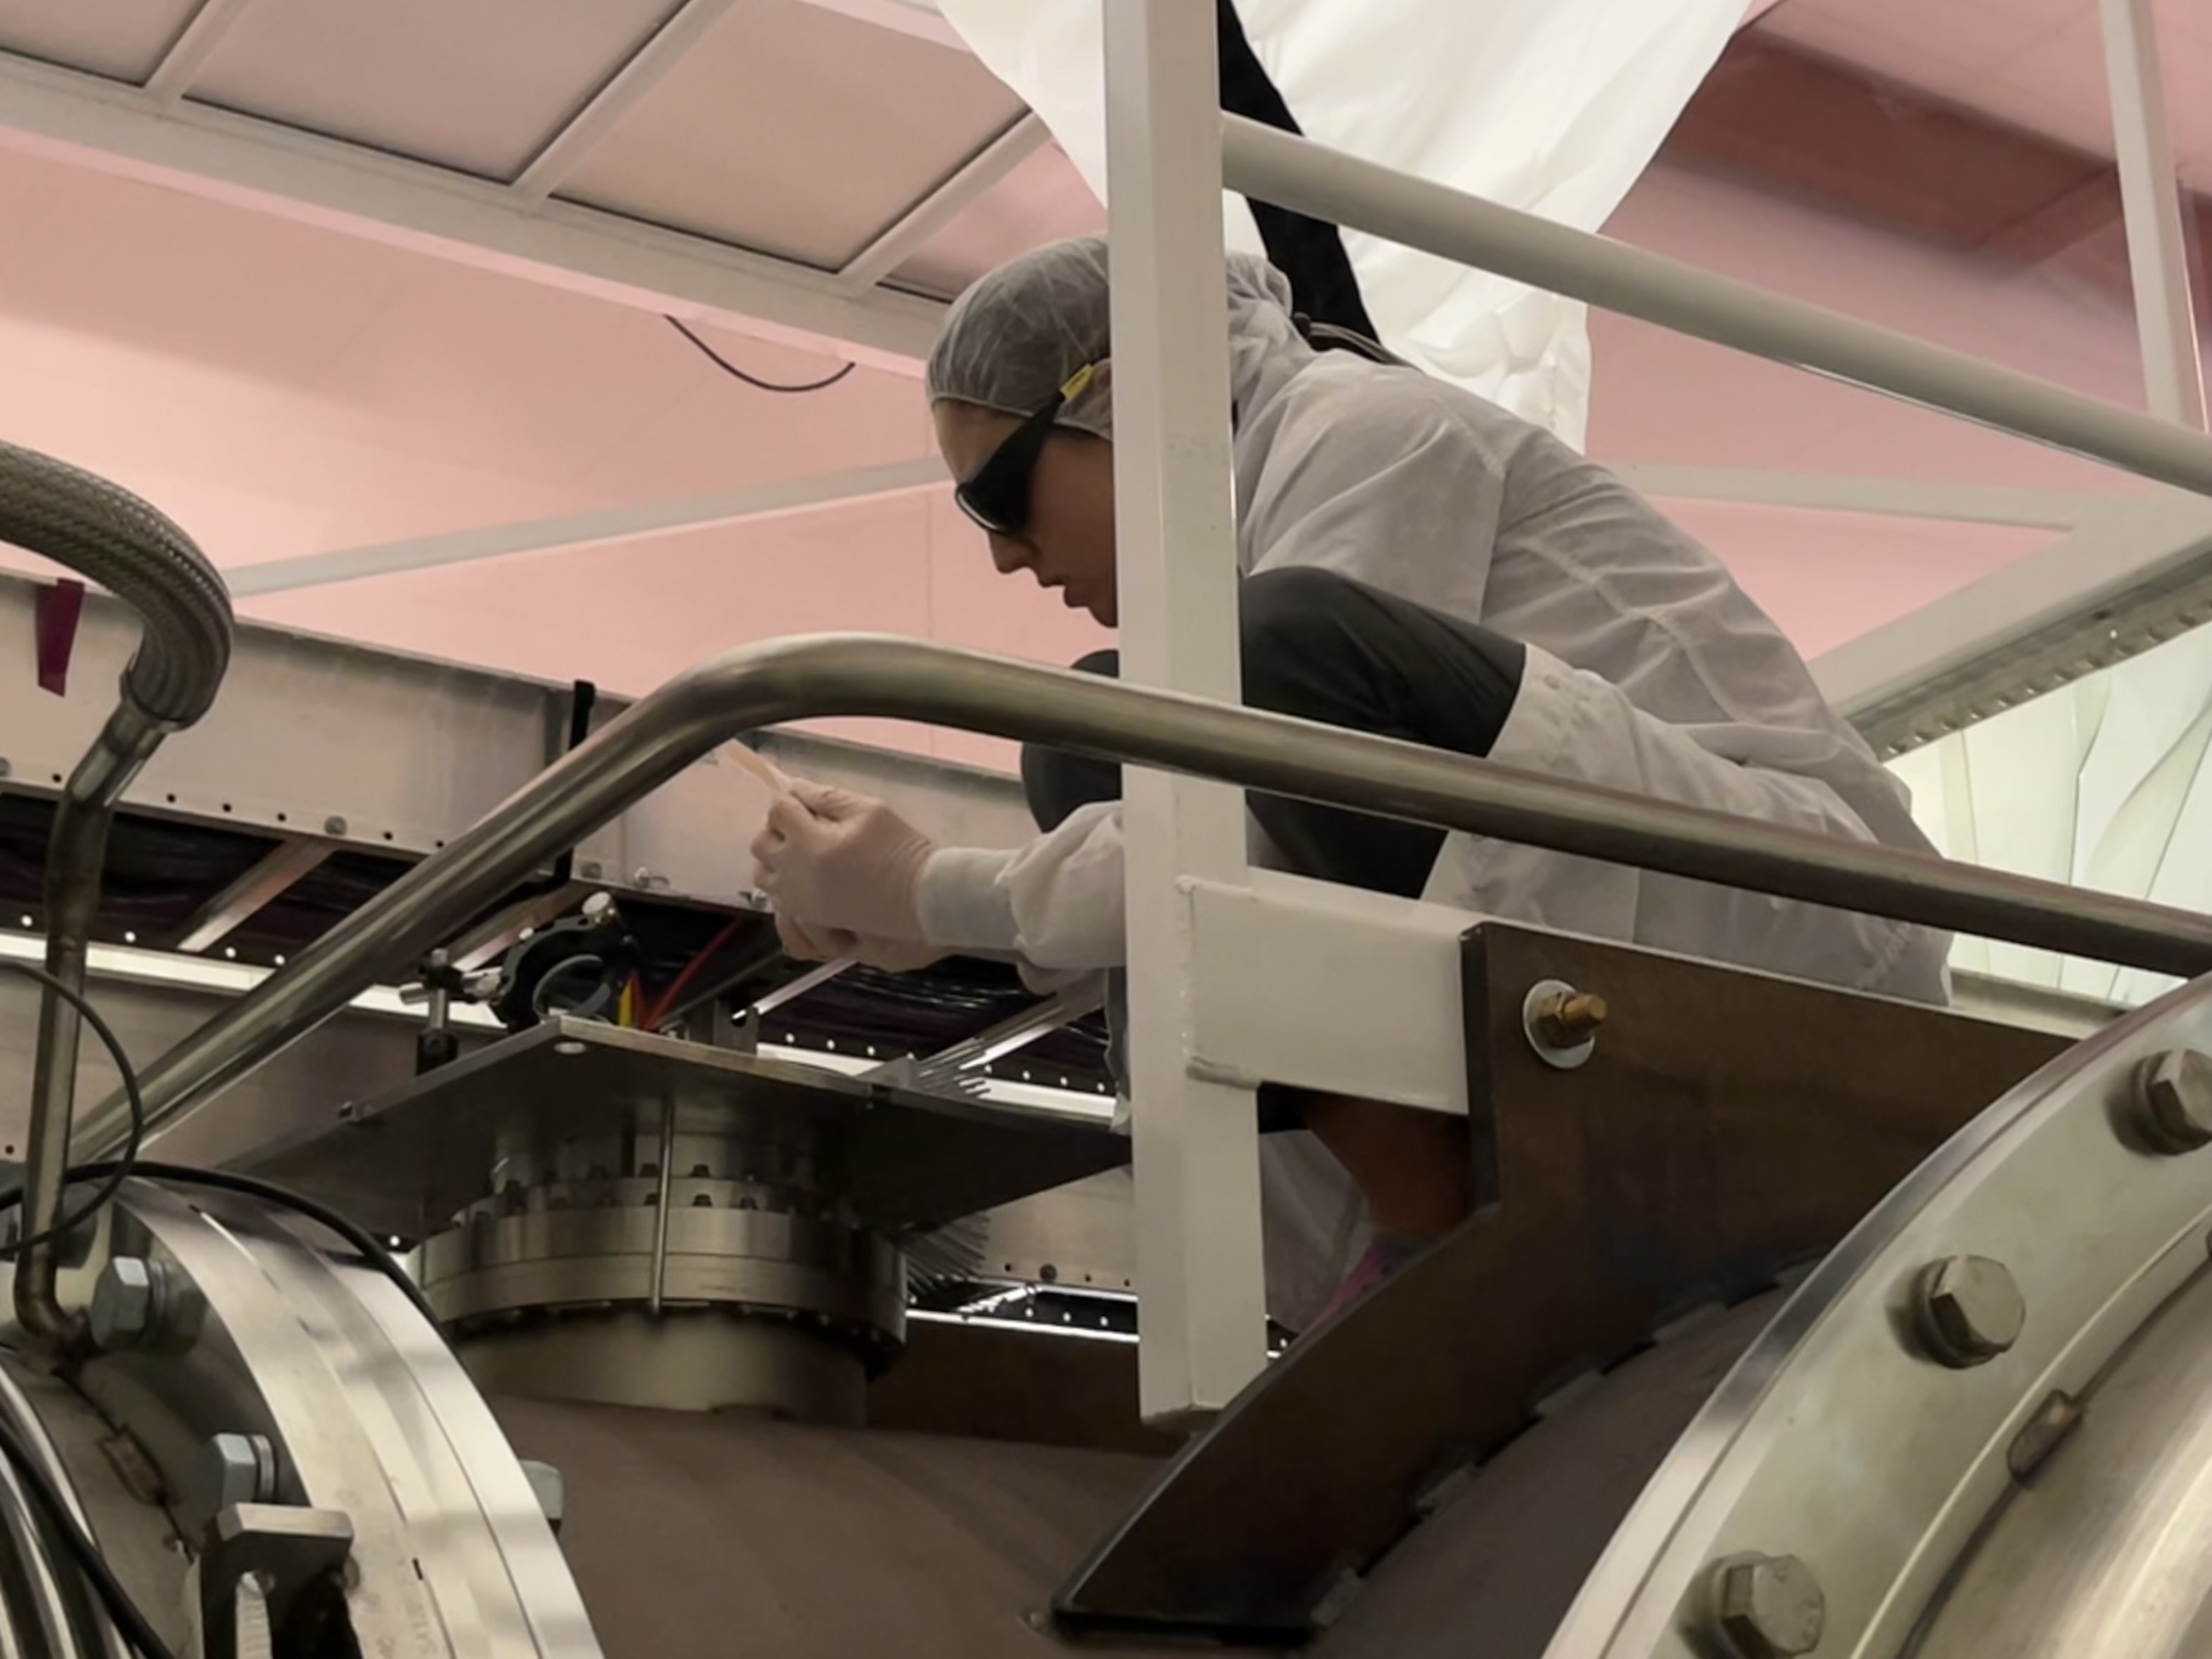
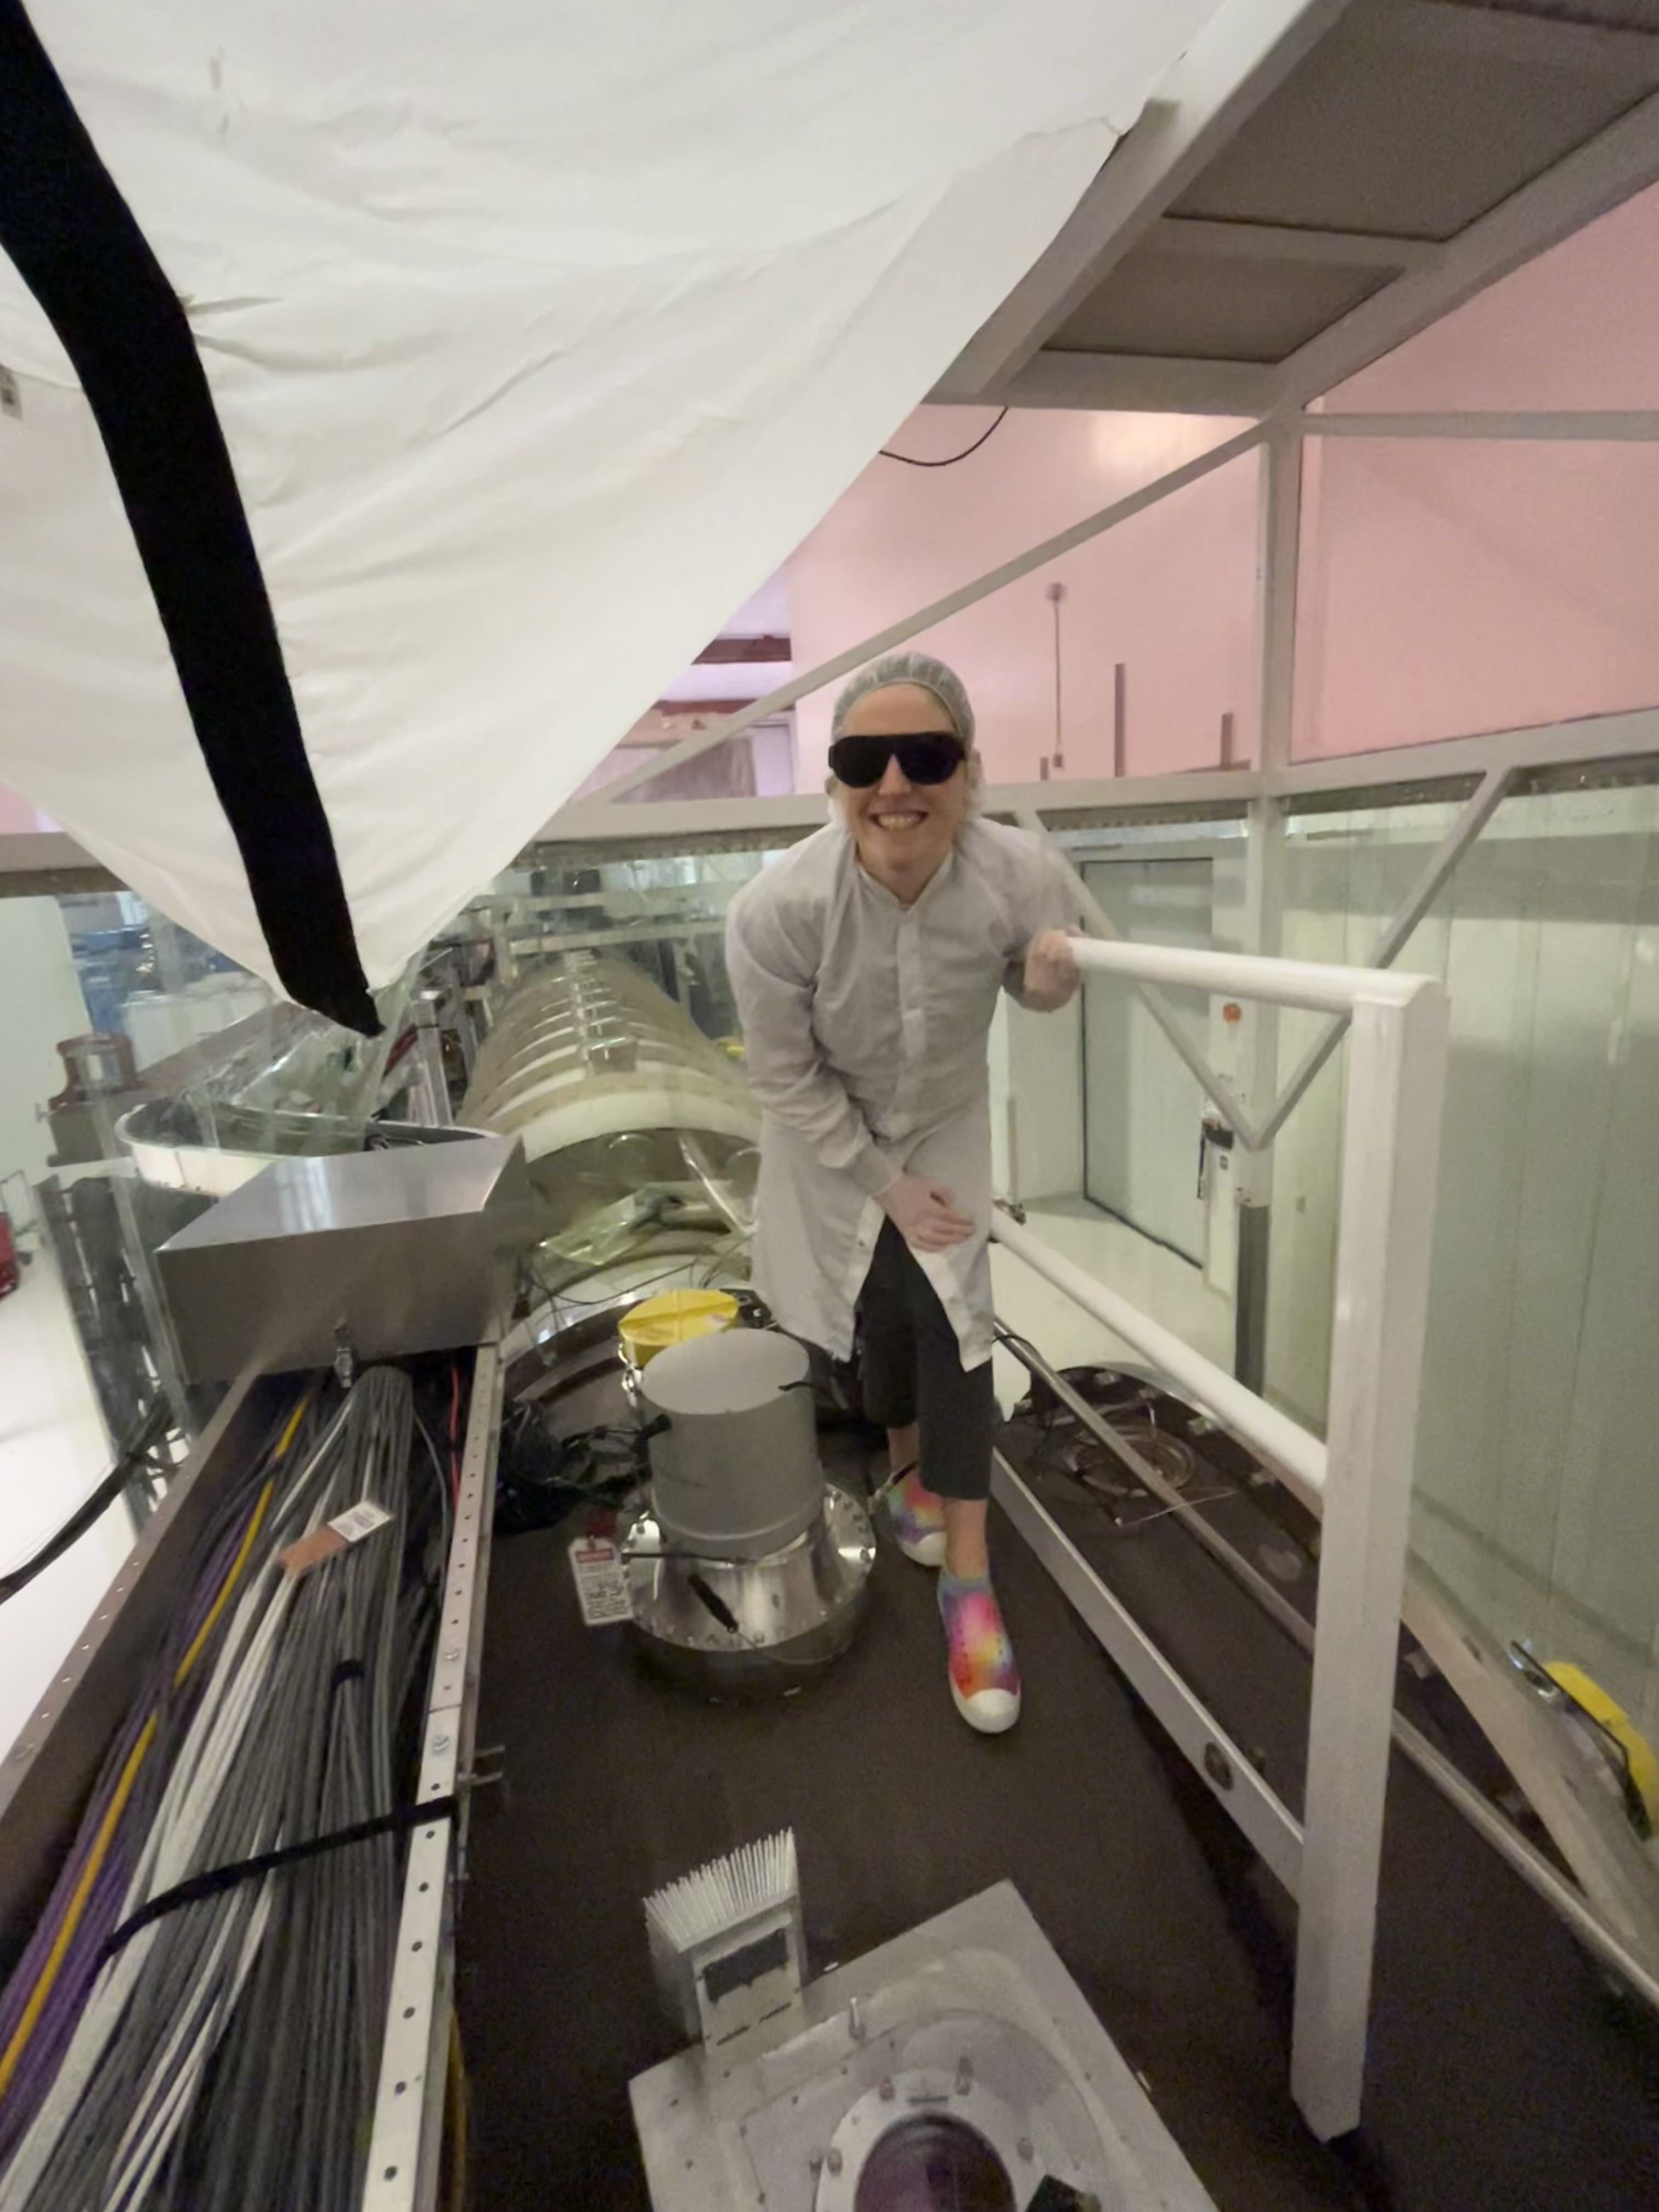
Attached are photos of the beam as we left it on the steering mirror and beamdump.
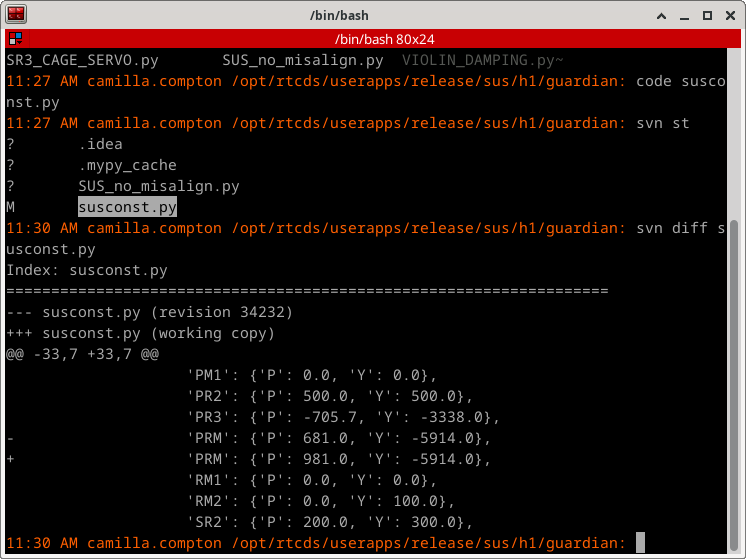
We moved the PRM alignment sliders +500urad in Pitch to get the beam unclipped looking. This was saved as an addition to the misalignment values in sus/h1/guardian/susconst.py, see attached. We then reloaded SUS_PRM and checked when taking it t misaligned that the top mass osems when to the location we expected.
During this work PRM alignment sliders nominal was Pitch -1115, Yaw -270
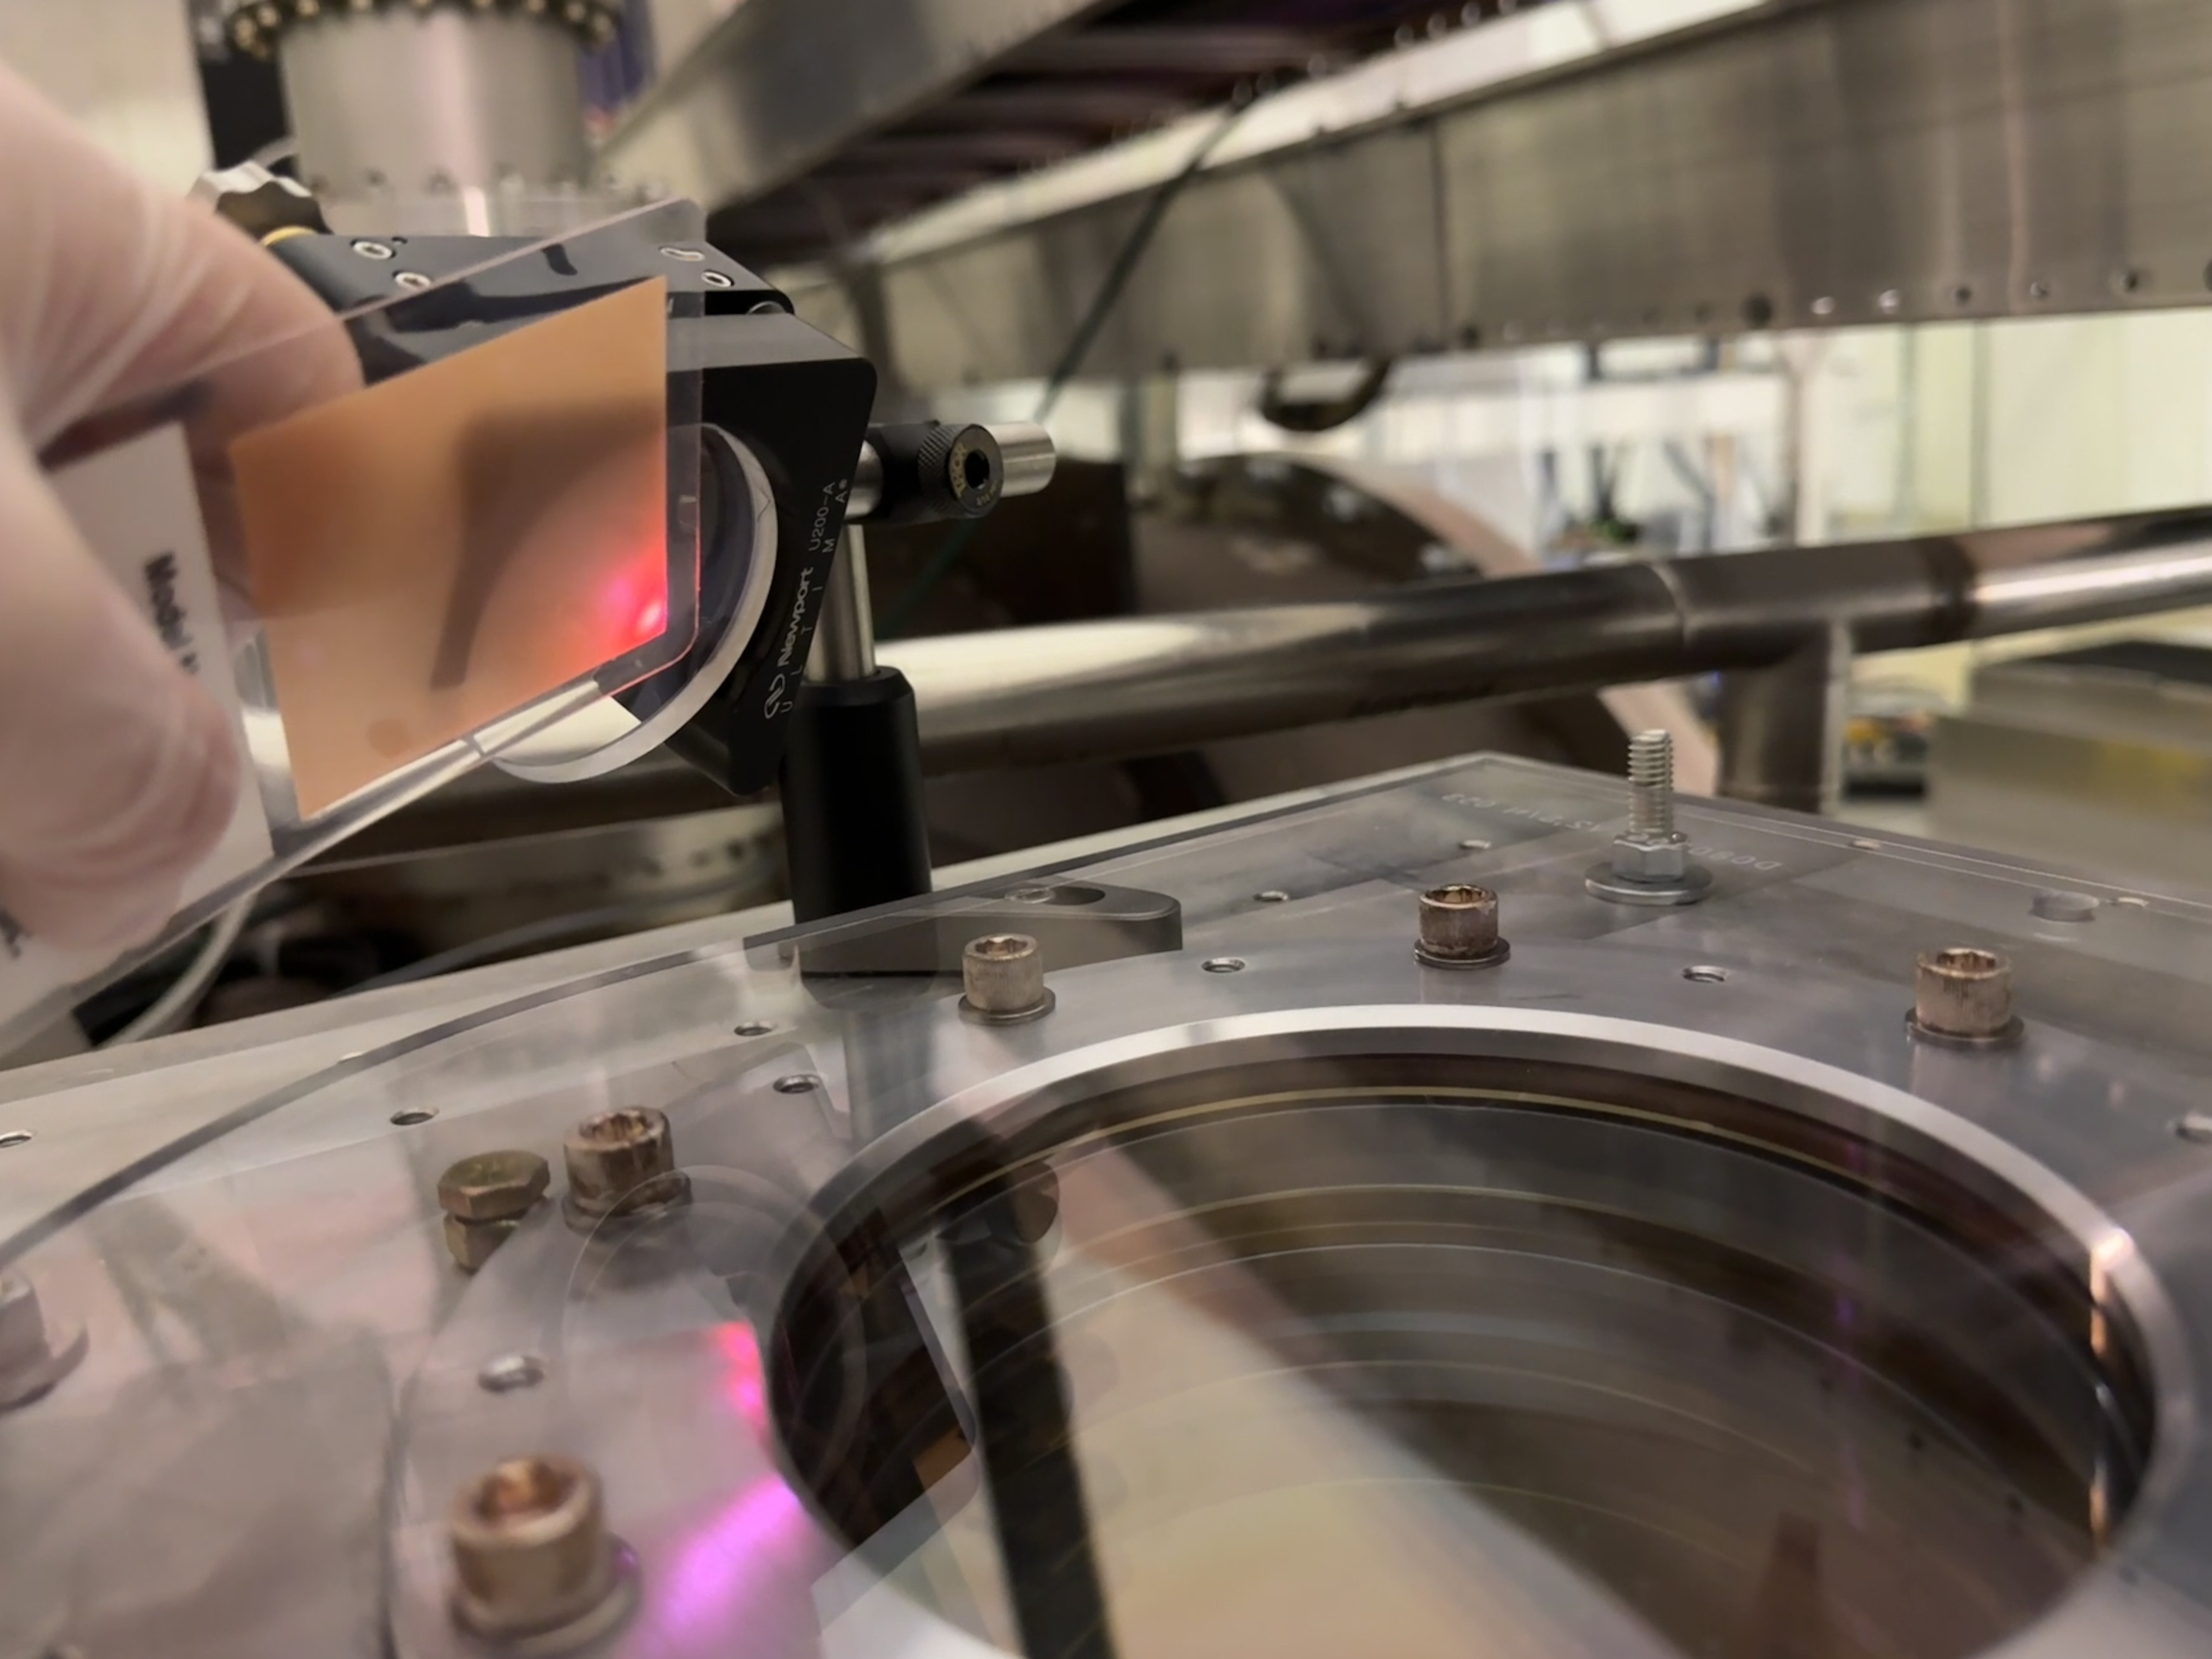
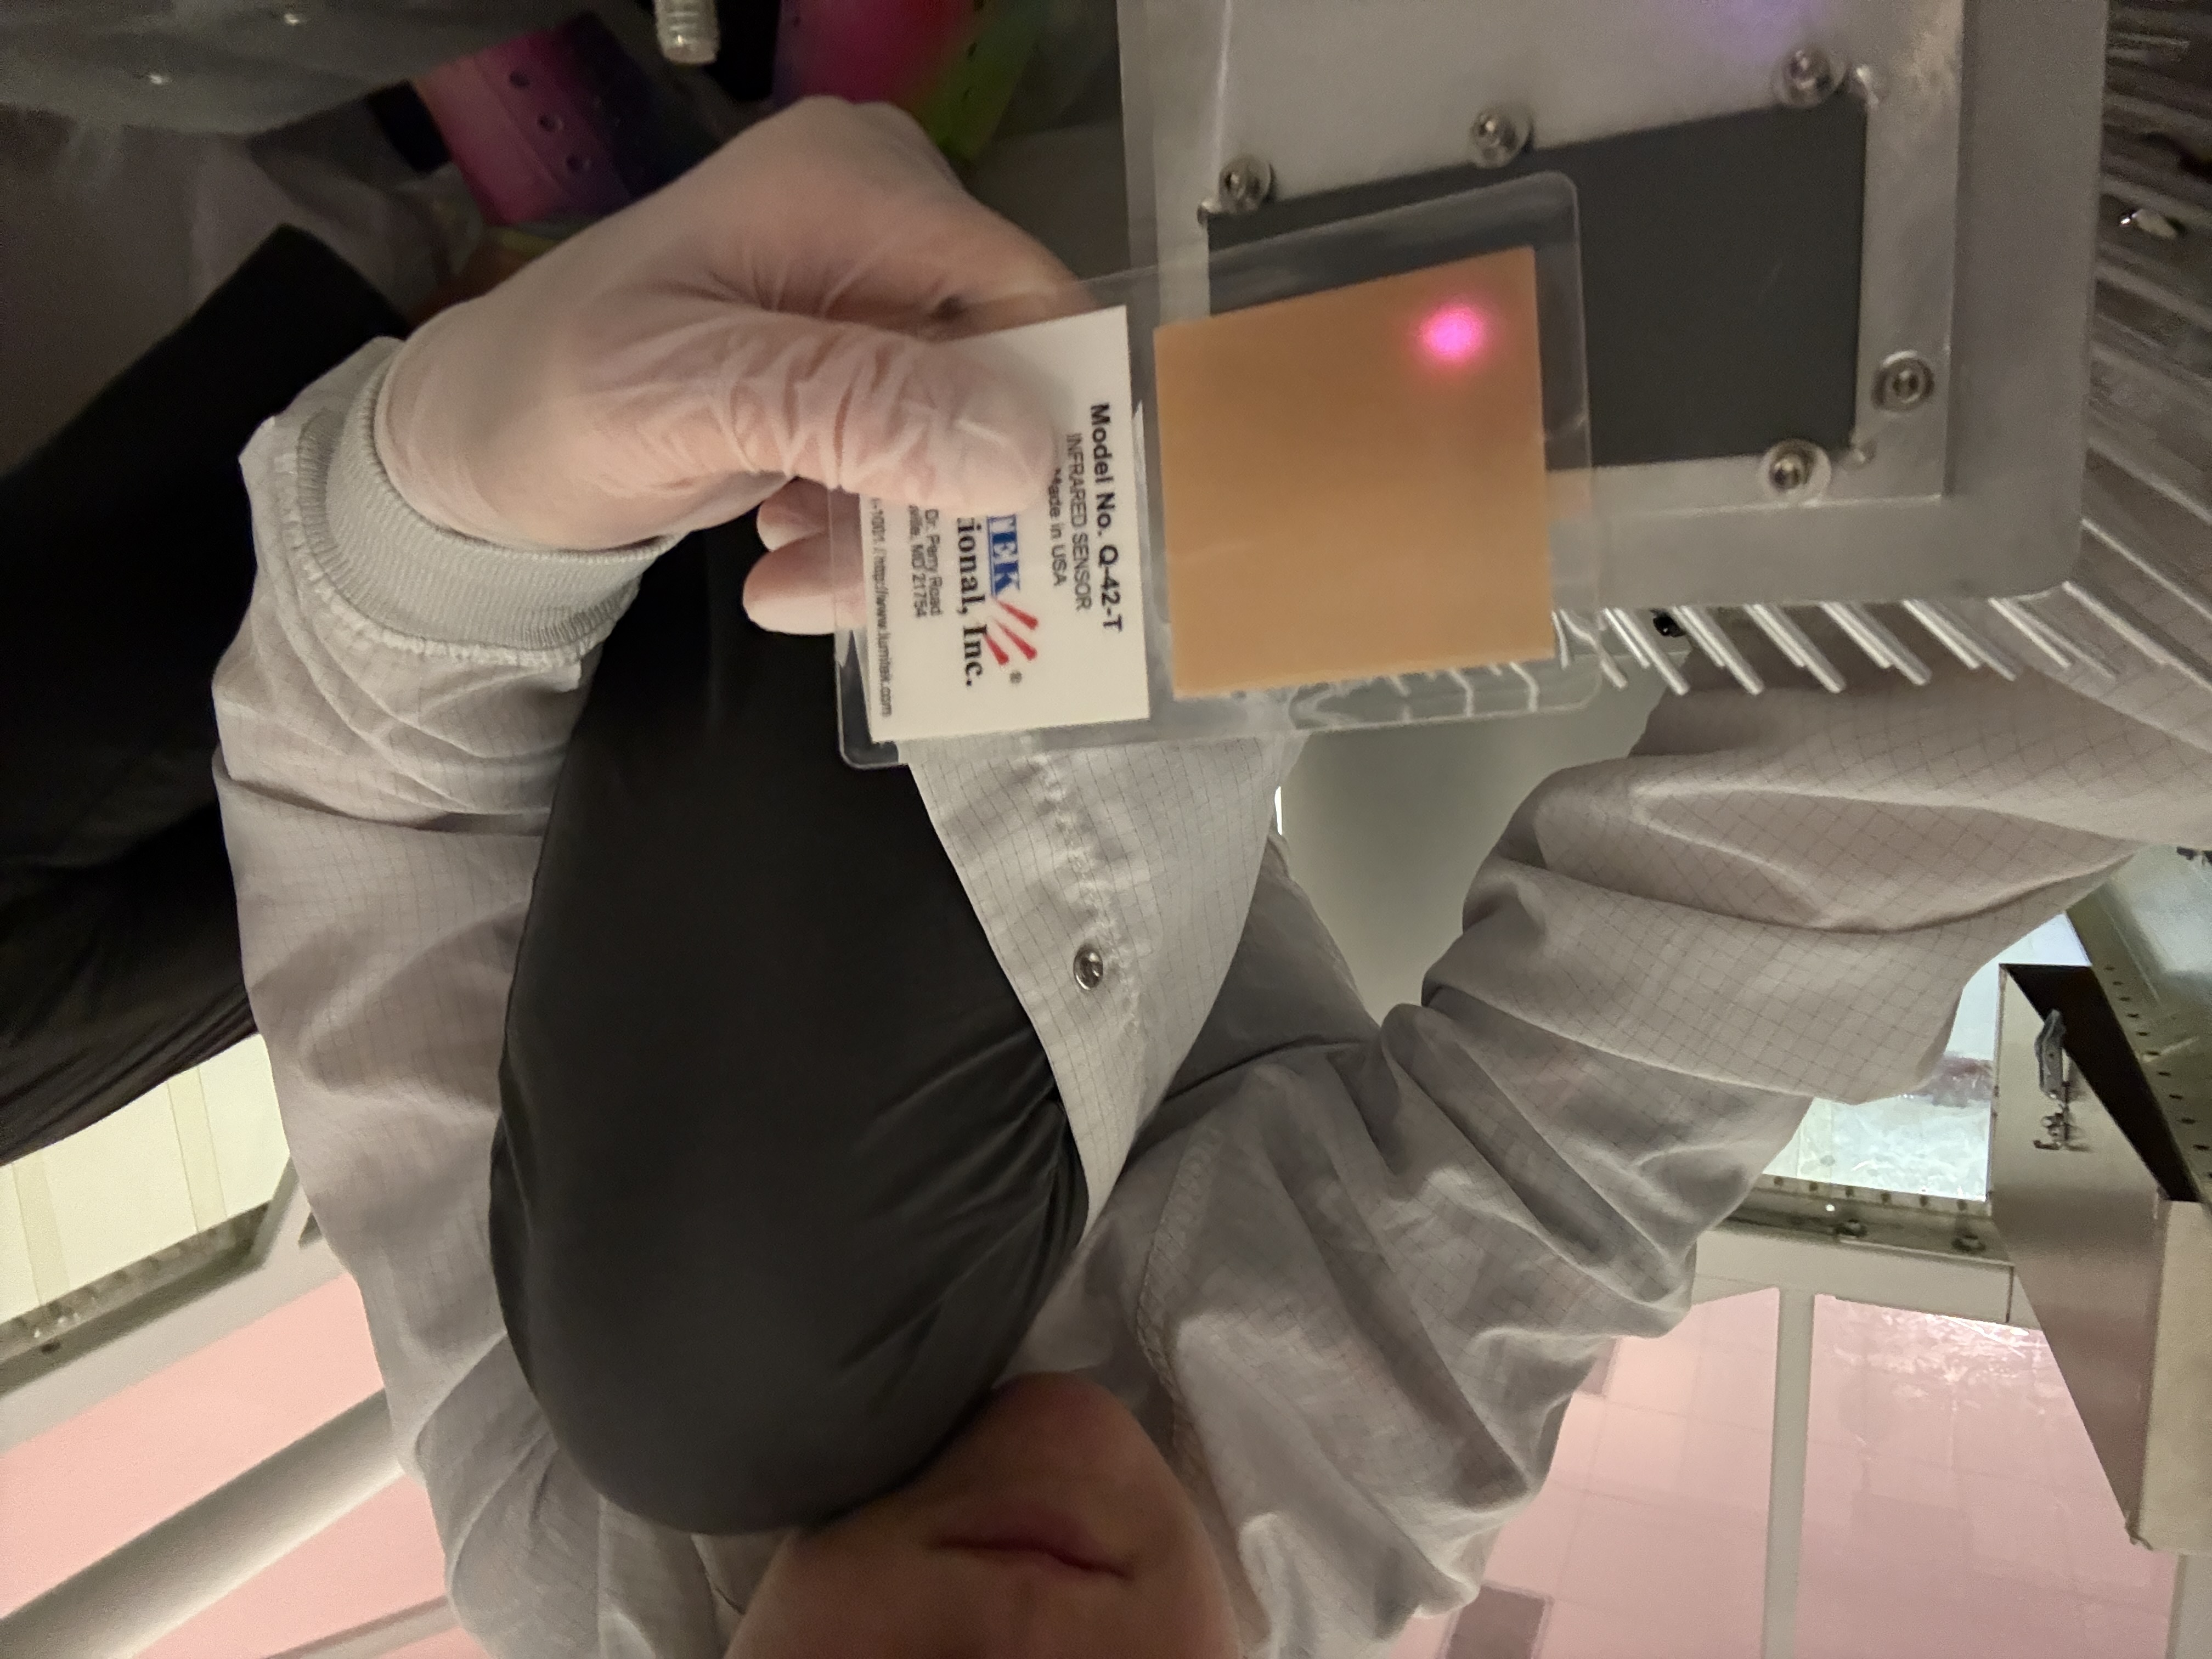
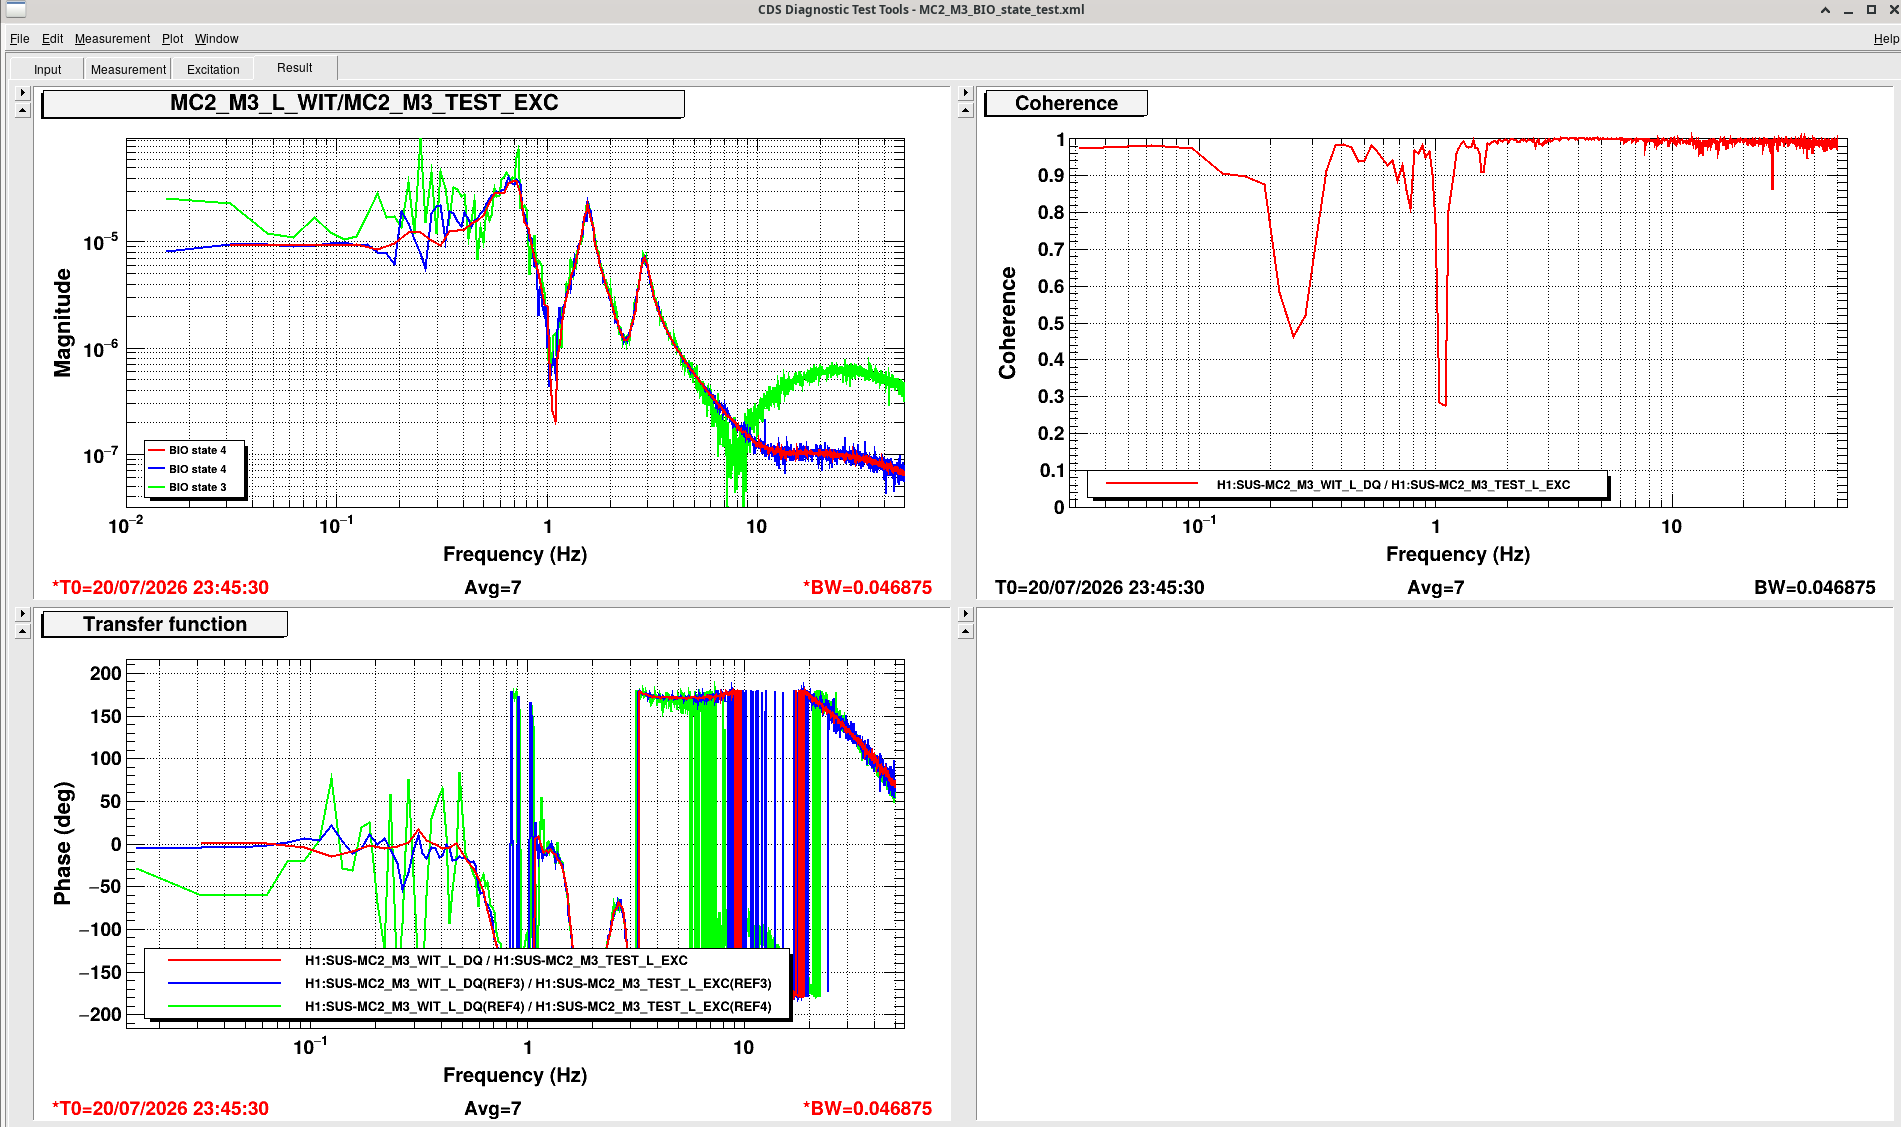
As a part of trying to diagnose the mode cleaner locking issues, I ran a transfer function of MC2 M3 to M3 to see if everything looked normal. Unfortunately, there is nothing in the sus svn to provide a reference, so we don't know what it is supposed to look like.
I immediately noticed strange behavior above 10 Hz that is related to the BIO state. I thought I was on to something, however, I found out that this is a long known problem that comes from coil driver coupling to the osem. Nonetheless, here is a measurement, in case anything else jumps out as strange to anyone.
I took two transfer functions in BIO state 4 - Acq On LP On, and one in BIO state 3 (nominal)- Acq Off LP On.
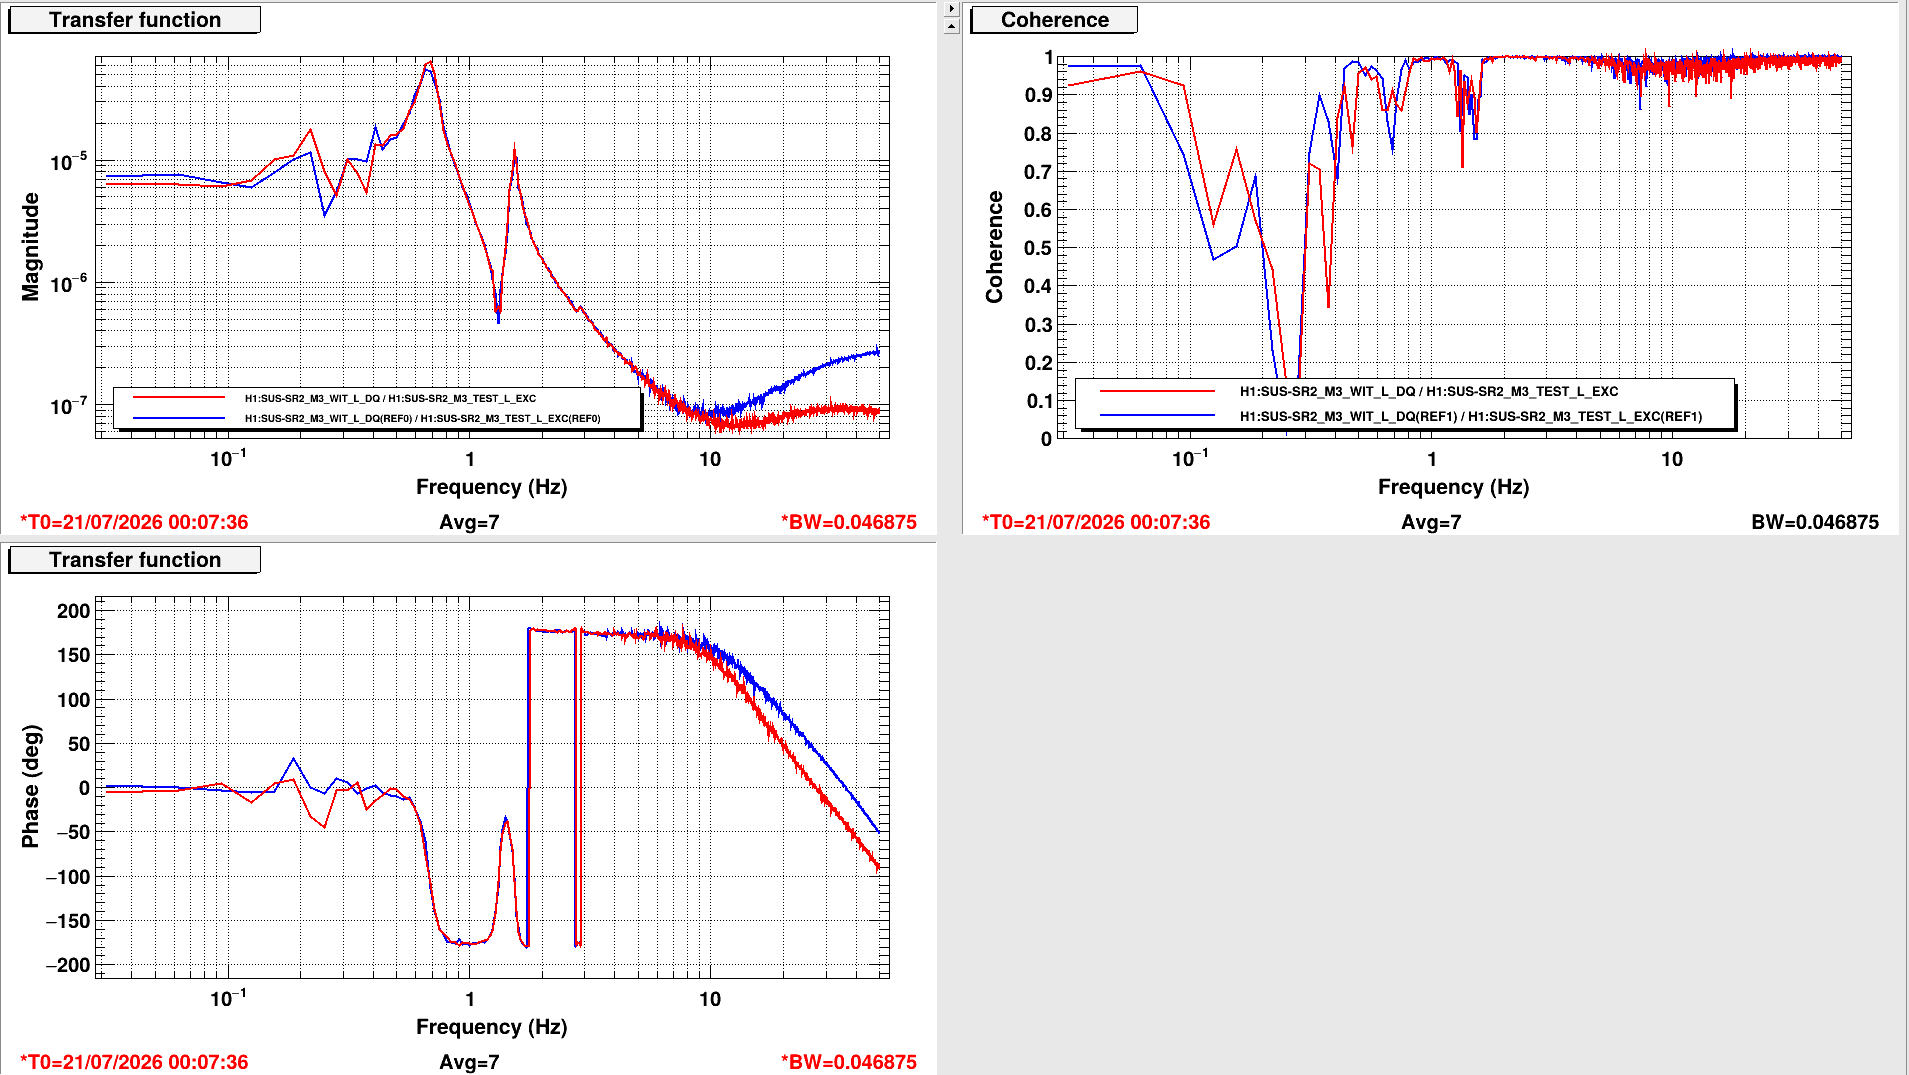
I also measured SR2 when I was investigating the BIO state issue. I toggled between state 3 and four. I noticed that the high frequency response changes like MC2 M3, but much less so.
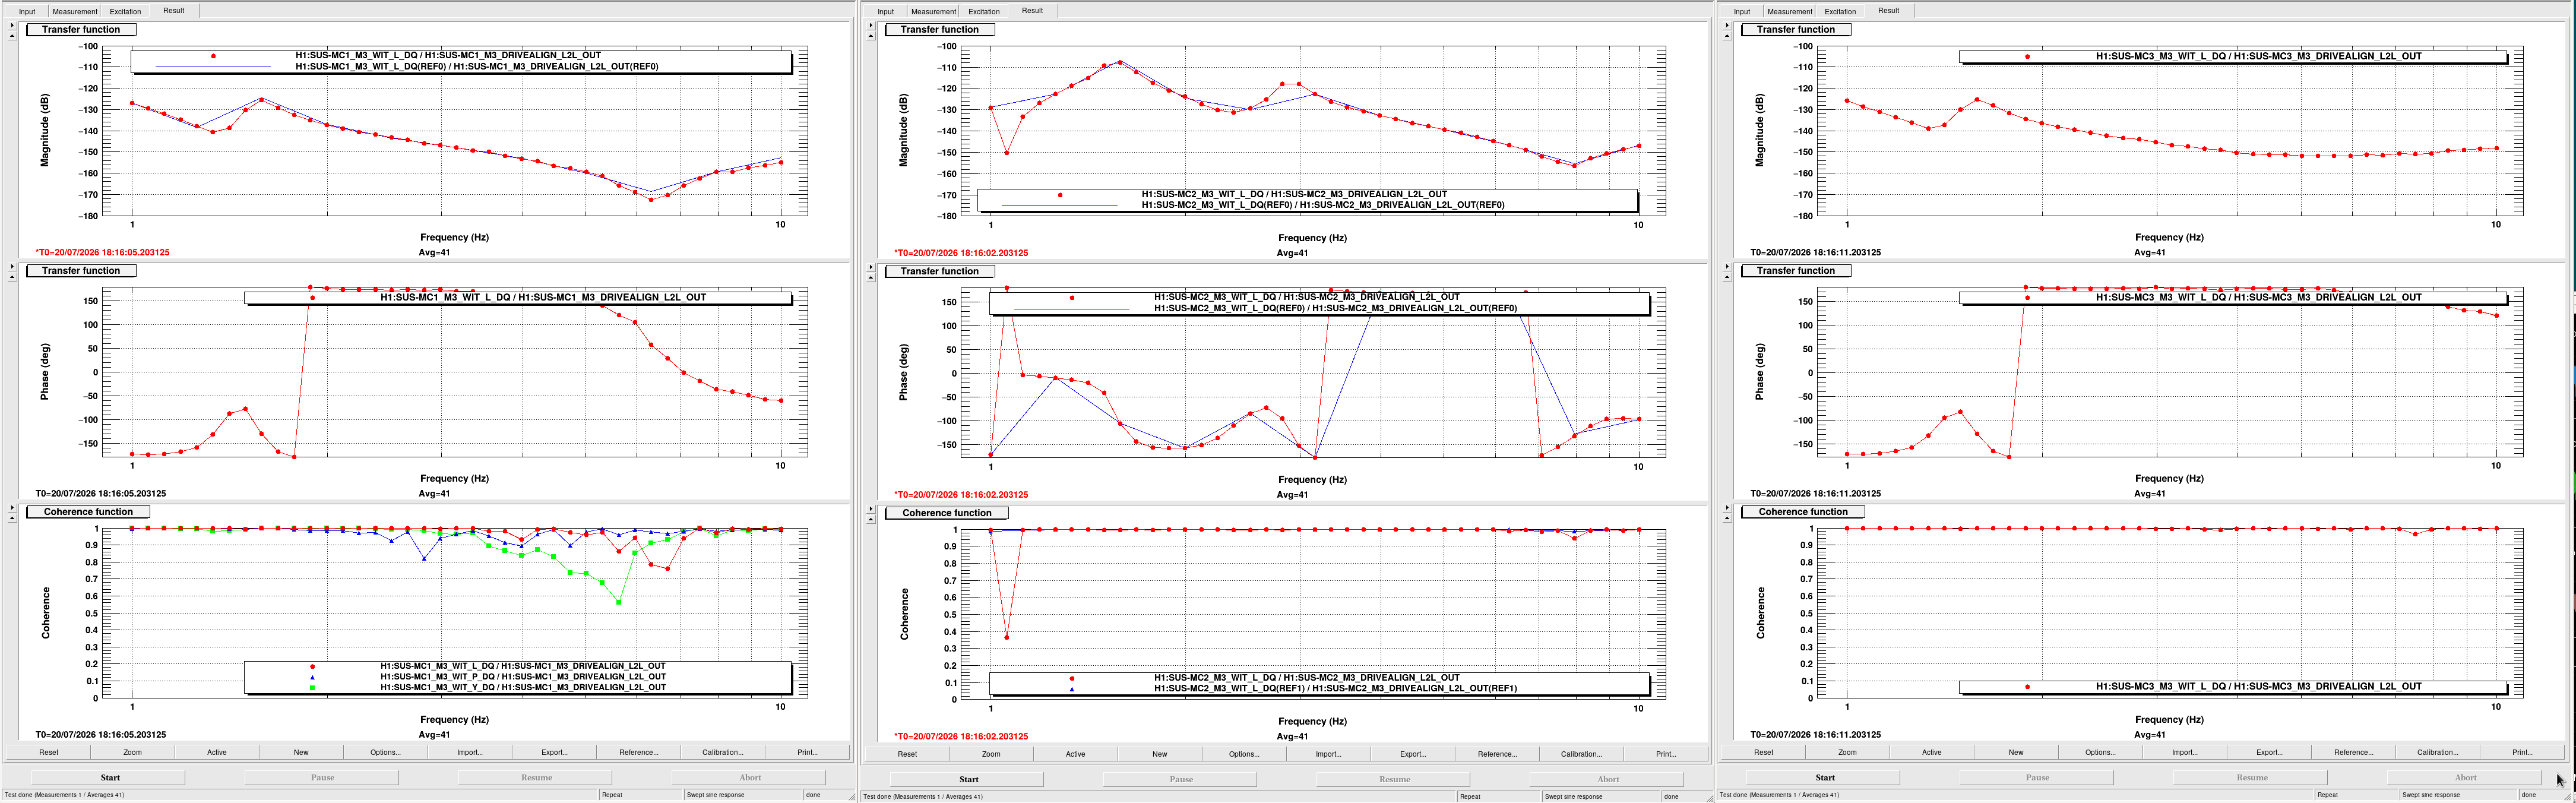
IMC Fast path looks good.
I and Elenna went to the floor and measured the OLTF of the IMC loop, injecting into the IMC CM board. UGF was 43.2kHz with 54deg phase margin, a bit high in frequency but not crazy high, and the TF shape was good in amplitude as well as phase. See PXL_20260720_192425851MP.jpg.
FYI the UGF was 38.5kHz back in March 09 2026 (alog 89438).
M3 stage acquire ON/OFF switching question.
We have noticed that the TF from M3 coil input (or drvalign_L2L_OUT) to VOLTMON and FASTIMON changes as Acqire ON/OFF changes. Is this supposed to be the case? And none of these TFs are flat. Is this supposed to be the case?
MC2-MC3-M3_BIO_TF.png shows the TF from M3 DRIVEALIGN_L2L_OUT to FASTIMON for MC2 and MC3 in various BIO states. State 1 (Acq Off, LP Off) and state 3 (Acq Off, LP On, this is our nominal state) give the same TF, which is different from state 2 (Acq On, LP Off) and state 4 (Acq On, LP On). We can say that LP On/Off is properly compensated for in digital but I'm not sure if this means that Acq On/Off is not switching in analog, because I don't know how the IMON in implemented.
Caveats: For MC2 all four states were tested. For MC3 only state 2 and 3 were measured. MC2 and MC3 are consistent with each other. TFs are only plotted for LL because all coils look similar.
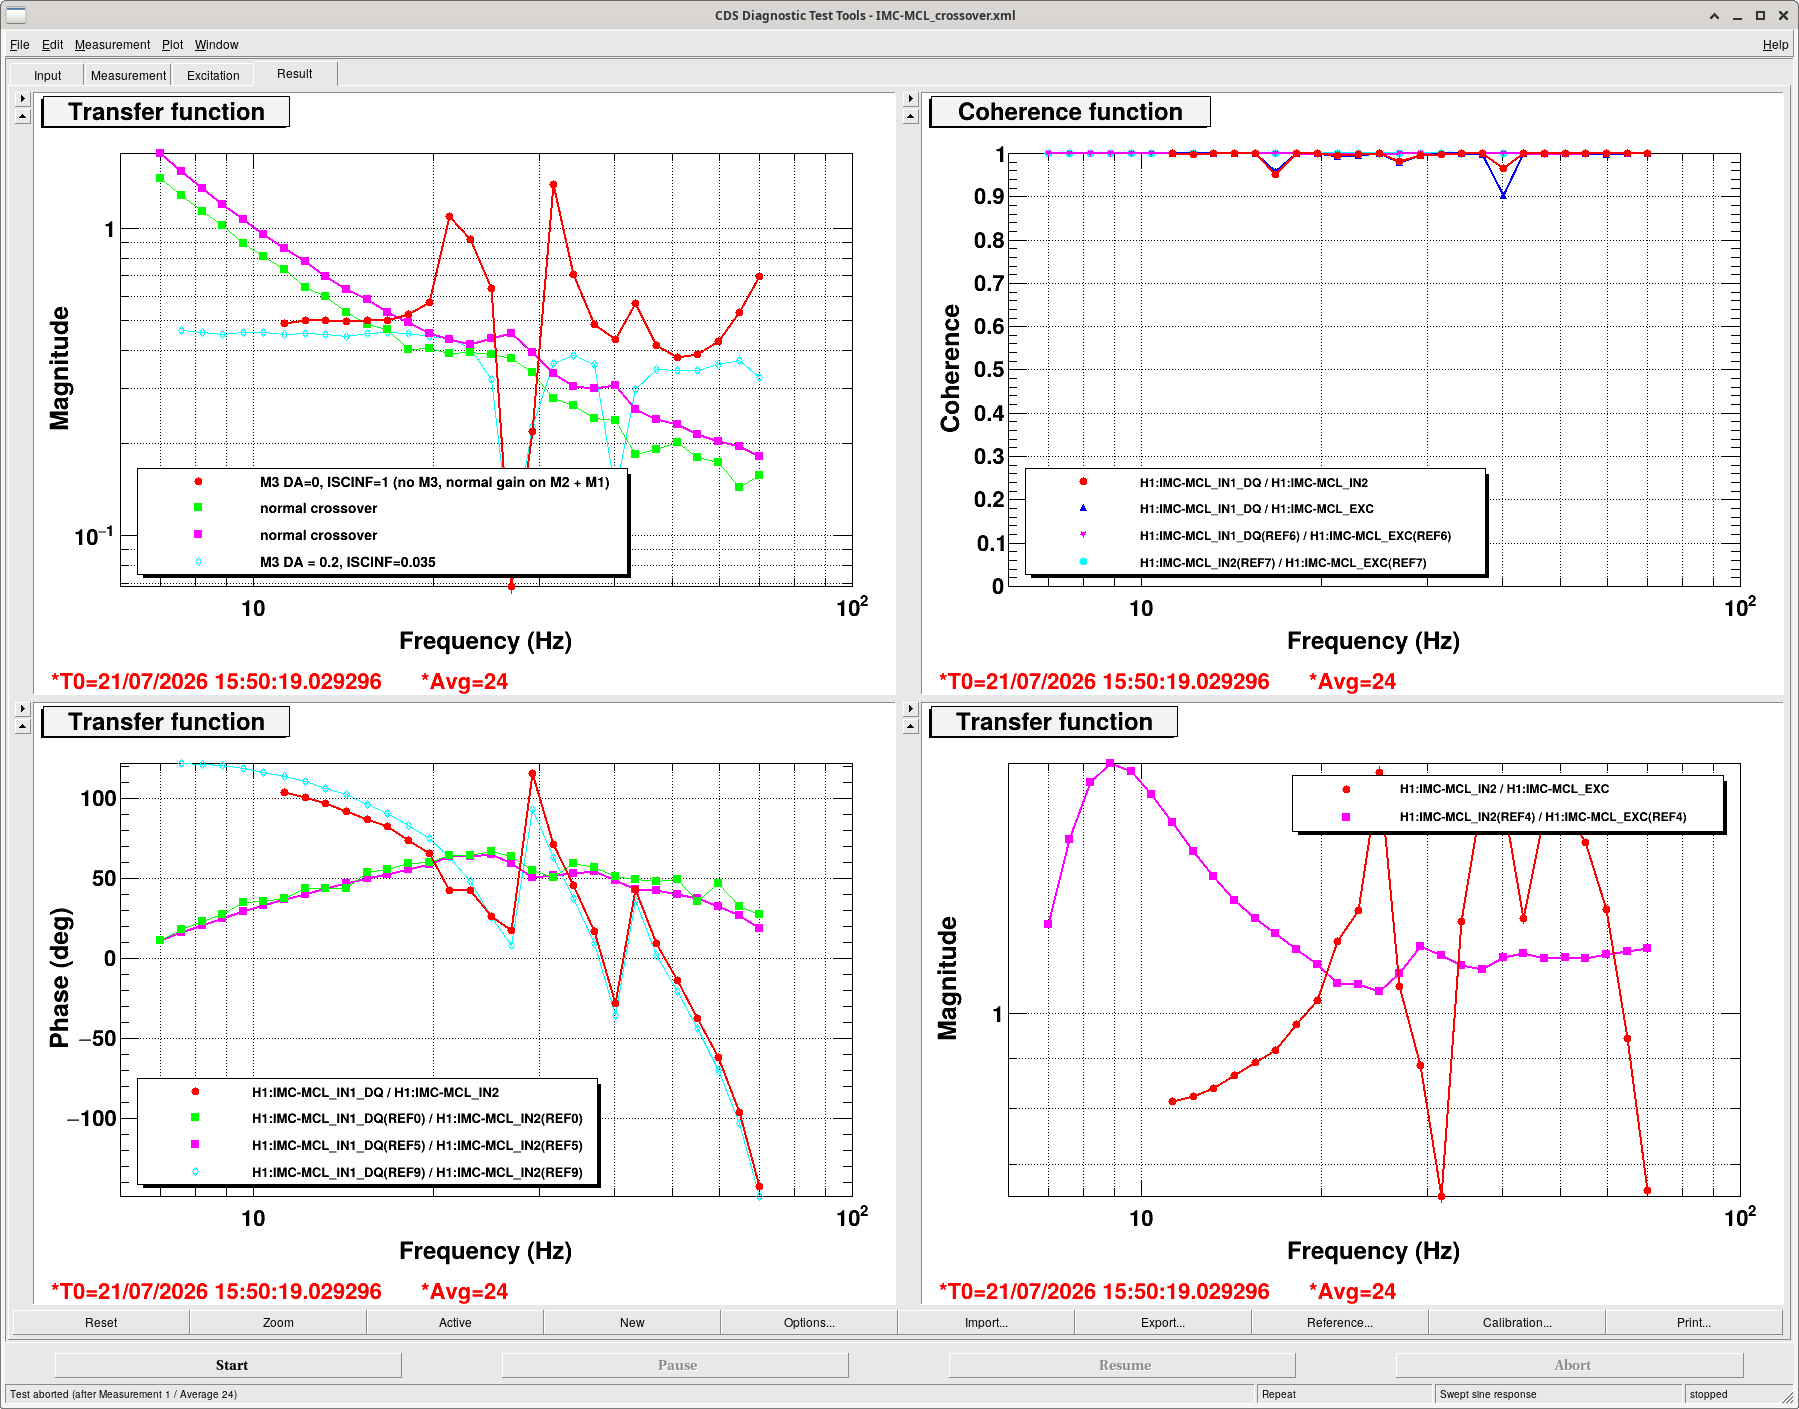
FYI, on Friday we have tested to acquire in all four of M3 BIO states and never successfully locked IMC with nominal M3 gain for any state. Even if acquire ON/OFF is stuck to one state in analog (which I'm not sure if that's the case), it's not the only problem.
Today I tested locking with state 2, it didn't lock with nominal gain but it locked with the same reduced gain setting we've been using since Friday (ISCINF_L_GAIN=0.035, DRIVEALIGN_L2L_GAIN=0.2). I switched the state back to state 3 after that.
M3 stage comparison with MC1 and MC3
Screenshot_2026-07-20_11-51-08.png shows the M3 stage DRIVEALIGN_L2L_OUT to M3 witness L transfer function for MC1, MC2 and MC3 from left to right. They all look different but MC2 shows an extra bump at 3Hz.
Other observations
IMC sometimes locks without M3 stage feedback, but fails much more often than with M3 stage feedback, seemingly due to larger kick to the FSS.
Once IMC locks, you can easily switch between the following gains. Both seem to be very stable:
| M3 DRIVEALIGN_L2L_GAIN | M3 ISCINF_L_GAIN | |
| M1 and M2 reduced, M3 reduced further | 0.2 | 0.035 |
| M1 and M2 full, M3 disabled. | 0 (ramp down first) | 1 |
I never successfully transitioned to "all full" actuation (i.e. M3 DRIVEALIGN_L2L_GAIN=1 and M3 ISCINF_L_GAIN=1) nor M3 reduced by 0.2 and M1 M2 full (i.e. M3 DRIVEALIGN_L2L_GAIN=0.2 and M3 ISCINF_L_GAIN=1).


Jeff K, Sheila-
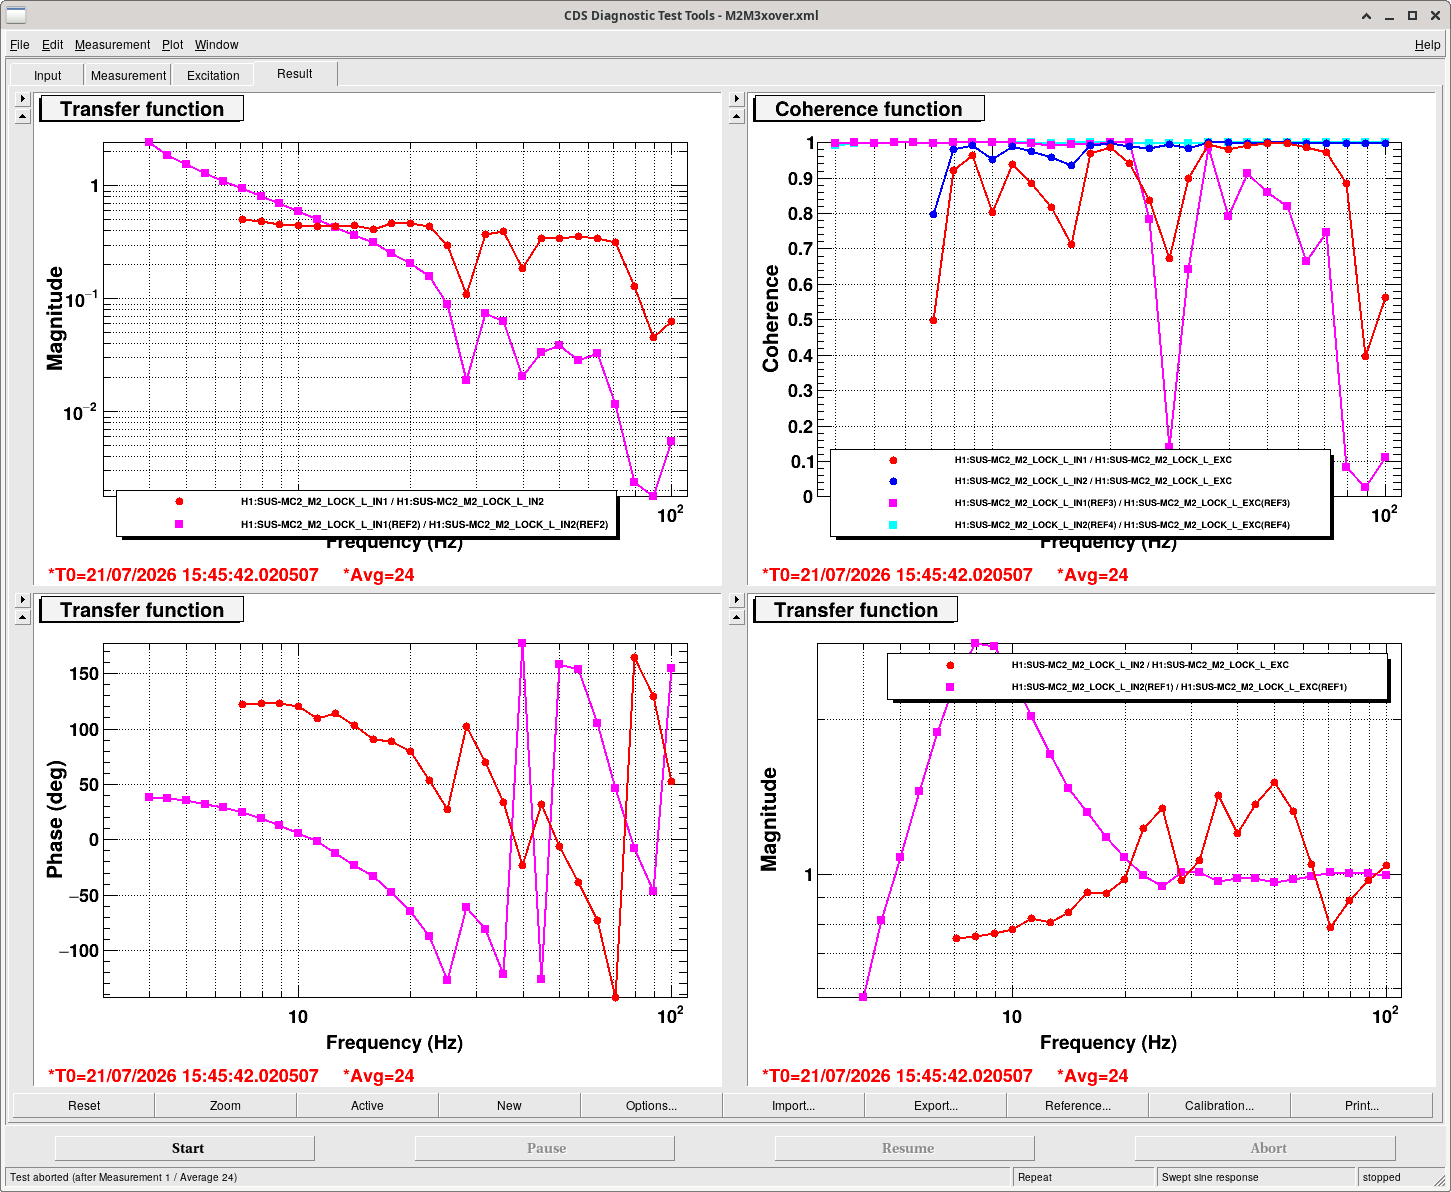
The blue trace in the first sreenshot is with the reduced ISCINF and M3 drivealign gain that Keita describes above, this is a measurement of MCL crossover, which should be (M1+M2+M3)/fast gain.
The red trace in the second screenshot is taken in the same state, with the excitation in M2 lock, which should measure (M1+M2)/(M3+F). These two measurements look the same, which would indicate that the M3 gain is low.
We also repeated the IMC_L measurement with the M3 gain set to 0 and ISC_INF at its normal gain, shown in the first attachement.