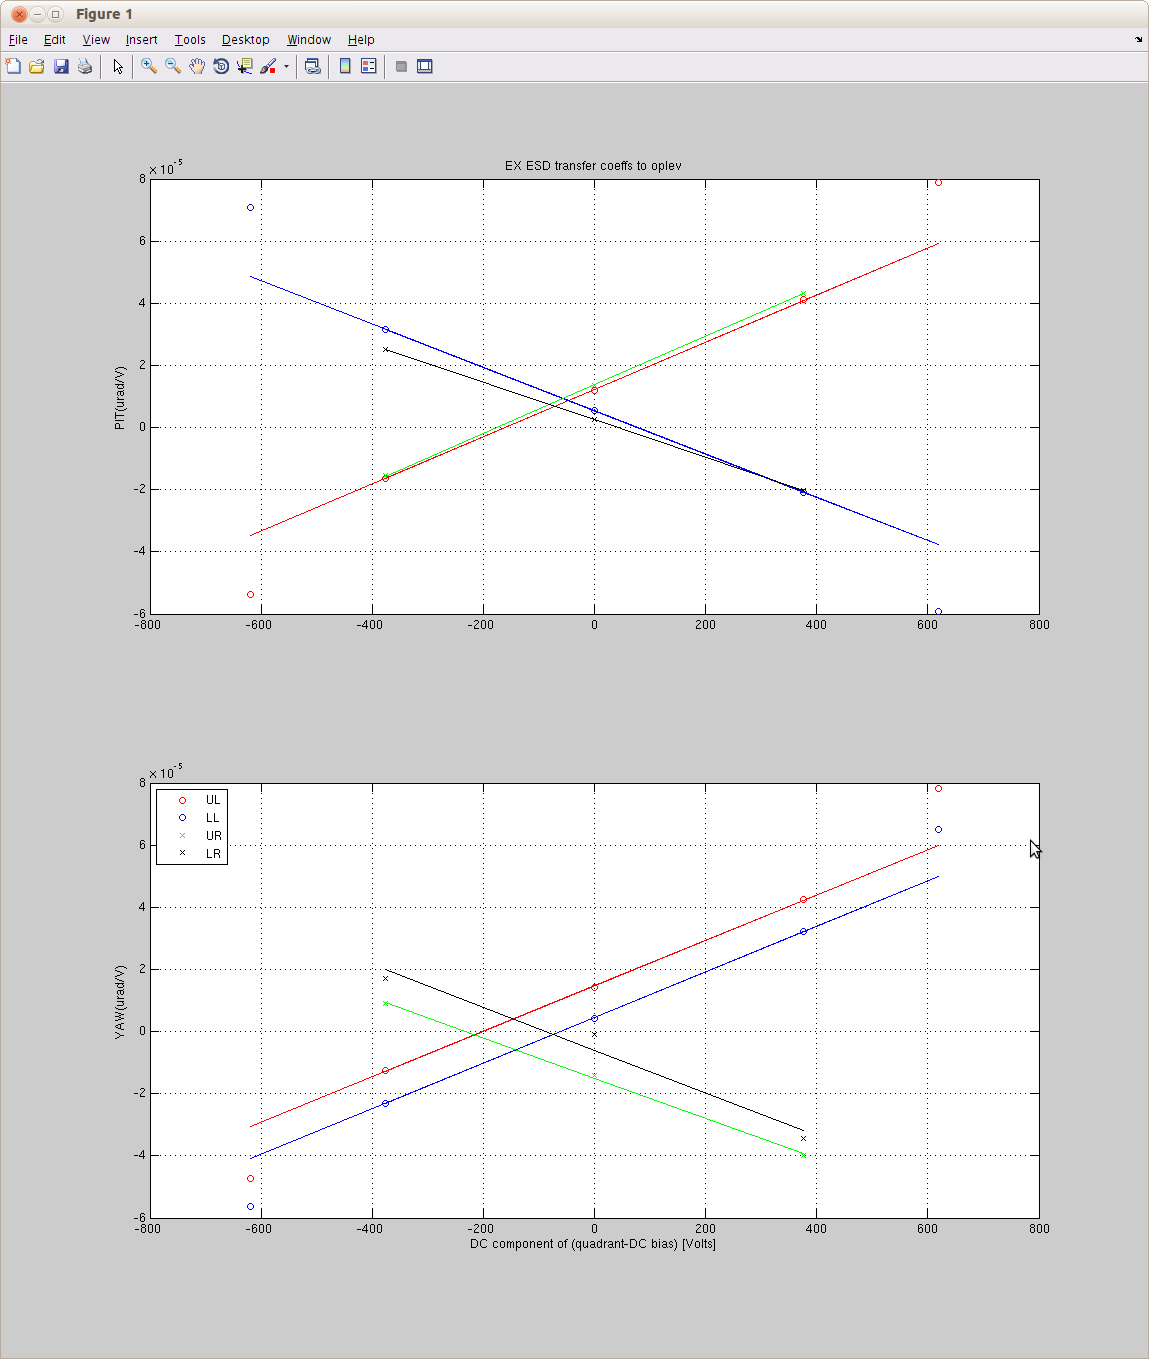
I manually measured the equivalent bias voltage of ESD caused by the charging for ETMX by looking at the oplev.
I changed the bias voltage (-377V, 0, 377V) and measured the transfer coefficients from the drive to the quadrant to the oplev at 3Hz.
In the case of UL and LL, I also put some offset in the quadrant output so I have a larger dc voltage difference between the bias and the quadrant.
As you can see, though it's not a perfect line as you can see in UL and LL, it looks very reasonable in that the absolute value of the slope of four quadrants are quite similar, plus PIT/YAW makes perfect sense.
The effective bias voltage obtained from PIT data and YAW data are different because it is dependent on where the charge is.
For each quadrant I fit the three data points that correspond to no offset in the quadrant itself and obtained these:
| UL | LL | UR | LR | |
| P charge effective bias [V] | -161 | 78 | -176 | 43 |
| P slope [urad/V^2] | 7.6e-8 | -7.0e-8 | 7.8e-8 | -6.0e-8 |
| Y charge effective bias [V] | -201 | -60 | -233 | -88 |
| Y slope [urad/V^2] | 7.3e-8 | 7.3e-8 | -6.5e-8 | -6.9e-8 |