(Borja)
Several issues has not allowed me to drive the ETMY ESD until late afternoon today. At this point I was able for the first time to test, with real data, the automation code for the ESD charge measurements develped at Livingston. I did have previously adapted it for Hanford's slightly different configuration but this was the first time I was able to test its results. Unfortunately the automation on the injection, data request and analysis is not robust, not allowing for the whole process to finish several times. Also the code does not take into consideration conversion factors on the V BIAS from Voltage to counts and viceversa. I assume this is taken care in Livingston outside of the code but certainly that solution does not make it universal.
Looking at the procedure with Rai I realized that we have to be careful on the level of the driving signal amplitude to be below the minimum V BIAS used in the analysis otherwise linear approximation assumptions in the methodology are no longer valid.
Rai is leaving on Saturday and we need to apply his discharging technique before then (optimally tomorrow). Before this takes place we need to have some ESD charge measurement data so that we can compare with data taken after the discharge and see the effects observed. This time constrains has made me decide to do the measurements manually tonight. I may be able to run the automation code afterwards and compare it tomorrow with the manual measurements but this may not be possible. See manual measurements in the attached document.

We are going to use the manual measurements as a basis for comparison before and after the discharge procedure
which we hope to do today.

I cannot comment on the automation program but urge several things:
1) The absolute value of the bias voltage needs to be greater than the absolute control voltage.
2) The phase and amplitude of the motion needs to be used.
3) The linearization routines should NOT be used.

If these simple considerations are observed the algebra to fit for a charge dependent force
coefficient is straightforward and linear.

    Vbias + Vcharge = deflection angle*a  where a is an unimportant constant
The feeling of the LLO charging people is "Yes!" to all these points.

Regarding the automation scripts, it *should* be a simple matter of setting up the desired biases and measurement parameters and hitting go. The scripts take the measurement in exactly the same way one would if doing the measurement manually, with all the amplitudes and bias offsets user-configurable and the signals are injected directly at the individual ESD quadrants (i.e. not through any linearization).
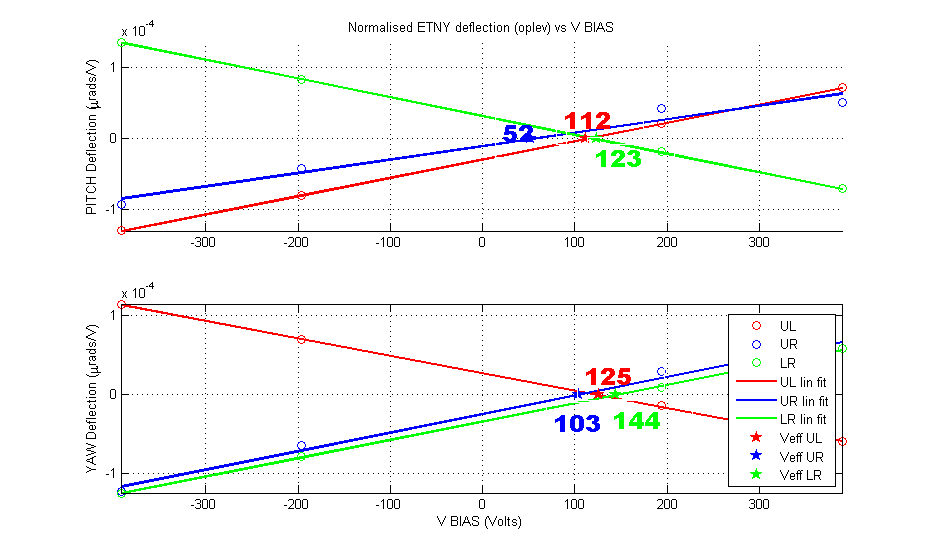
There is an important point which although I did not mention explicitly in the aLog entry is highlighted in the document attached to it. This is that the excitation driving each of the 4 quadrants provided a good SNR (of between 4 and 15 depending on the BIAS Voltage) of the oplev deflection values at the injection frequency with the exception of the LL quadrant which only showed noise (evidenced by the random values of the measurement points in magnitude and phase and by the low coherence of the between the excitation and the oplev deflection at the injection frequency). This issue, I have found, has a long and complex history which I will deal with in another aLog entry on the 9th August. I have also added to this comment the plots of the measurement results, an updated version of the measurements pdf and a table with final values of slope and Veff for each measured quadrant.
| UL | UR | LR | |
| Veff PITCH [urad] | 122 | 52 | 123 |
| PITCH slope [V] | 2.6e-7 | 1.9e-7 | -2.65e-7 |
| Veff YAW [urad] | 125 | 103 | 144 |
| YAW slope [V] | -2.2e-7 | 2.34e-7 | 2.3e-7 |