(Borja)
This entry is a summary of the manual measurements results of the ETMY charge done before Rai's ionized gas injection discharge run1 and run2.
The measurement technique is the standard procedure of injecting a sinusoidal signal of 4Hz and 91.5Volt in amplitude to each quadrant of the ESD (with the exception of quadrant LL because it did not respond to the excitation, more about this on another entry). Then we monitor the deflection of the ETMY both in Pitch and Yaw by looking at the oplev which was carefully centre before any measurement was taken. The deflection was measured in diaggui as power spectrum plot of pitch and yaw, with a BW = 0.01Hz on the range between 1 – 5 Hz and averaged of 2 (for the before measurements) and 3 (for the after discharge measurements) times.
During the measurements the coherence between ‘excitation and Pitch’ and ‘excitation and Yaw’ was monitored to be sure that the excitation was observed. The phase (in degrees) of the transfer function between excitation and oplev pitch and yaw was measured to take into account the sign in the deflection.
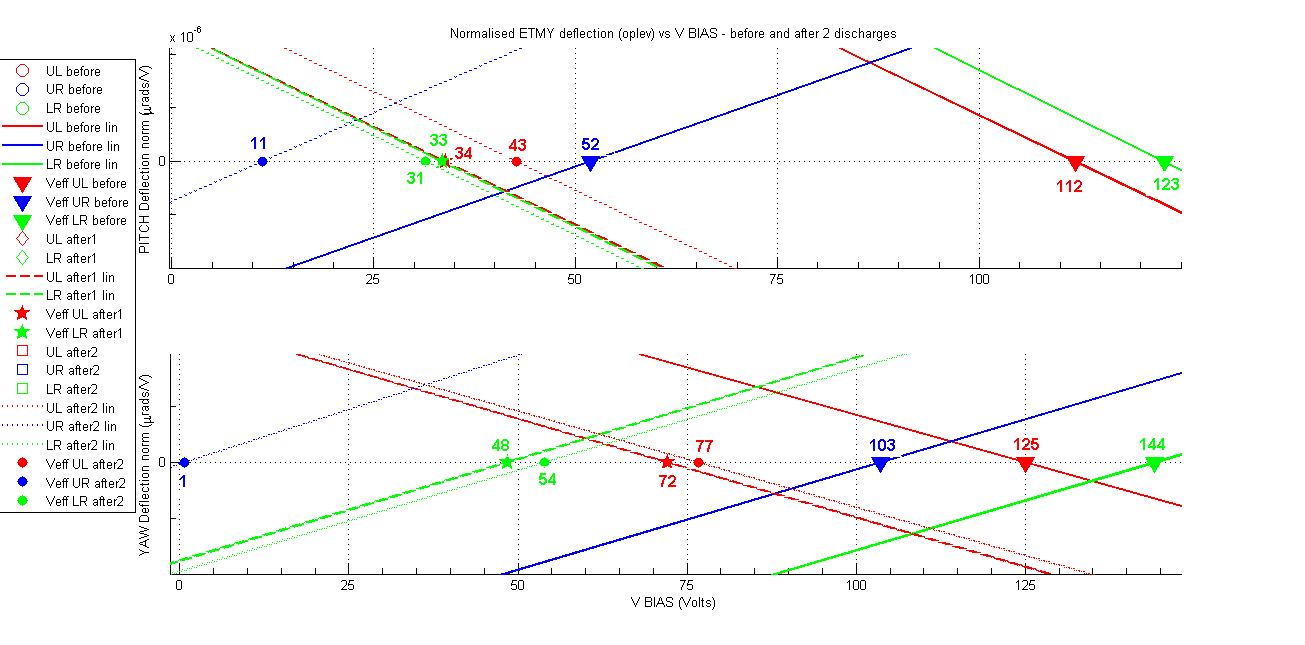
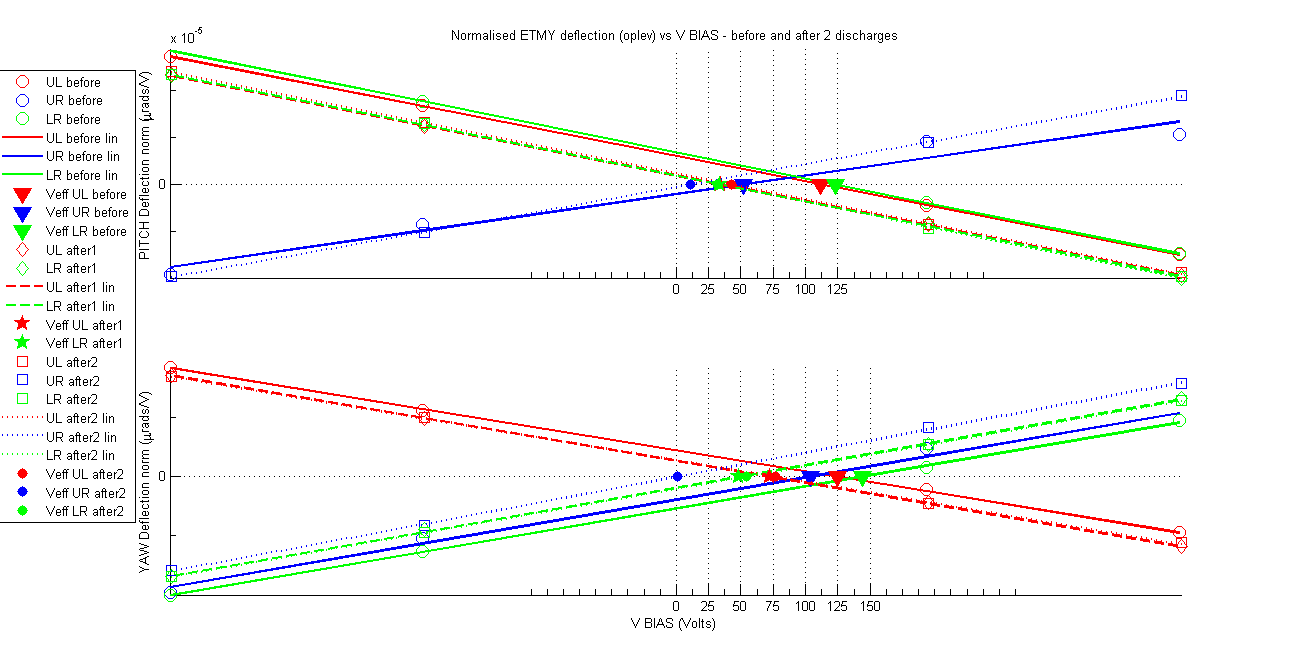
Attached to this entry I provide a document with the results for each measurement. Also I provide the combined plots of the results in the standard way “Normalised deflection [µrad/V] vs V BIAS” where the deflection is normalised by dividing the deflection with the excitation amplitude (91.5Volt). The plot contains quite a lot of information (well explained by reading the plot legends) so a zoom version is also added around the Veff values (or deflection zero crossing).
Next I show a table with the summary, providing for each quadrant values of the pitch and yaw slope and Veff.
|
|
UL before |
UL after1 |
UL after2 |
UR before |
UR after1 |
UR after2 |
LR before |
LR after1 |
LR after2 |
|
Veff PITCH [V] |
112 |
34 |
43 |
52 |
- |
11 |
123 |
33 |
31 |
|
PITCH slope [10-7 µrad/V] |
-2.585 |
-2.61 |
-2.63 |
1.89 |
- |
2.35 |
-2.65 |
-2.63 |
-2.655 |
|
Veff YAW [V] |
125 |
72 |
77 |
103 |
- |
1 |
144 |
48 |
54 |
|
YAW slope [10-7 µrad/V] |
-2.21 |
-2.30 |
-2.25 |
2.34 |
- |
2.54 |
2.32 |
2.37 |
2.365 |
Looking at the Veff in the table above we notice that the first discharge run was effective by a factor between 2 and 4 depending on quadrant and type of deflection (pitch or yaw). However the second discharge did not have so big effects and in some cases showed an increased charge.
(R. Weiss)
Rai has suggested that the results may suggest that the gate valve, in the second ionized gas discharge run, may have not been opened into a clear aperture even though the measurements of the ion currents were larger. It would be advisable to learn the best injection method for which It all needs to be done a third time. Rai thinks that the results so far are useful enough to decide whether we want to build more of the ionizers. Another very important step in the final decision will be the effect that the green laser light will have in the charging of the ETMY.