It has been a couple of days without updates on the charge measurements side which does not mean that the activity stopped, actually the total opposite. I will try now to summarize where we are and what is being planned for the very near future.
First of all this entry reports on measurements that follow up the measurements reported here and the previous measurements chronologically compiled here.
Up until now we have only reported on ETMY charge measurements because only this mass has been available. This has recently changed so I will be able to report here the first set of ETMX charge measurement.
But let's continue with ETMY for the moment, although I will once again include a compilation of previous measuremnts, all properly numbered:
1) ETMY was considerably charged before the ionised gas discharge runs were used.
2) Two ionised gas discharge runs were applied to ETMY. The first one had a considerable discharge effect, although not so much the 2nd one which slightly increased the charge. The first discharge run was not ideal with a big ratio between injected positve and negative ions. The second discharge run succesfully increase the total number of ions injected but it failed on its intention to reduce the ration between the negative and positive ions. In order to do this the second discharge run was done with a much reduced aperture of the gate valve at the ETMY chamber. It is now believed that this caused the ionised gas to pass through the labyrinth at the "O" ring and so have a chance for the ions of opposite sign to cancel each other. A third discharge run will be done sometime in September which will correct all this problems.
3) During the ETMY measurements I noticed that I was not able to drive one of the ESD quadrants (labelled LL on the CDS screens). The reason for this is that the LL driving cable was going through the ESD low pass filter box which was actually intended to filter frequencies above 1 Hz of the ESD BIAS. As the driving signal was at 4Hz then it was highly attenuated. This was fixed.
4) The ion pump at ETMY was turned ON. After 4 hours a run a charge measurements and noticed an increase of the ETMY charge to levels observed before any discharge was done. Several issues could be causing it; ion pump, cold cathode on top of the ETMY mass, iluminators pointing to the ETMY and finally a change in the electric field configuration at the ETMY due to the ESD drive cable swap.
5) Keeping the ESD drive cables as in the previous measurement I repeated charge measurement 1 day after (this measurement is identified as "after23", which means measurement 3 after discharge run 2 I will keep this labeling from now on) and the charges increased even further with one quadrant (labeled UR) changing sign in the charge.
6) In order to see the effect of ESD driving cables we swap the LL quadrant driving cable to go again through the ESD LP filter box and then measure charge 1 day after the previous measurement (new measurement is labeled "after24" the related aLOG is here). Between this measurement and previous measurement the charge values did not change for most of the quadrants (which may indicate that swaping the cables has no effect on these measurements) with one exception the quadrant labeled UR (the one which changed charge sign previously has changed sign again to the same sign as the rest of quadrants.
7) On the 14th of August we had the scheduled power cut to LHO, this caused everything to be turned off. However I confirmed that iluminators, cold cathode and ion pump came back shortly after.
8) Each full measurement takes about 1.5 hours. This is mainly due to the high bin resolution used to calculate the spectrum of the pitch and yaw oplev signals. Up until now this resolution is BW = 0.01Hz. To speed up the measurement process I tested that reducing the resolution by half would not have much effect on the standard deviation of consecutive measurements. I drove a single quadrant (UR) at a single VBIAS = +390V and repeated 4 measurements for 3 different BW values (0.01, 0.02 and 0.04). Each measurement is done with Averages = 3, I show next measurement values for pitch and yaw including mean and STD for each BW value. The conclusion of these measurements is that BW values has not a dominant effect on the STD observed so from this point on I will be using BW = 0.02Hz
|
BW |
1 |
2 |
3 |
4 |
Mean |
STD |
||||||
|
Pitch |
Yaw |
Pitch |
Yaw |
Pitch |
Yaw |
Pitch |
Yaw |
Pitch |
Yaw |
Pitch |
Yaw |
|
|
0.01 |
9.3088e-3 |
8.3217e-3 |
9.8845e-3 |
8.756e-3 |
10.777e-3 |
9.0433e-3 |
11.229e-3 |
9.728e-3 |
10.300e-3 |
8.962e-3 |
8.65e-4 |
5.90e-4 |
|
0.02 |
8.2067e-3 |
6.7879e-3 |
8.4317e-3 |
7.0868e-3 |
8.3749e-3 |
7.1369e-3 |
8.3915e-3 |
7.396e-3 |
8.351e-3 |
7.102e-3 |
0.992e-4 |
2.494e-4 |
|
0.04 |
6.0939e-3 |
5.352e-3 |
6.1968e-3 |
5.356e-3 |
6.0822e-3 |
5.4248e-3 |
6.304e-3 |
5.2534e-3 |
6.169e-3 |
5.346e-3 |
1.035e-4 |
0.705e-4 |
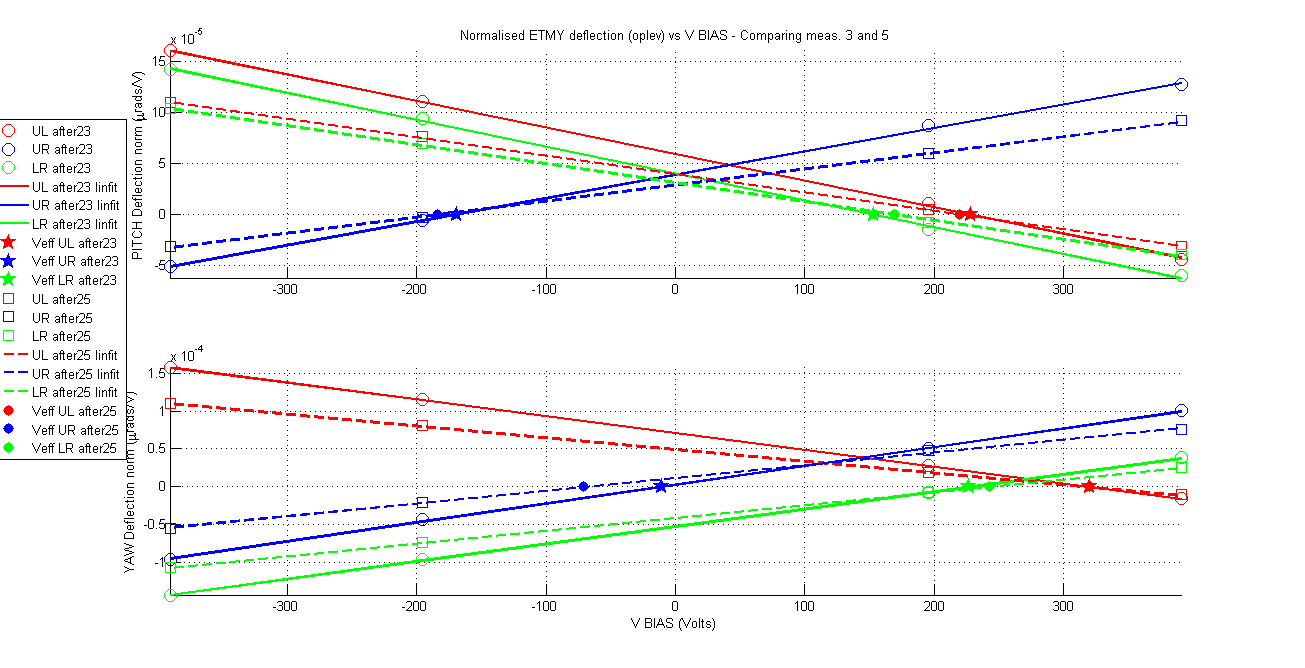
9) NOW IS WHERE THE NEW MEASUREMENTS ARE BEING REPORTED: In light of the point above I wanted to confirm that the ESD cabling configuration had definitively no effect on these measurements. So I repeated measurement with the same cable configuration as "after24" (this is provided here attached and labeled "after25") the immediately I changed the cable configuration to the proper version where we can drive the LL quadrant. Unfotunately I was never able to complete that final measurement because the ESD HVA power supply turned off twice during the measurements (the first time I went to turn it on but I decided not to do so the 2nd time just in case something serious was happening). For completeness I attach here the uncomplete measurements which I took ("after26") but the injections were weak most of the time and so I will not include this measurement in the analysis. I compared next the results from this measurement ("after25") with the previous 2 measurements ("after24") and ("after23") and this is what we observe:
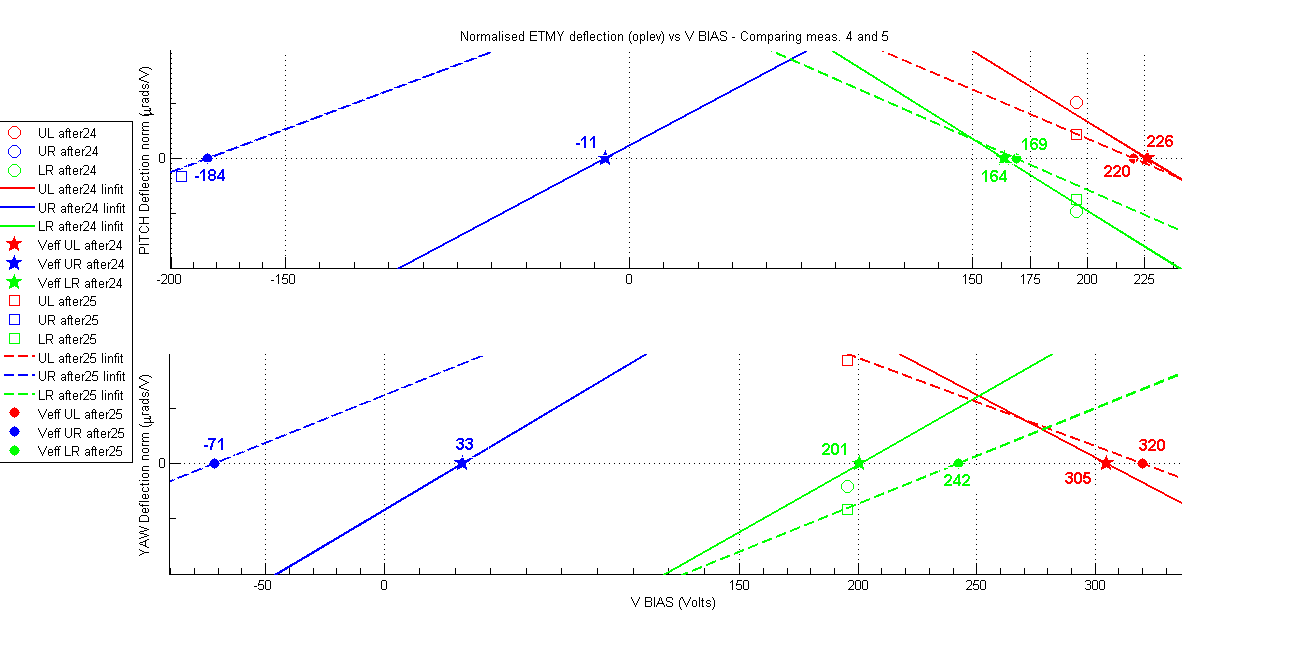
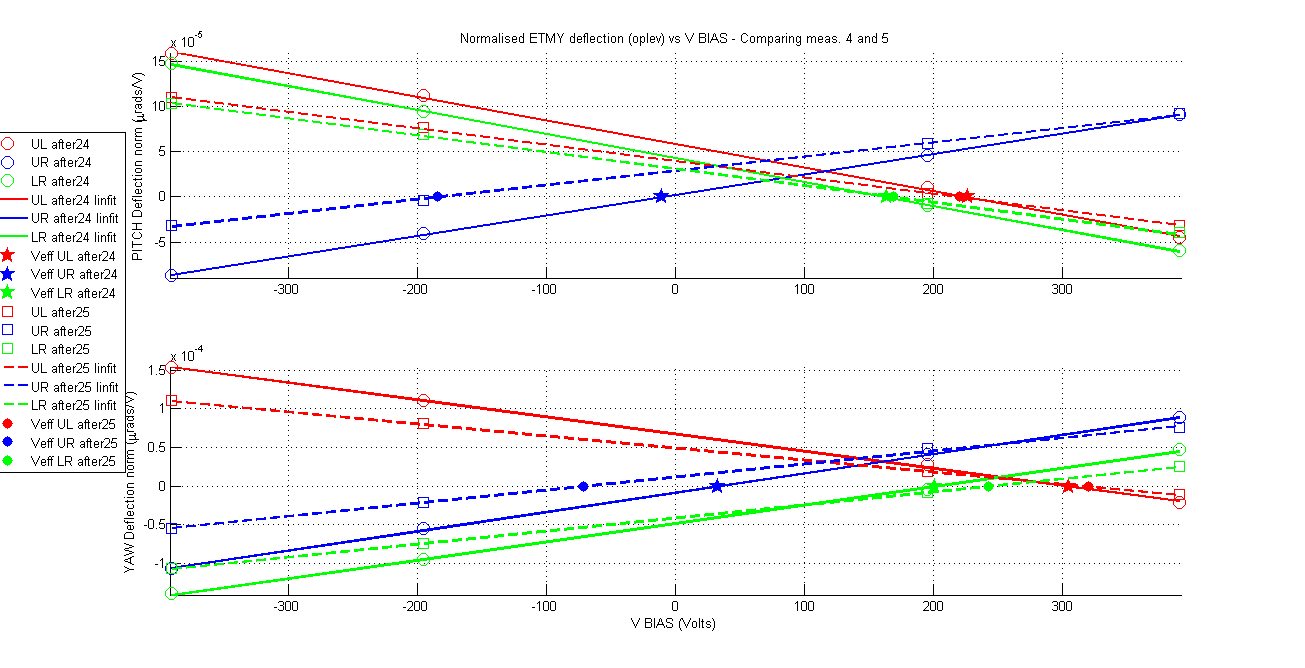
Table summary of Veff and slopes for the 3 sets of measurements (notice that the measurement with suffix 23 is in red, the one with suffix 24 is blue and the current one 25 is in green):
|
|
UL - 23 |
UL - 24 |
UL - 25 |
UR -23 |
UR - 24 |
UR - 25 |
LR -23 |
LR - 24 |
LR - 25 |
|
Veff PITCH [V] |
228 |
226 |
220 |
-169 |
-11 |
-184 |
153 |
164 |
169 |
|
PITCH slope [10-7 µrad/V] |
-2.6059 |
-2.6014 |
-1.8133 |
2.3050 |
2.2564 |
1.5825 |
-2.6351 |
-2.6454 |
-1.8588 |
|
Veff YAW [V] |
320 |
305 |
320 |
-11 |
33 |
-71 |
227 |
201 |
242 |
|
YAW slope [10-7 µrad/V] |
-2.2264 |
-2.2153 |
-1.5542 |
2.48879 |
2.4904 |
1.6861 |
2.3077 |
2.3825 |
1.6895 |
The results of these measurements are again interesting. We noticed that the common sign charge quadrants (labeled UL and LR) report a consistent charge in pitch and yaw within a few percent, however the other quadrant (UR) with opposite sign charge it did suffer again a new change in charge sign and an increase respect to previous measurements. I do not fully understand what is causing this charge sign change but the other quadrants at least report a consistent charge saturation. Another important thing to considere is that if you look at the Yaw and Pitch deflection vs VBIAS plots attached which compare the measurements in the table above we notice that "after25" has different slopes per quadrant than for any previous measurement, this was never the case before. This slope is related to the dielectric constant and relative dielectric constant of the test mass, the spacing between test mass and electrodes, and geometry of the electrode pattern, the mass of the test mass and the injection frequency. Certainly none of these parameters should have change with maybe the exception of the spacing between the electrodes and the test mass.
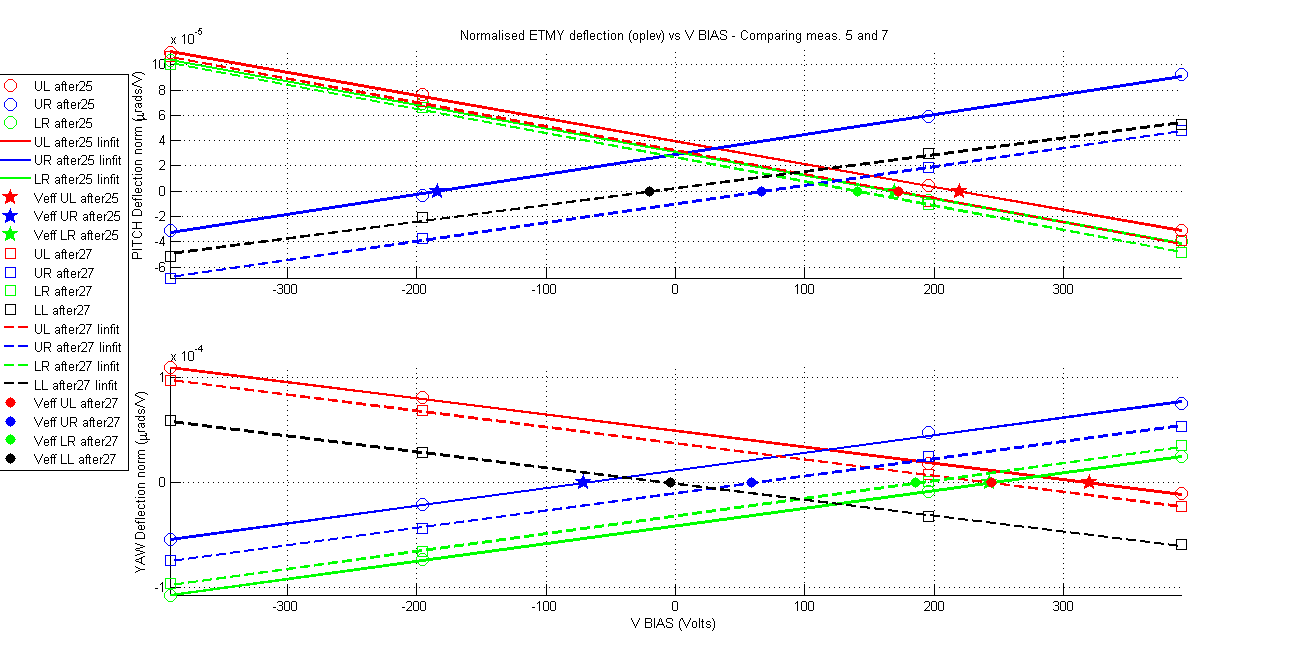
10) The strange results in measurement "after25" happened after the big power cut in the observatory and we know that the ESD HVA was having issues. Yesterday (18th of August) Richard and Filiberto had a look to the ESD HVA power supply and saw no obvious issue. They tested the different ESD HVA outputs and all was fine. However it was suspected that the reason for the powering off of the ESD HVA power supply was that the cold cathode of the pressure system dedicated to the ESD HVA power supply did not turn on since the power cut so this would be enough reason to trigger the power shut of the ESD HVA power supply. Once Richard and Filiberto restarted the cold cathode the ESD was running fine again so I took another measurement of ETMY charge with the proper cable configuration, this is labeled "after27". Again the measurements results are attached to this entry. The results are summary in the next table and compared with the last measurement (after25):
|
|
UL - 25 |
UL - 27 |
UR - 25 |
UR -27 |
LR - 25 |
LR -27 |
|
Veff PITCH [V] |
220 |
172 |
-184 |
66 |
169 |
141 |
|
PITCH slope [10-7 µrad/V] |
-1.8133 |
-1.8914 |
1.5825 |
1.4807 |
-1.8588 |
-1.9162 |
|
Veff YAW [V] |
320 |
244 |
-71 |
59 |
242 |
186 |
|
YAW slope [10-7 µrad/V] |
-1.5542 |
-1.5477 |
1.6861 |
1.6539 |
1.6895 |
1.6863 |
The plots attached here show that the slops are again parallel to previous measurements. So it may be safe to think that something related with the ESD HVA drive affected the measurements labeled "after25". If we ignore those measurements then we observe that the charge of the quadrant that changed sign (UR) as been increasing, while the other quadrants (UL and LR) have decreased charge slightly consistently both in pitch and yaw. However the ion pump is still running and the same is the case of the iluminators and the cold cathode. Why the mass being discharge then? It can still be the effect of the ion pump on the ETMY charge trying to reach an equilibrium.
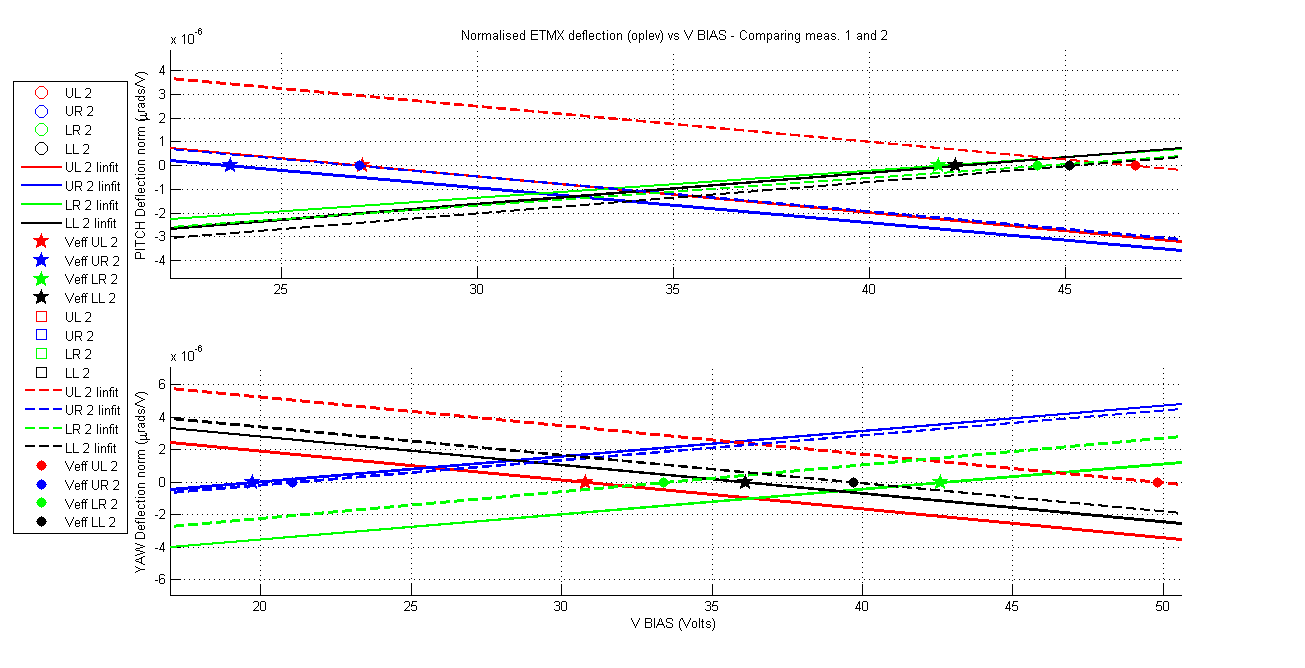
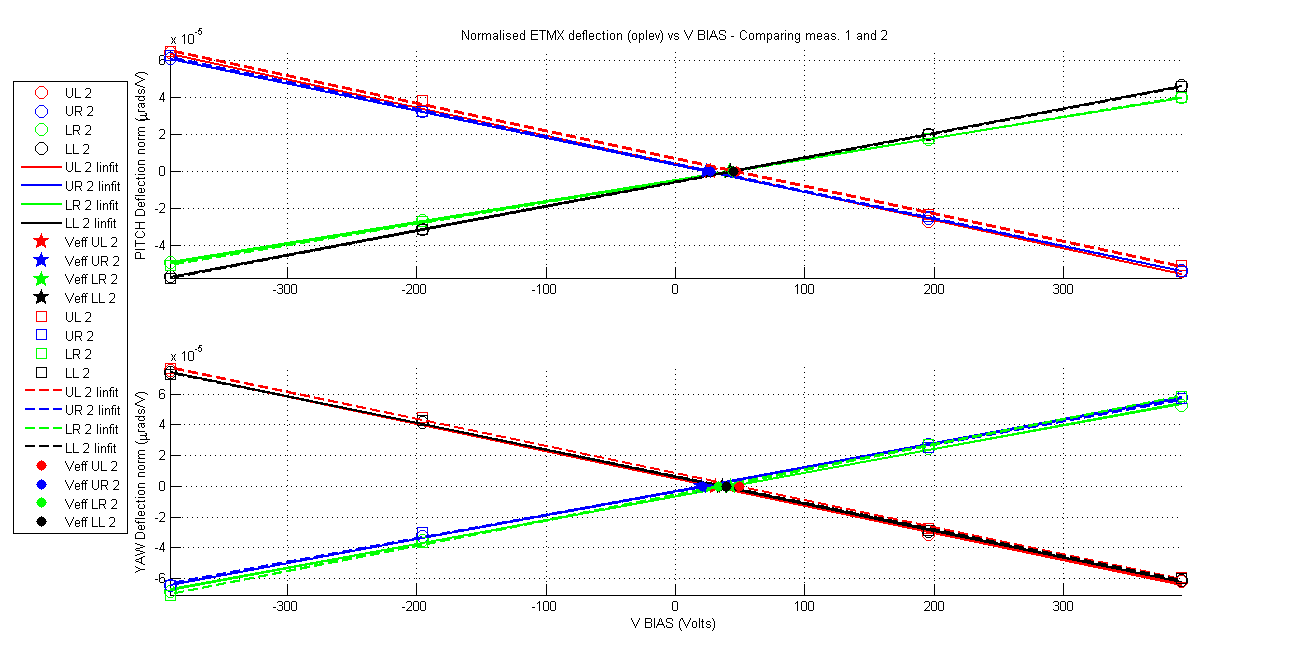
11) If charge measurements in ETMY was not headache enough, I finally got ETMX available for measurements so I run two measurements 3 days apart. This time no problem was obserbed on the driving of any of its ESD quadrants. And even better; there are no iluminators, the ion pum gate valve was closed since the venting that took place at ETMX between 3 and 4 ago, however the cold cathode is ON. Attached here are the results of the measurements for ETMX, including comparison plots but next I show the summary table:
|
|
UL - 1 |
UL - 2 |
UR – 1 |
UR - 2 |
LR - 1 |
LR - 2 |
LL - 1 |
LL - 2 |
|
Veff PITCH [V] |
27 |
47 |
24 |
27 |
42 |
44 |
42 |
45 |
|
PITCH slope [10-7 µrad/V] |
-1.5217 |
-1.4957 |
-1.4697 |
-1.4823 |
1.1381 |
1.1597 |
1.320 |
1.3208 |
|
Veff YAW [V] |
31 |
50 |
20 |
21 |
43 |
33 |
36 |
40 |
|
YAW slope [10-7 µrad/V] |
-1.7726 |
-1.7629 |
1.5631 |
1.5270 |
1.5498 |
1.6476 |
-1.7523 |
-1.7287 |
All is good news in this comparison table. First, the ETMX charge is very small and second, the charge measurements are repeatable even after three days. Only quadrant UL seems to show an appreciable charge increase equally consistent in both Pitch and Yaw. So this results seems to indicate that the cold cathode does not charge the masses.
After the above results, ETMX has become a very good test bed to confirm ion pump charger hypothesis, but also we will be able to verify if the green light is capable of charging the mass.
12) NEAR FUTURE MEASUREMENT PLAN: As Rai W. pointed out the best shot at getting the most information from EMTX is to do the green light first followed by the ion pump. The green light is a pretty unlikely charger while the ion pump is almost expected to make trouble. That way we most likely get two usefult tests.
So hopefully tomorrow (20th August) I will be turning on green light at ETMX at a power of 50mW (espected resonant power of green light during aLIGO operation). The green light will be running for 1 day and then I will take measurements on the 21st August. At the same time we need to replace the power supply for the ion pump in ETMX which died on the 15th of August after the power cut. Kyle has found a replacement so this will be possible to be done tomorrow. So that on the 21st of August I will be able to turn off the green light and open the gate valve of the ion pump keep it open for 1 day and then meausre charge on the 22nd August.
Also tomorrow we will be turning on the turbo pumps in ETMY and close the gate valve of the ion pump and then monitor the effect that this has on the charge of the ETMY mass.
So hopefully by Saturday the 23rd August I will make a new aLOG entry with the compilation of all these new measurements, and hopefully we will have a more clear picture of what is going on.
Another thing that will give us more light on the various hypotheses about the physics that might be going on at the surface of the test mass, is to find out the sign of the charge on the test mass. This is something I am working on at the moment. Knowing the charge which was partially neutralized by the ioninzed gas injection can give us a clue whether it is electrons from photoeffect or slow disintegration of the injected negative nitrogen ions or positive ions coming from the ion pump.