lisa.barsotti@LIGO.ORG - posted 00:00, Wednesday 10 September 2014 (13853)
New plotting tool for lock loss science
Jamie, Lisa
Jamie improved the tool he adapted from SEI to be able to plot multiple channels and rescale the axis all at the same time. It is now ready for public consumption.
The script which does the magic lives here:/opt/rtcds/userapps/release/sys/common/scripts/lockloss.
usage: lockloss plot [-h] [-w WINDOW] [-c FILE] [-o FILE] time
plot specific time
positional arguments:
time GPS time to plot
optional arguments:
-h, --help show this help message and exit
-w WINDOW, --window WINDOW
plot time window in seconds (default: '[-240, 5]')
-c FILE, --chanfile FILE
file with list of channels to plot, 1 per line ('-'
for stdin)
-o FILE, --outfile FILE
save plot to file
This is an example which uses a list of channels stored in my PRMI config file with some useful signals. I would be happy to attach this file to this entry, but apparently I can't.
In any case, it is just a list of channels...
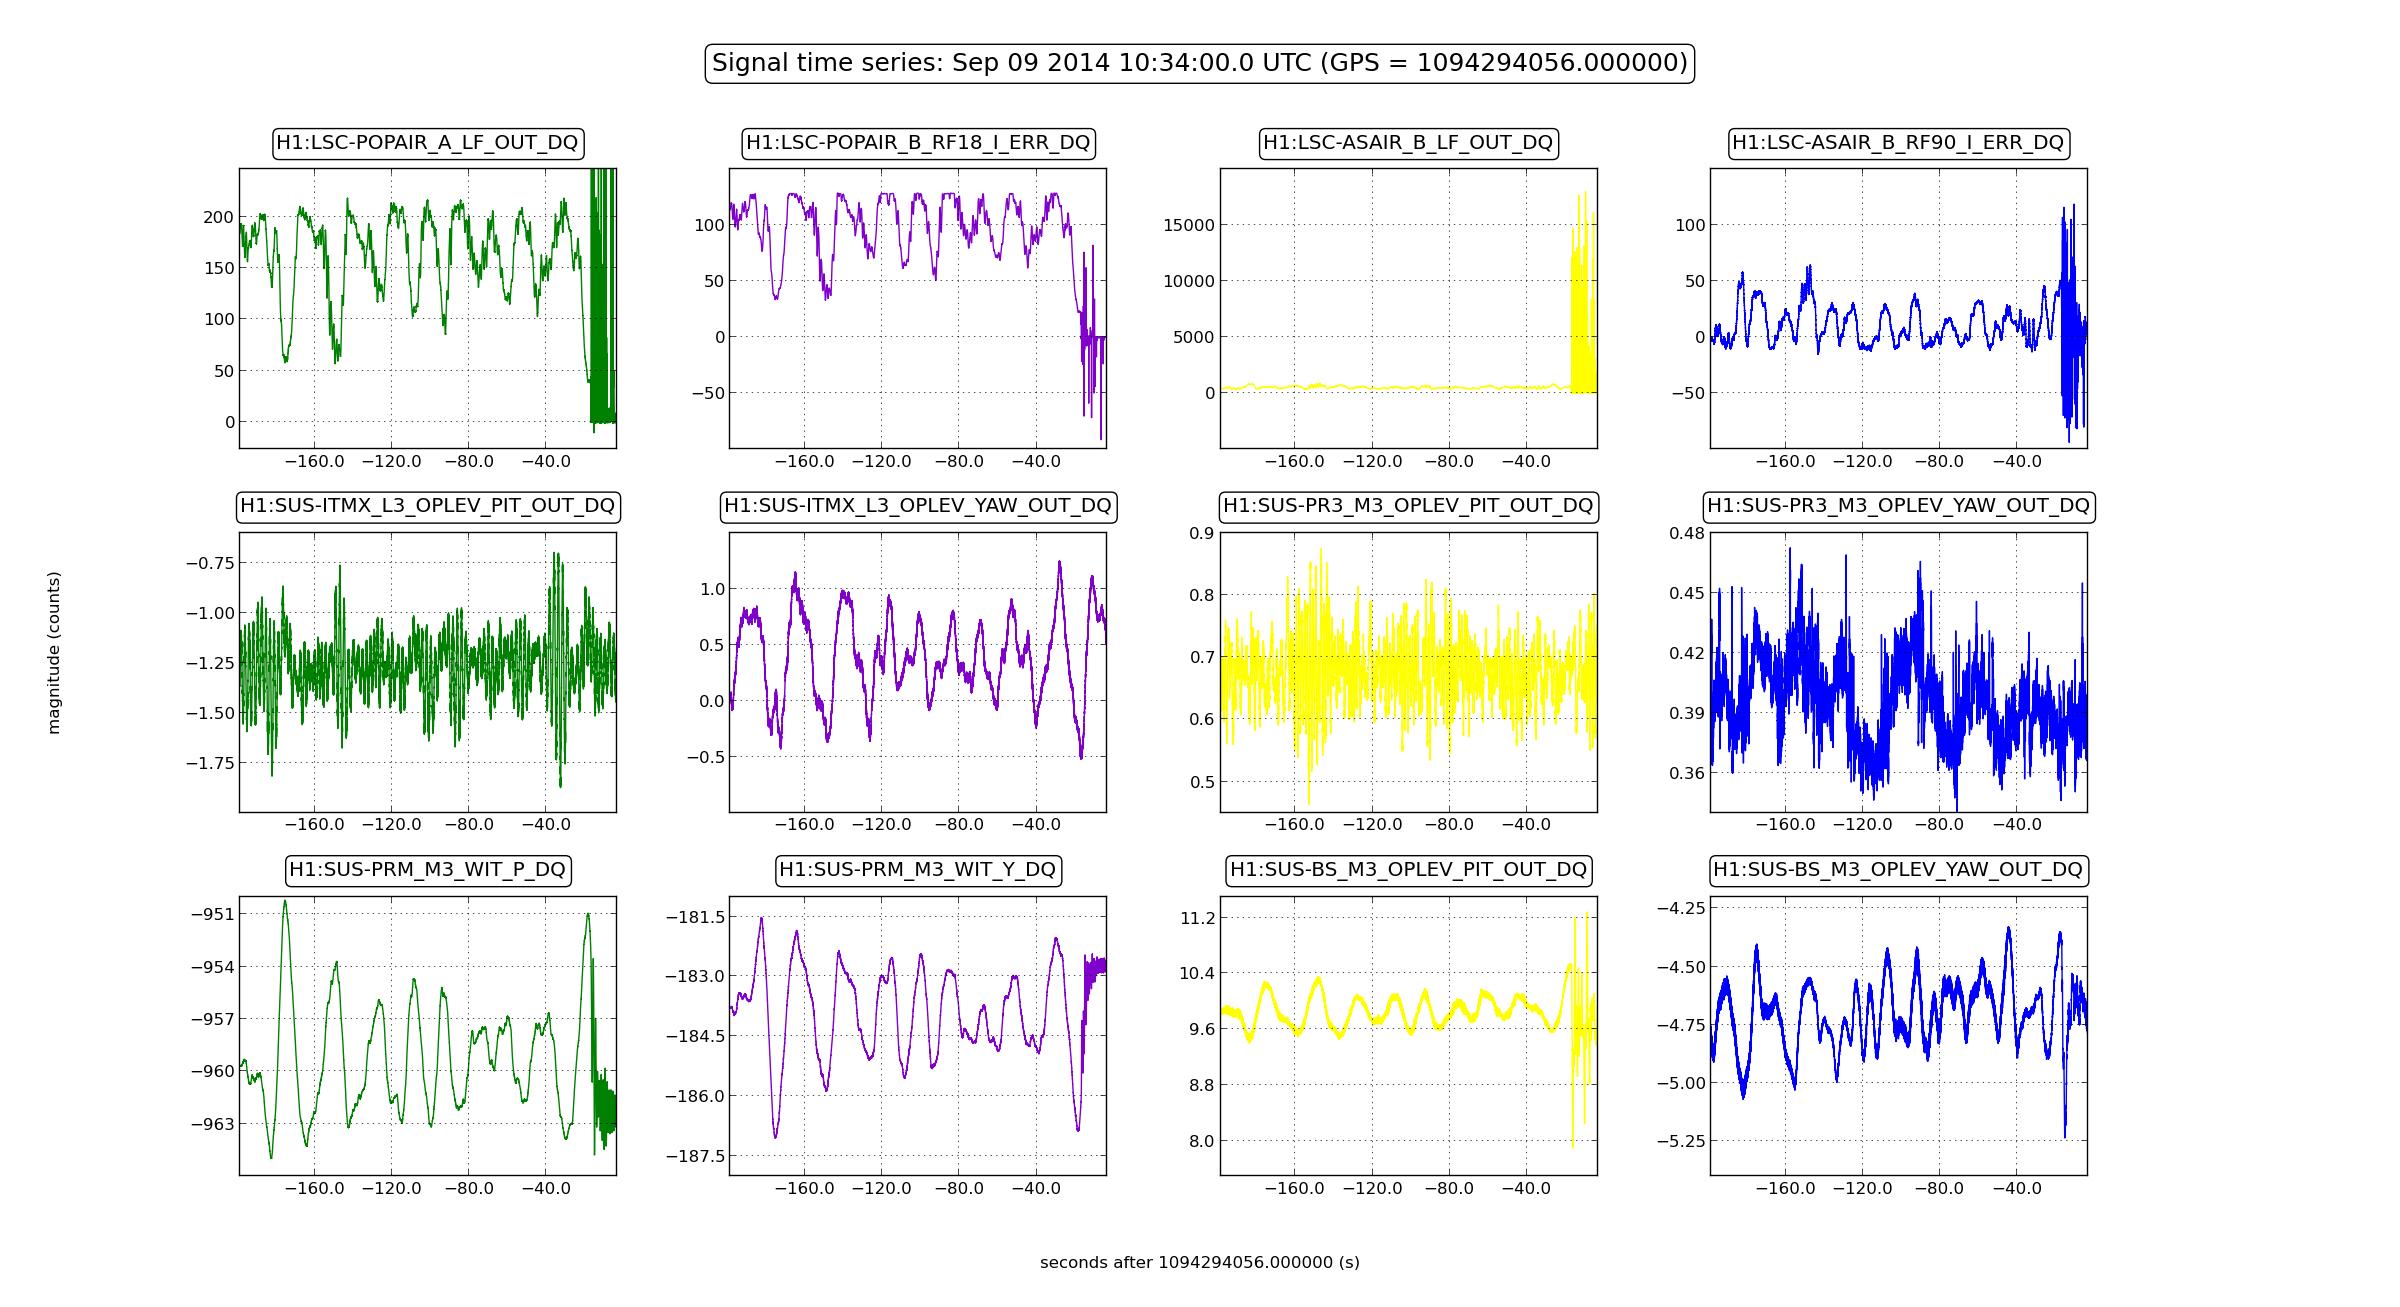
lisa.barsotti@opsws3:~$ lockloss -c ~/lockloss/PRMI plot -w '[-200, 5]' 'tconvert Sep 9 10:34 UTC'
This is the lock loss that Kiwamu reported here , where the sideband build up is dominated by a 40 mHz oscillation in ITMX YAW.
The power fluctuations are kind of huge (75%), so the fact that the PRMI unlocked is not surprising, as Kiwamu was saying.
This tools will then talk to the Guardian and automatically provide a selectable list of lock loss GPSs.
The message of this entry is that, as long as NDS2 cooperates, this tools drastically improves the way we have been doing lock loss analysis in the last decade (and any analysis which requires zooming multiple channels, really).
Images attached to this report