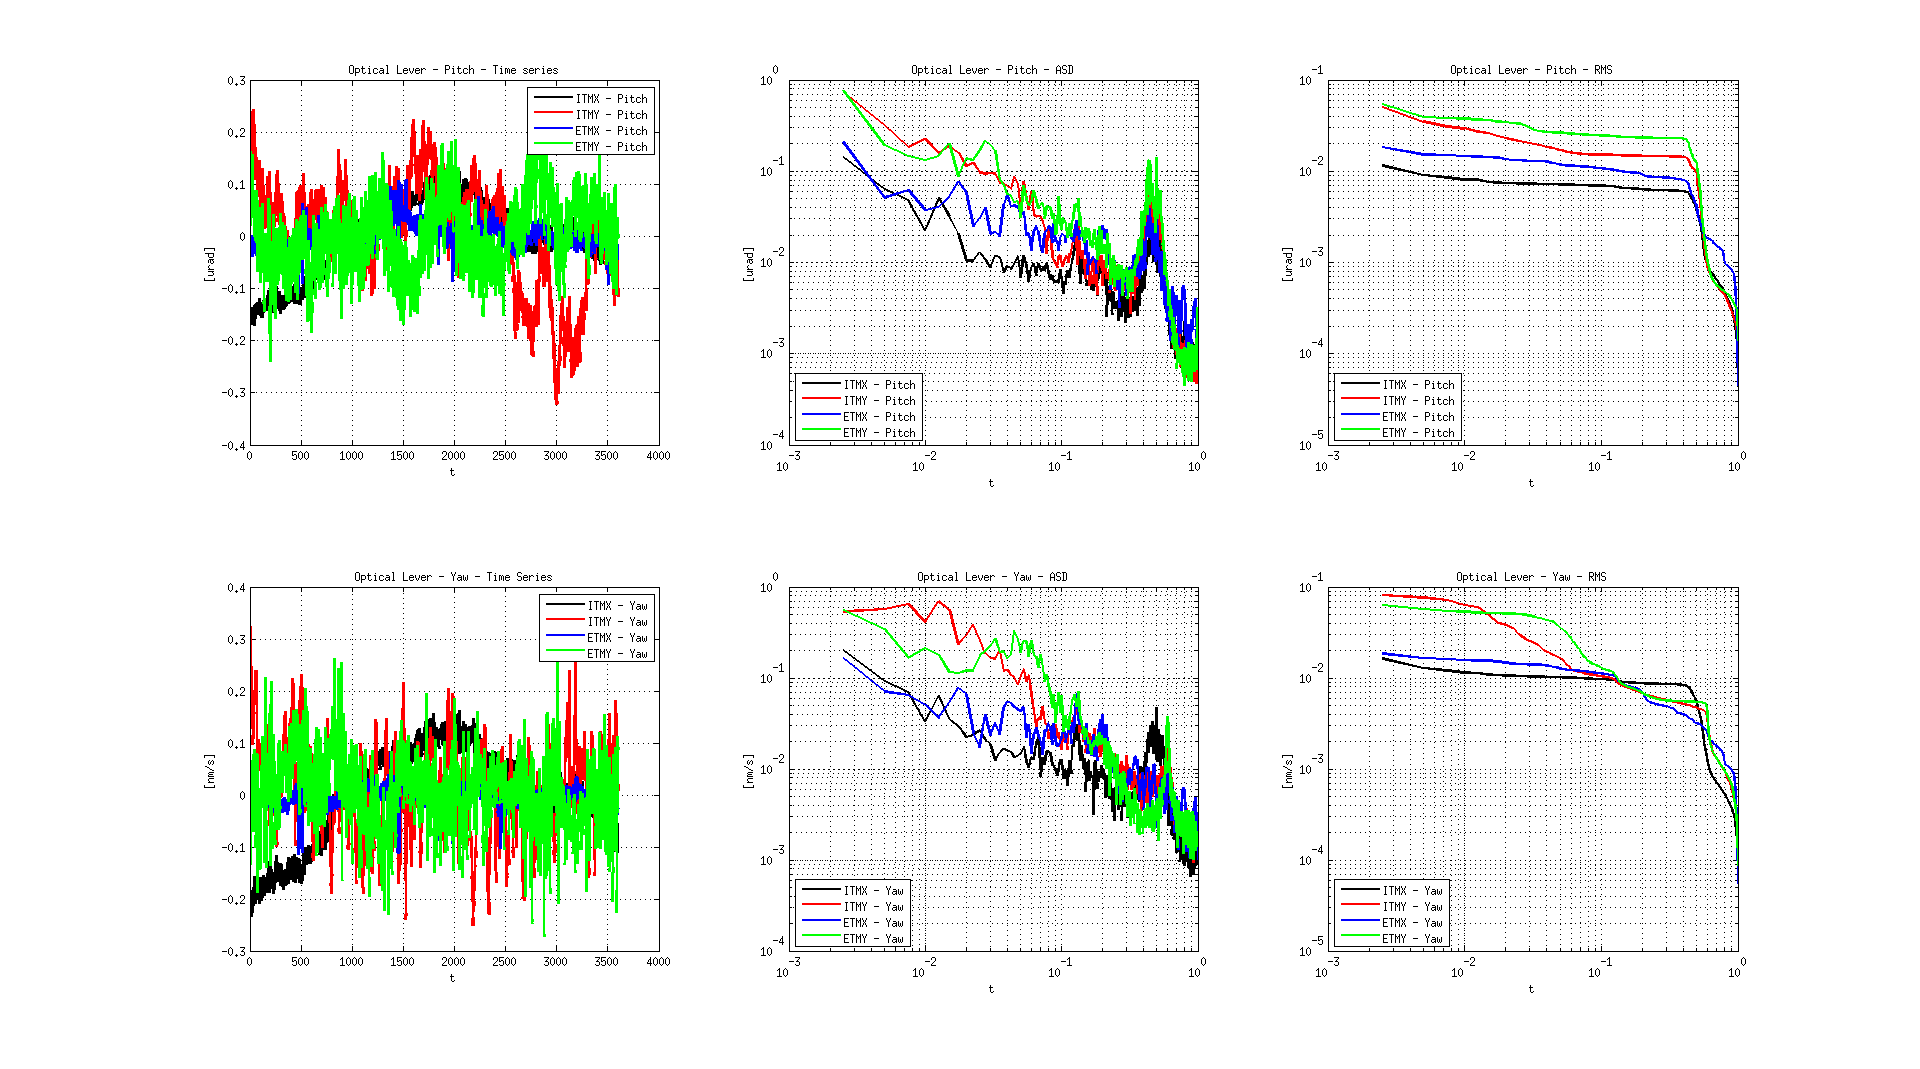
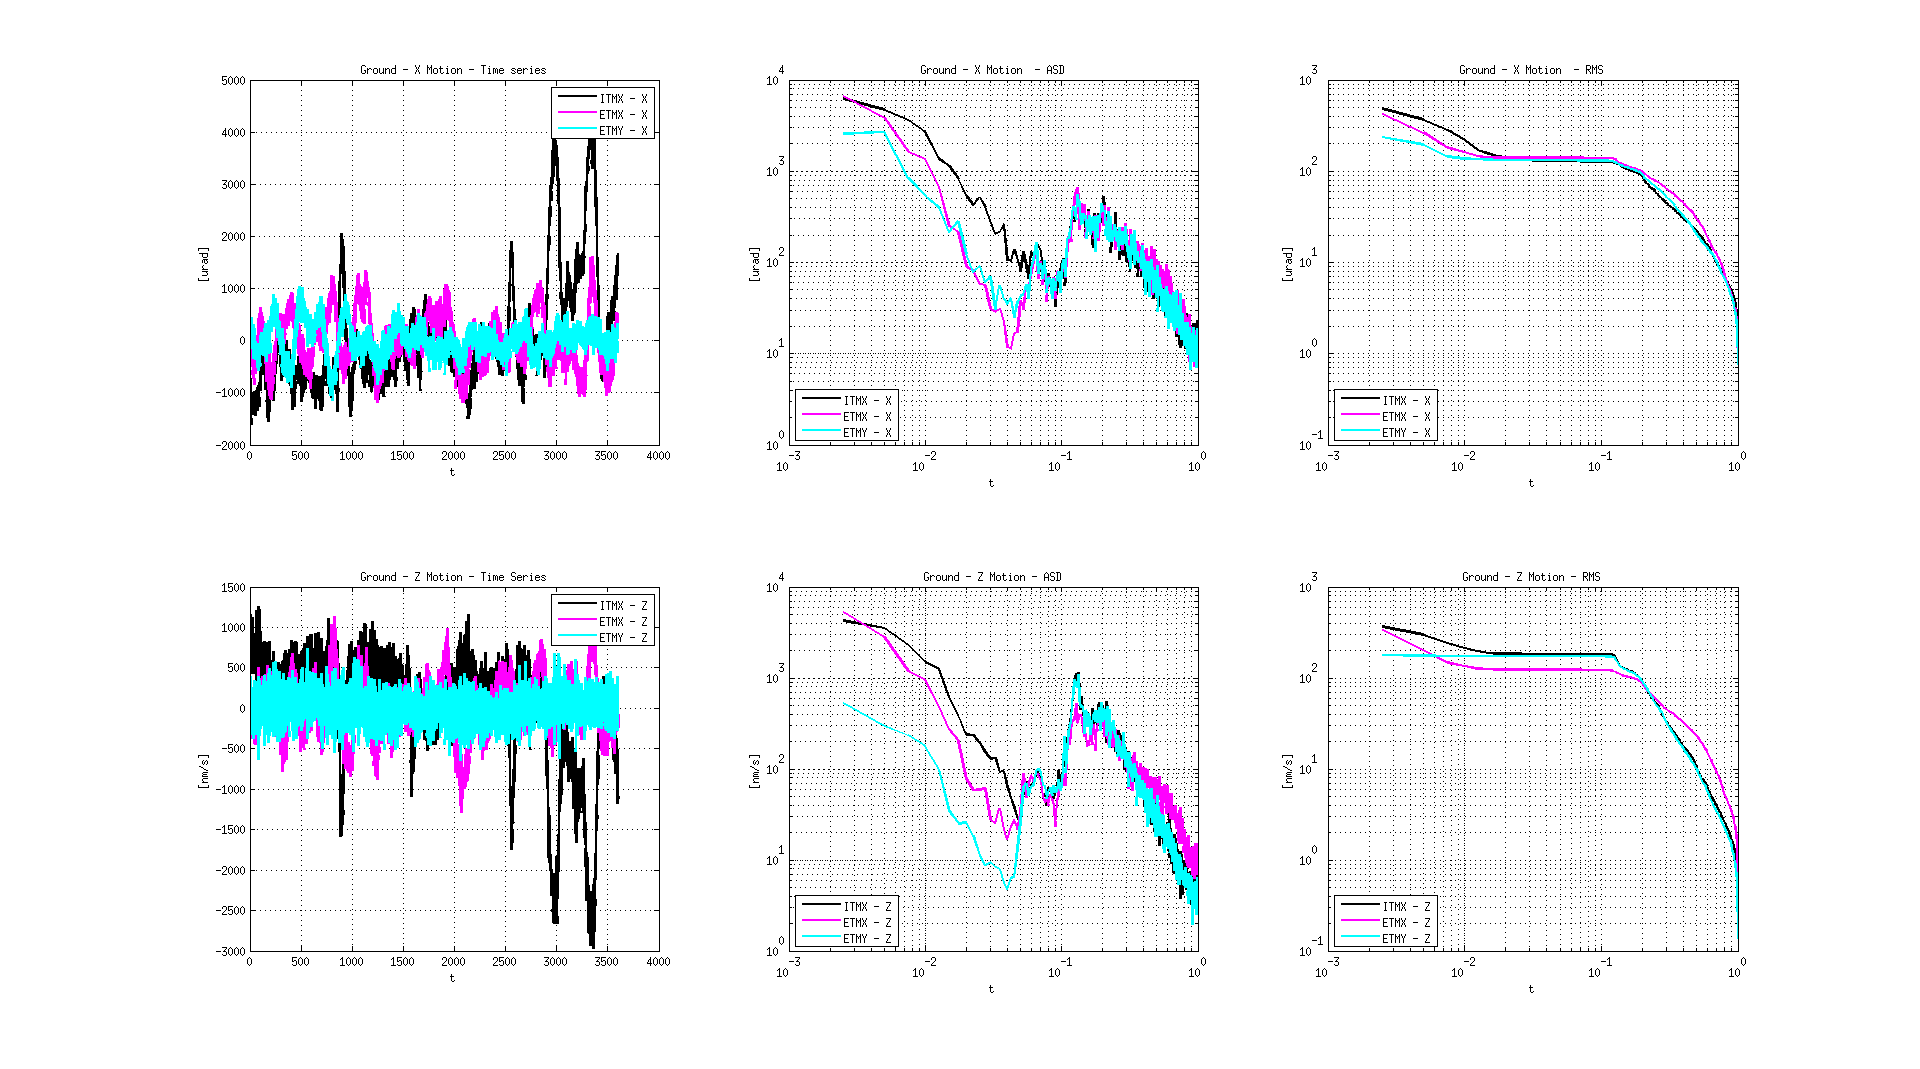
The first figure attached shows the optical levers motion, Monday at 1 am, with Stage 1 Z under 90 mHz blend.
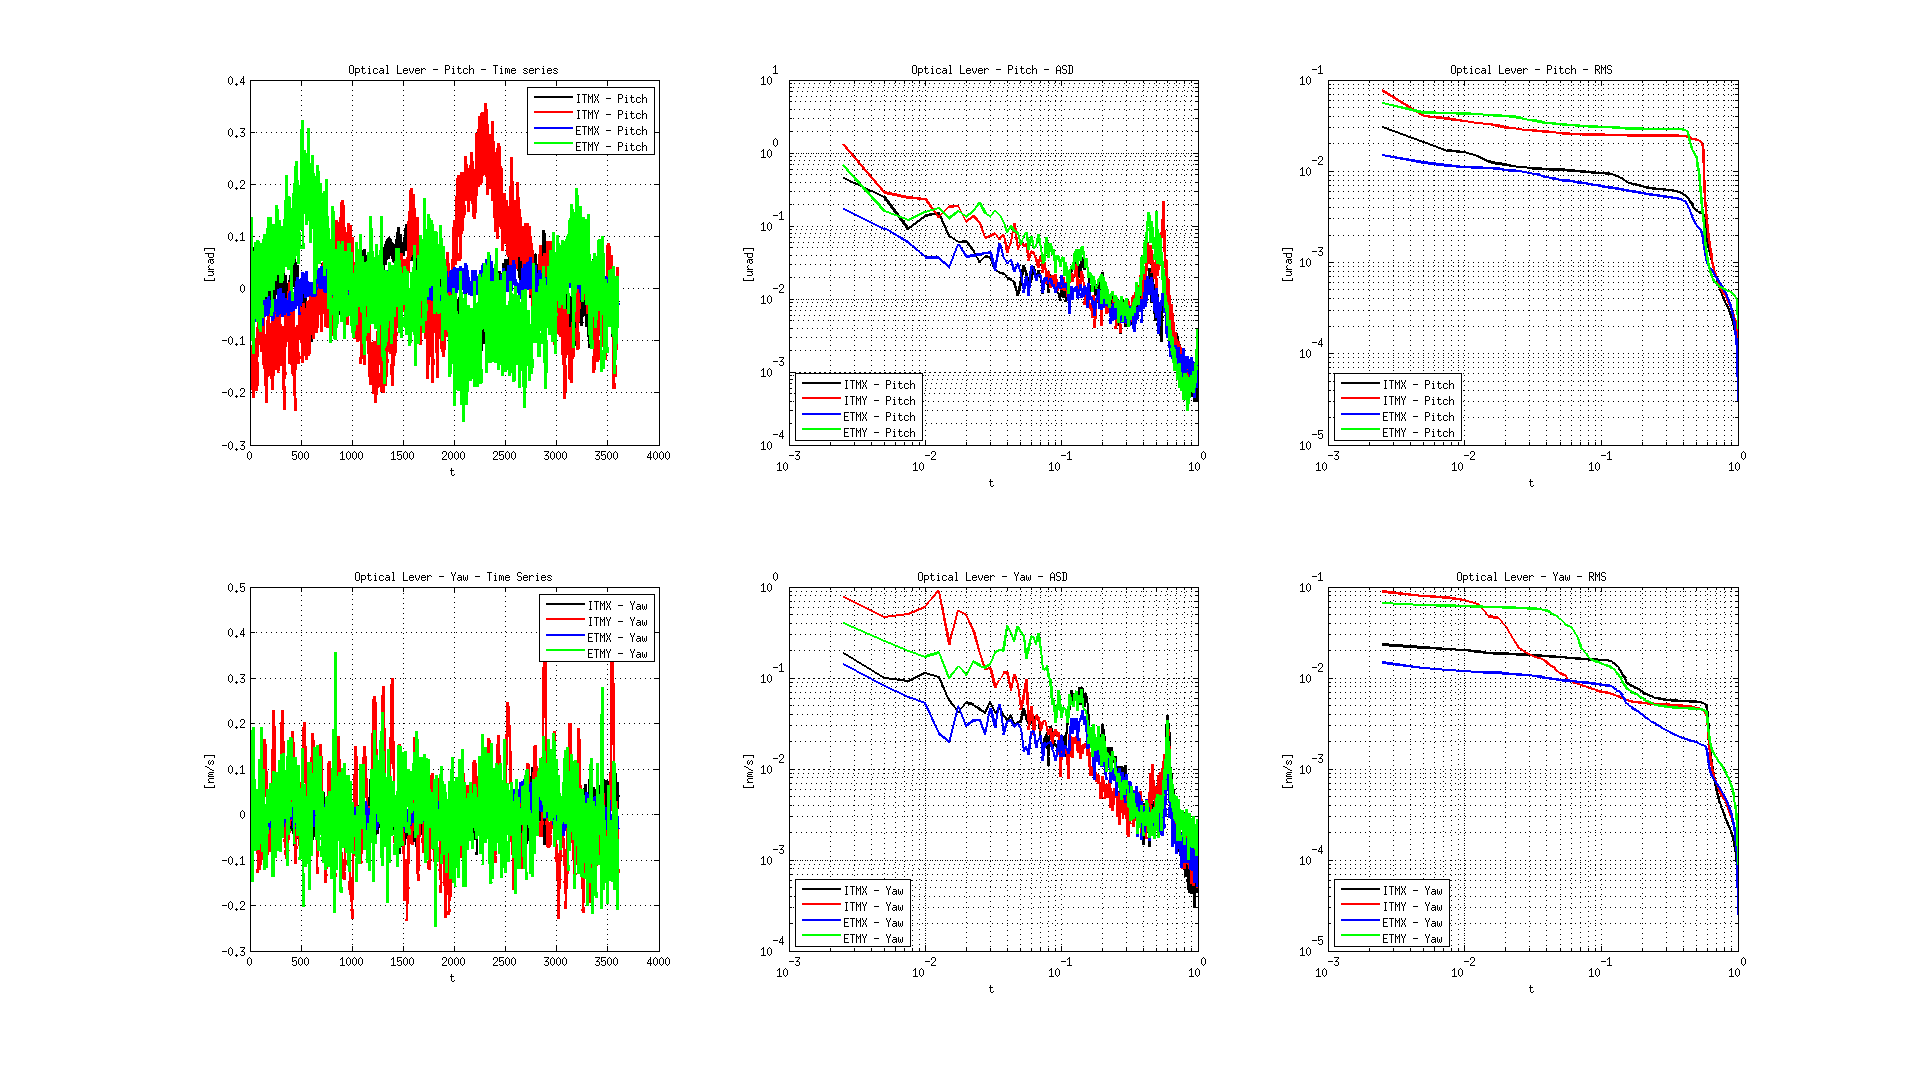
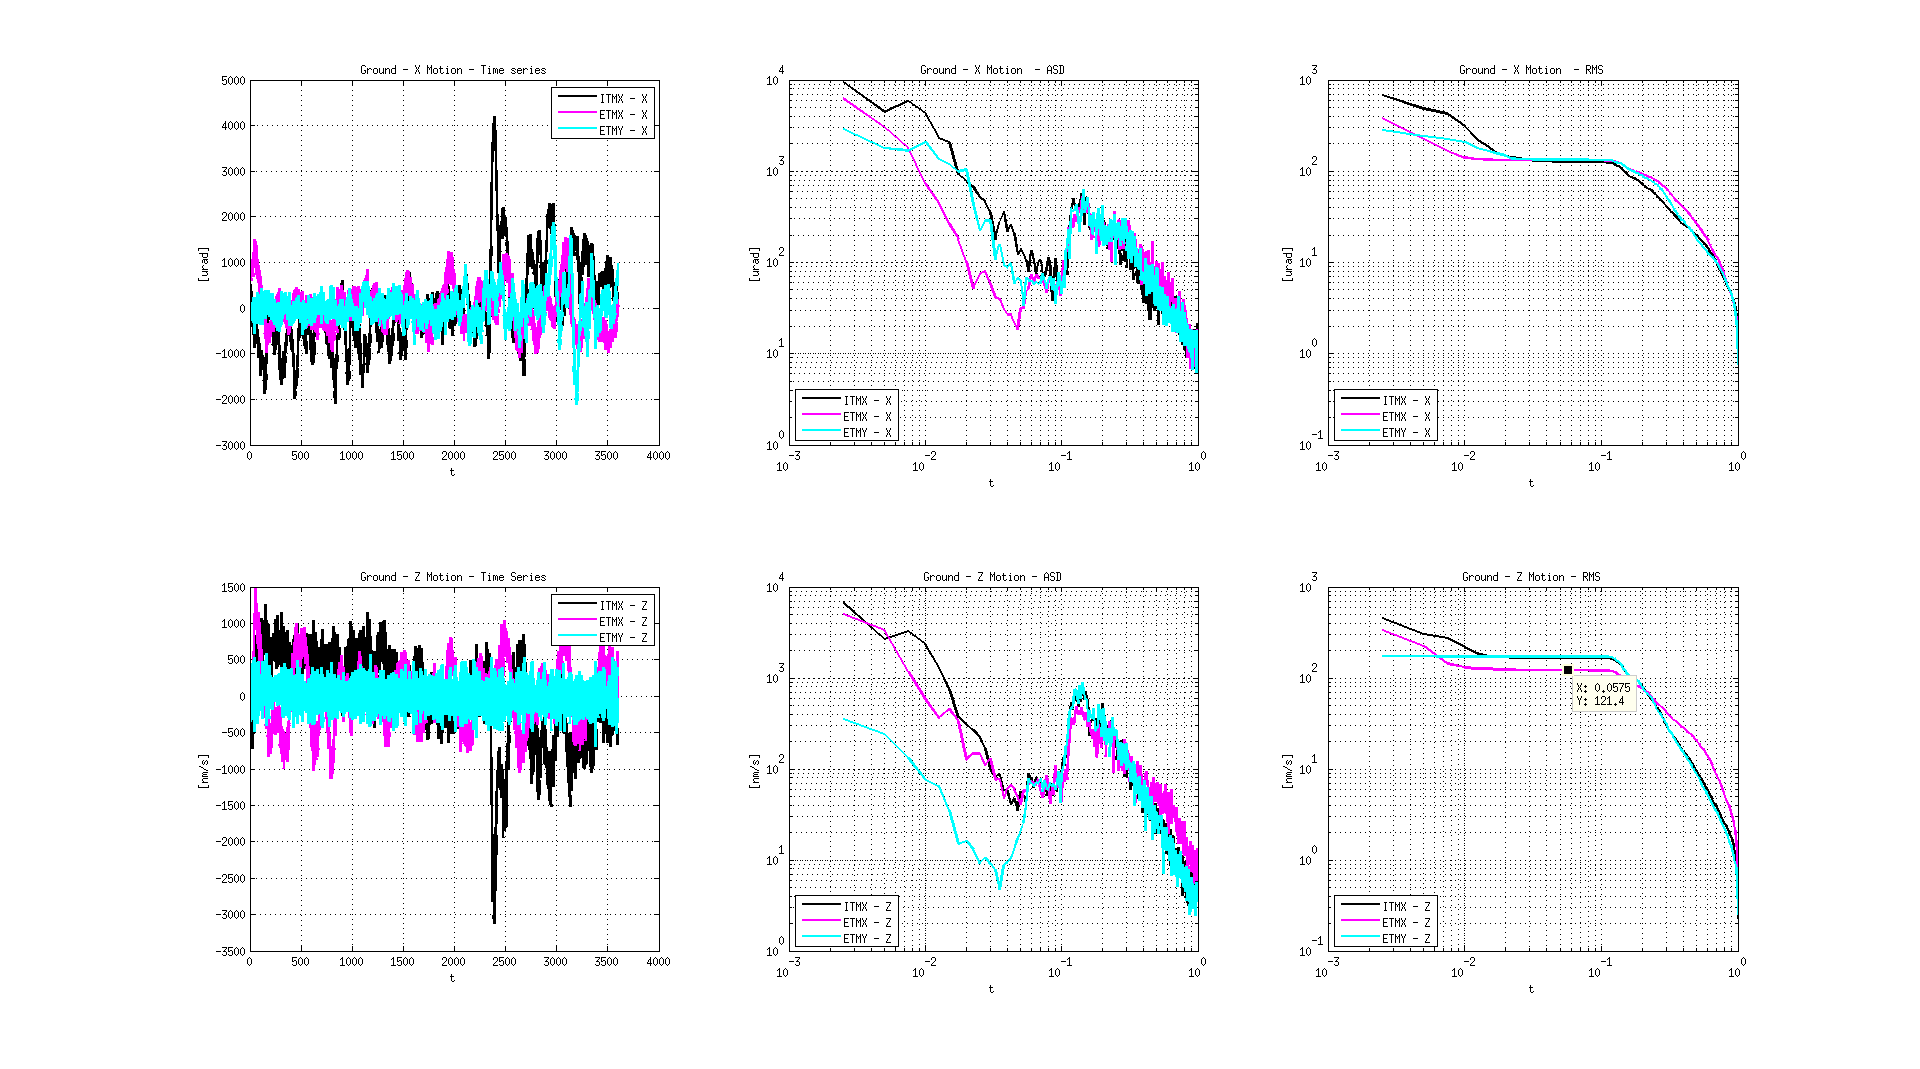
The second figure attached shows the optical levers motion, Tuesday at 1:15 am (there were some offsets applied around 1:00am), with Stage 1 Z under 750 mHz blend hoping to reduce the Yaw motion at the microseism.
The input motion was very similar for the two measurements.
- Results: All units except (ETMX) show more motion in the Z 750 mHz blend configuration, as summarized in the table below; I recommend to revert the Z blend back to 90 mHz configuration to see if the results are repeatable. This can be done any time as both configurations provide similar performance anyhow (-> when it is the least disruptive for IFO locking activities),
- Other comment: it would be good to find out why ITMY and ETMY rms are dominated by features below the micro-seism (poor tilt decoupling? noisy sensor?). This is true in both blend configurations shown in these plots.
RMS value of the optical levers down to 10 mHz:
Pitch (90mHz Z blend) Pitch (750mHz Z blend) Yaw (90mHz Z blend) Yaw (750mHz Z blend)
ITMX 8 nRad 16 nRad 11 nRad 20 nRad
ITMY 29 nRad 35 nRad 63 nRad 71 nRad
ETMX 15 nRad 11 nRad 16 nRad 12 nRad
ETMY 37 nRad 43 nRad 53 nRad 62 nRad