As reported in the previous alog (alog 14602), I analyzed several locking events in which the LSC controllers attempted to lock the DRMI.
All the data were taken before we made the improvement (alog 14602) in order to study how to make locking faster. The idea was to collect many cases such that we can try to understand what is going on in lock acquisition.
In summary:
- I picked up 44 locking events between 0:06:00 to 1:06:00 in Oct-23 2014 UTC (see attachement 1)
-
22 events were categoryzed to be distinct events that were close to catch the DRMI. I call them class 1. (see attachement 2)
- =>Out of 22, there were 2 events in which we suceeded in locking DRMI. Each lasted for roughly 15 min or so.
- The rest of 22 events were determined to be events where the SRCL was too far in its displacement so that the SRCL control went in vain. I call them class 2. (see attachment 3)
-
Effectively, the downtime was about 30 min or so in this specific period of time.
- => this means that there were roughly one or two times of class 1 events per 2 min. But, success probability for each event was as low as 10 % which could make the downtime as long as order of 10 min.
-
A reason why it was not locking in class 1 was that the duration when SRCL was within the linear range was too short.
- => this may be improved by reviewing the SRCL loop design such that the loop reacts more quickly with less saturation in the DACs.
Analysis of class 1 events
Class 1 events were defined to be the ones which showed high POP RF18 vaules (> 100 uW) for more than 0.2 sec and showed high AS RF90 values of more than 2000 counts when POP RF18 was also high.
The plot shown below is a x-y projectin of POP18 and AS90 to show how these events evolved in this 2-D space:
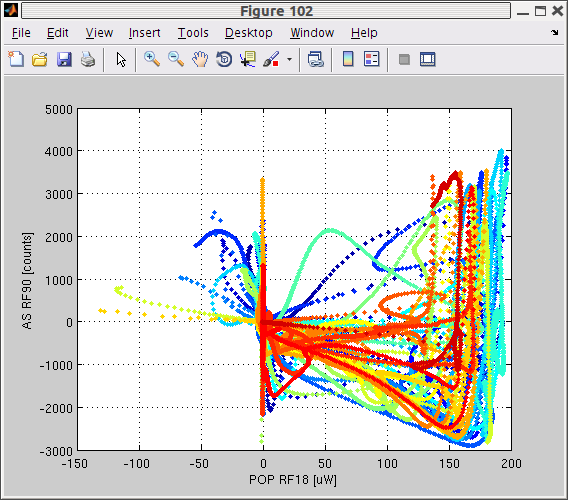
Each event has different color from some others. As shown, a typical tack of class 1 events is to go down toward lower right in the plot and then jump up to upper right relatively quickly. This means SRCL is the last degree of freedom which comes into the linear range.
Also I attach a collection of some relavent LSC signals in time series as attachement 4. As seen in the plot, the SRCL feedback saturate most of the time at the SRM DAC. This should be mitigated by some means in order to do an efficient SRCL control for locking. Also the upper right panel of the plot shows how long time SRCL stayed within the linear range. As shown, the staying time is typically order of 10 msec which is faster than the time scale of the SRCL control (~ 50 msec for the typical UGF of 20 Hz) or comparable. So this is not great.
Interestingly, most of the events showed a dip in the POPRF18 signal (upper left panel) roughly 10 msec after POP18 rose up. This may indicate some kind of misalignment as the LSC controller push the optics.
Class 2 events
They are the events in which we were not lucky enough to have the SRCL in the vicinity of the linear range. The plot below is the 2-D representation of how they evolve:
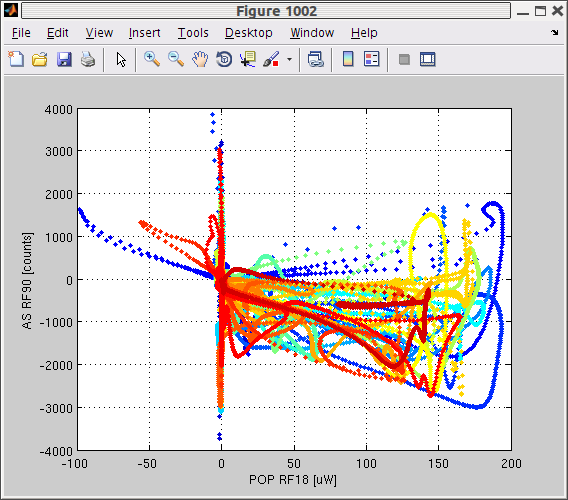
The typical track looks different from that of class 1. They stay in the lower right part of the plot most of the time.
