brett.shapiro@LIGO.ORG - posted 21:16, Wednesday 29 October 2014 (14720)
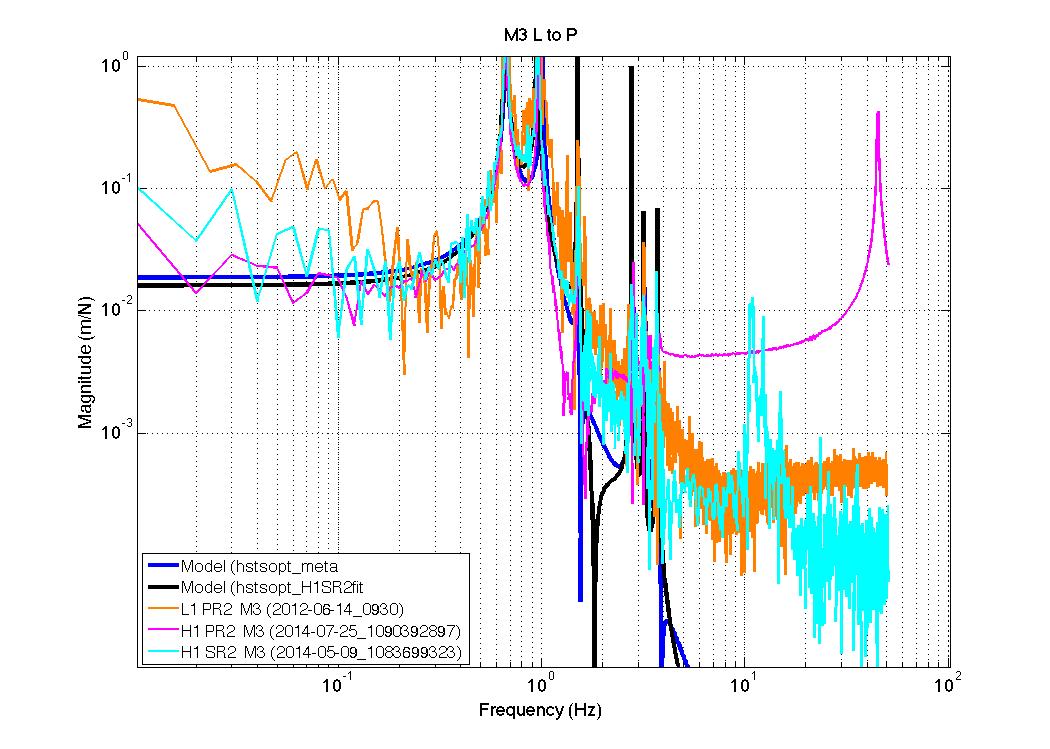
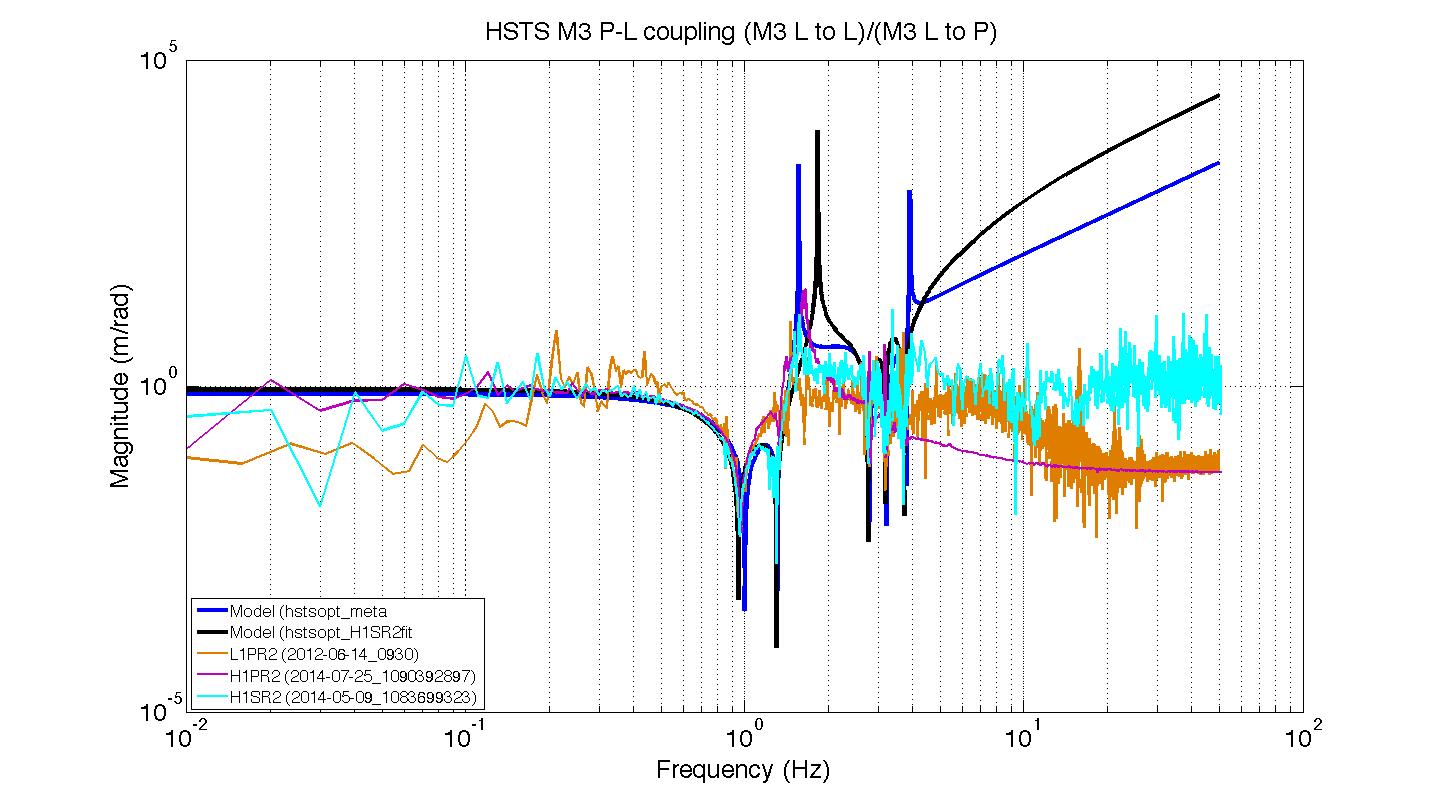
Updated parameters from H1SR2 model fitting and comparisons of M3 L-P coupling
Posting some more details on the parameter changes from the model fitting of H1SR2 discussed in 10124.

Some plots showing measured M3 length to pitch coupling against this model and the original model are also attached. The coherence is pretty poor in this data, so it is difficult to draw concolusions on which model is the better predictor of this coupling.

Parameters  |      units        |         old model       |        H1SR2 fit         |      difference       |      percent difference


 'I1x'   | kgm^2    [   0.0213]    [   0.01994]    [ -0.0013599]    '-6.38%'

 'I1y'   | kgm^2    [   0.0025]    [ 0.0027219]    [ 0.00022193]    '8.88%'

 'I1z'   | kgm^2    [   0.0216]    [  0.020356]    [ -0.0012436]    '-5.76%'

 'm2'    | kg       [    2.983]    [     2.985]    [      0.002]    '0.067%'

 'I2x'   | kgm^2    [  0.00889]    [ 0.0084199]    [-0.00047015]    '-5.29%'

 'I2y'   | kgm^2    [  0.00531]    [ 0.0050135]    [-0.00029646]    '-5.58%'

 'I2z'   | kgm^2    [  0.00635]    [ 0.0064319]    [ 8.1928e-05]    '1.29%'

 'I3x'   | kgm^2    [  0.00832]    [ 0.0080117]    [-0.00030834]    '-3.71%'

 'I3y'   | kgm^2    [   0.0054]    [ 0.0051465]    [-0.00025352]    '-4.69%'

 'I3z'   | kgm^2    [  0.00557]    [ 0.0053901]    [-0.00017987]    '-3.23%'

 'l1'    |  m       [    0.295]    [   0.30057]    [  0.0055655]    '1.89%'

 'l2'    |  m       [    0.167]    [   0.17123]    [  0.0042327]    '2.53%'

 'l3'    |  m       [     0.22]    [   0.22142]    [  0.0014169]    '0.644%'

 'kc1'   | N/m      [    179.8]    [    182.45]    [     2.6509]    '1.47%'

 'kc2'   | N/m      [   219.33]    [     212.9]    [    -6.4336]    '-2.93%'

 'd4'    |  m       [    0.001]    [-0.0006798]    [ -0.0016798]    '-168%'

 'flex1' |  m       [0.0019381]    [ 0.0019382]    [ 1.0483e-07]    '0.00541%'
Images attached to this report