mark.barton@LIGO.ORG - posted 09:45, Wednesday 05 October 2011 (1500)
New violin mode measurements on monolithic stage
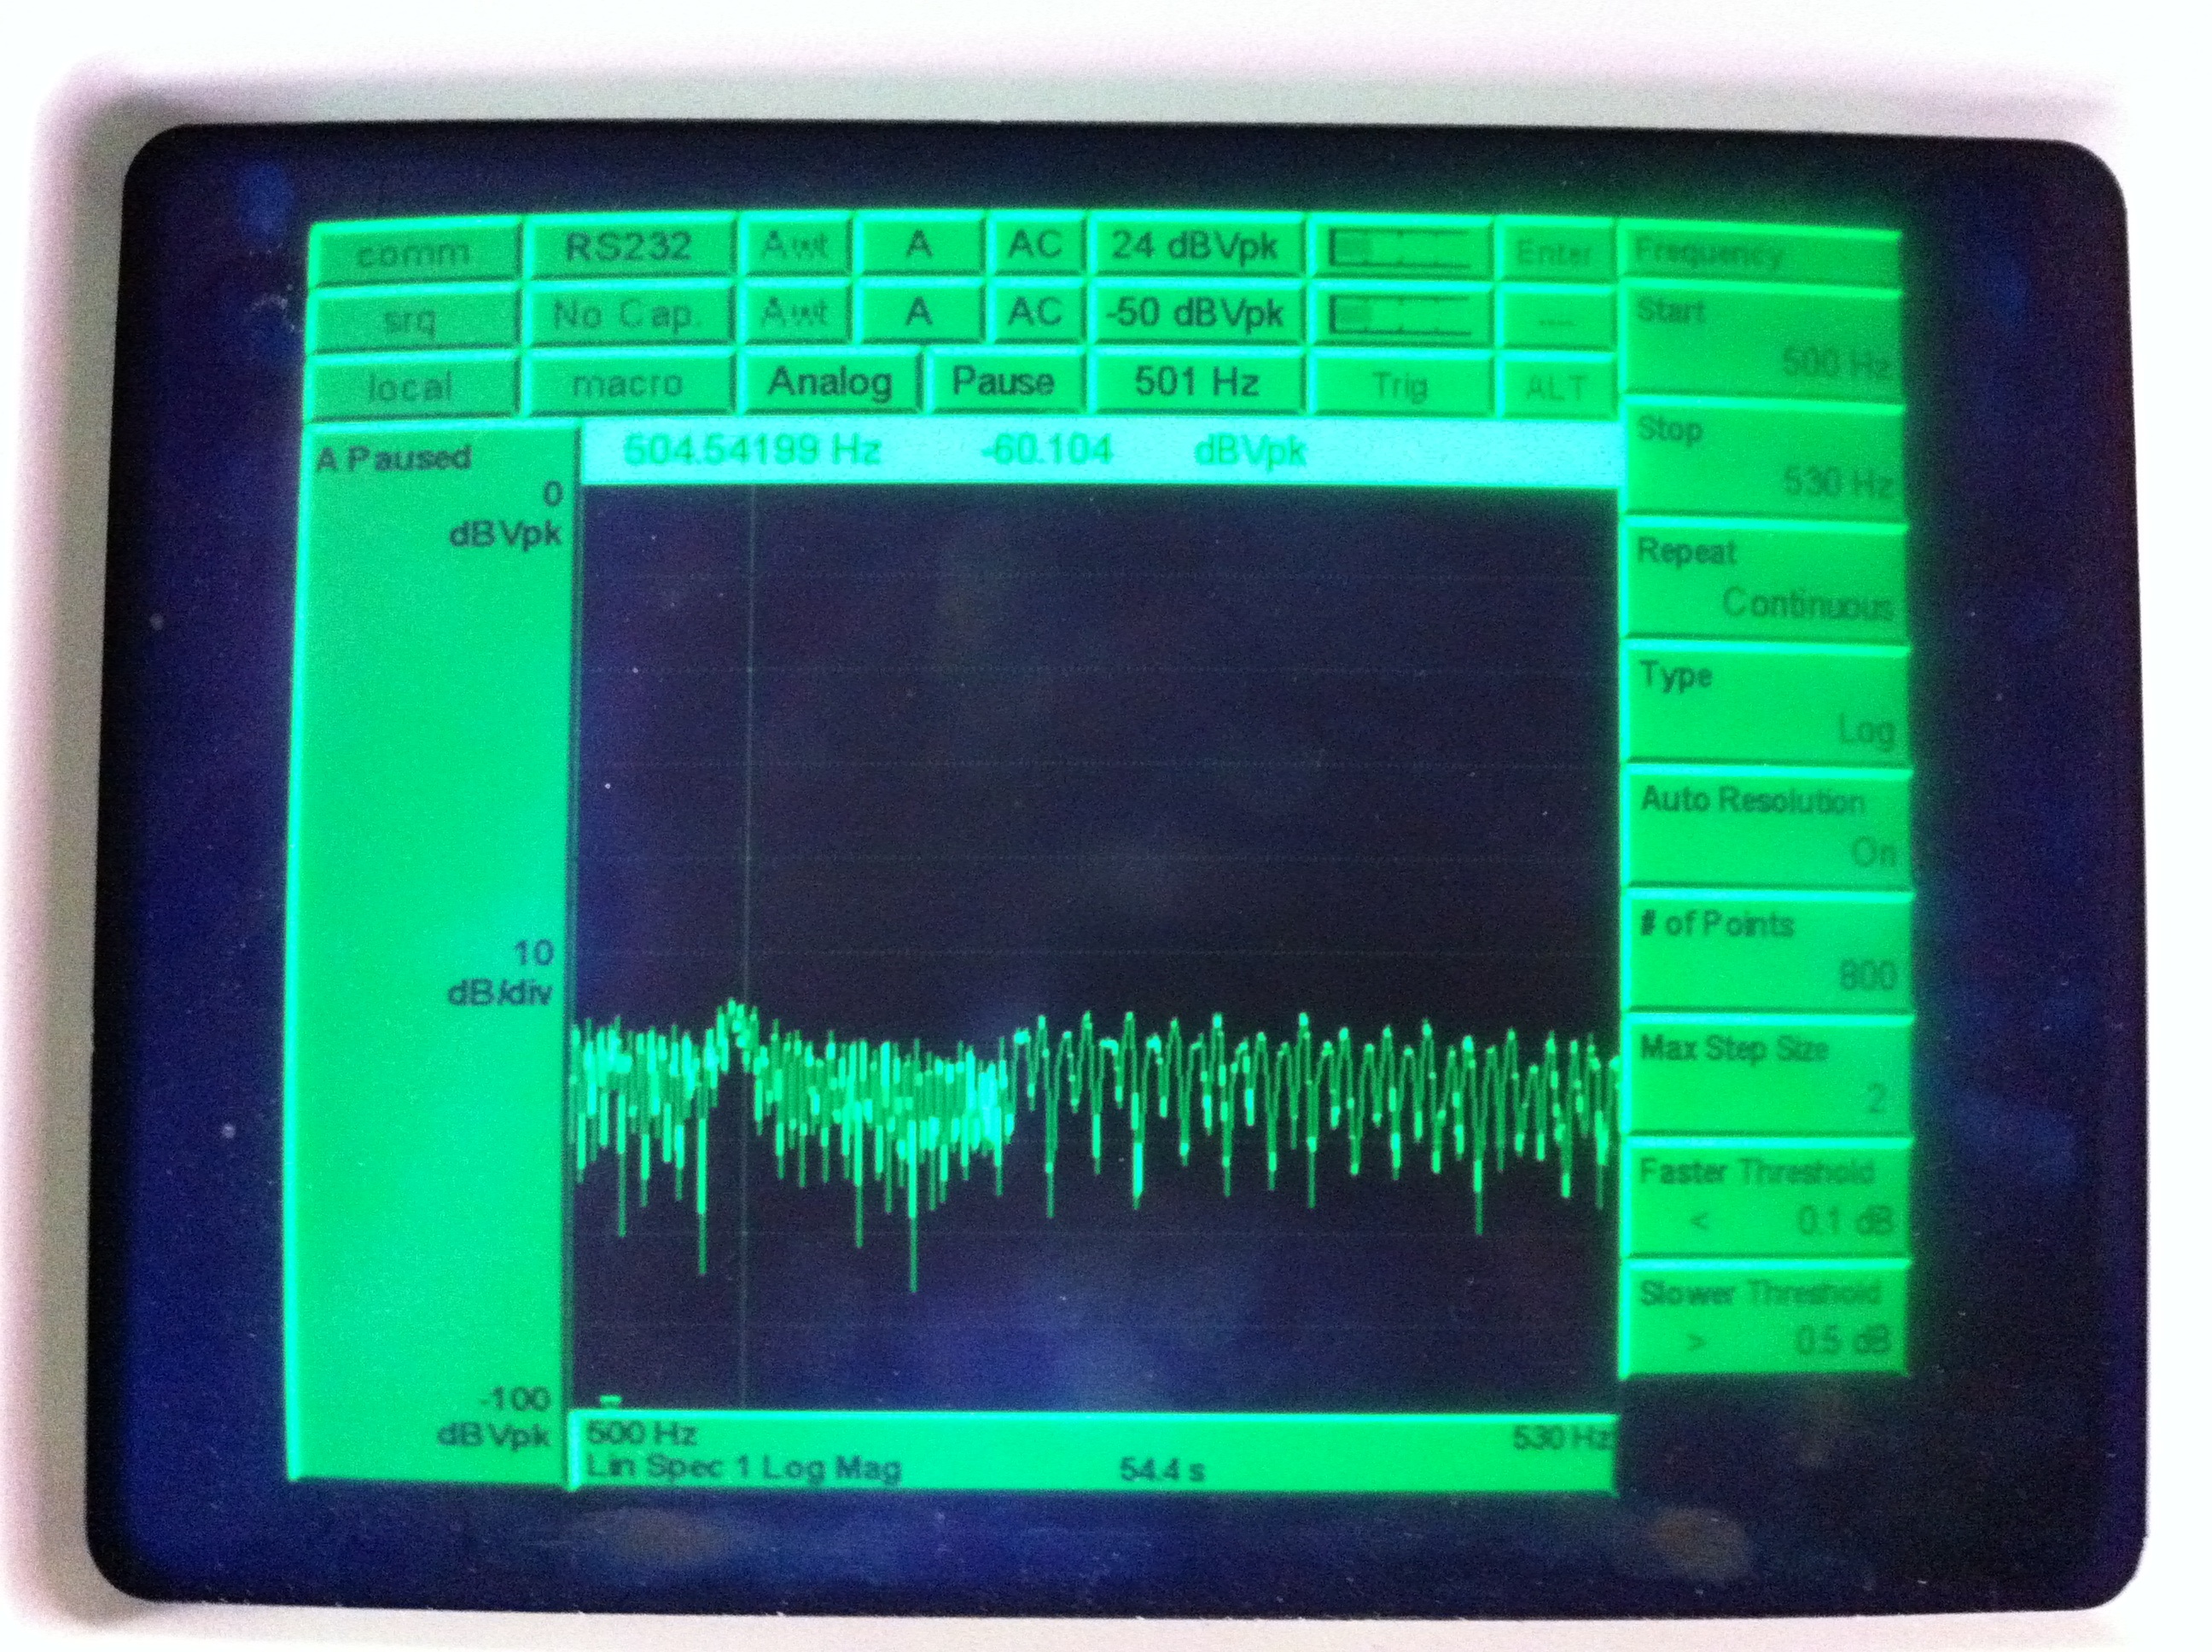
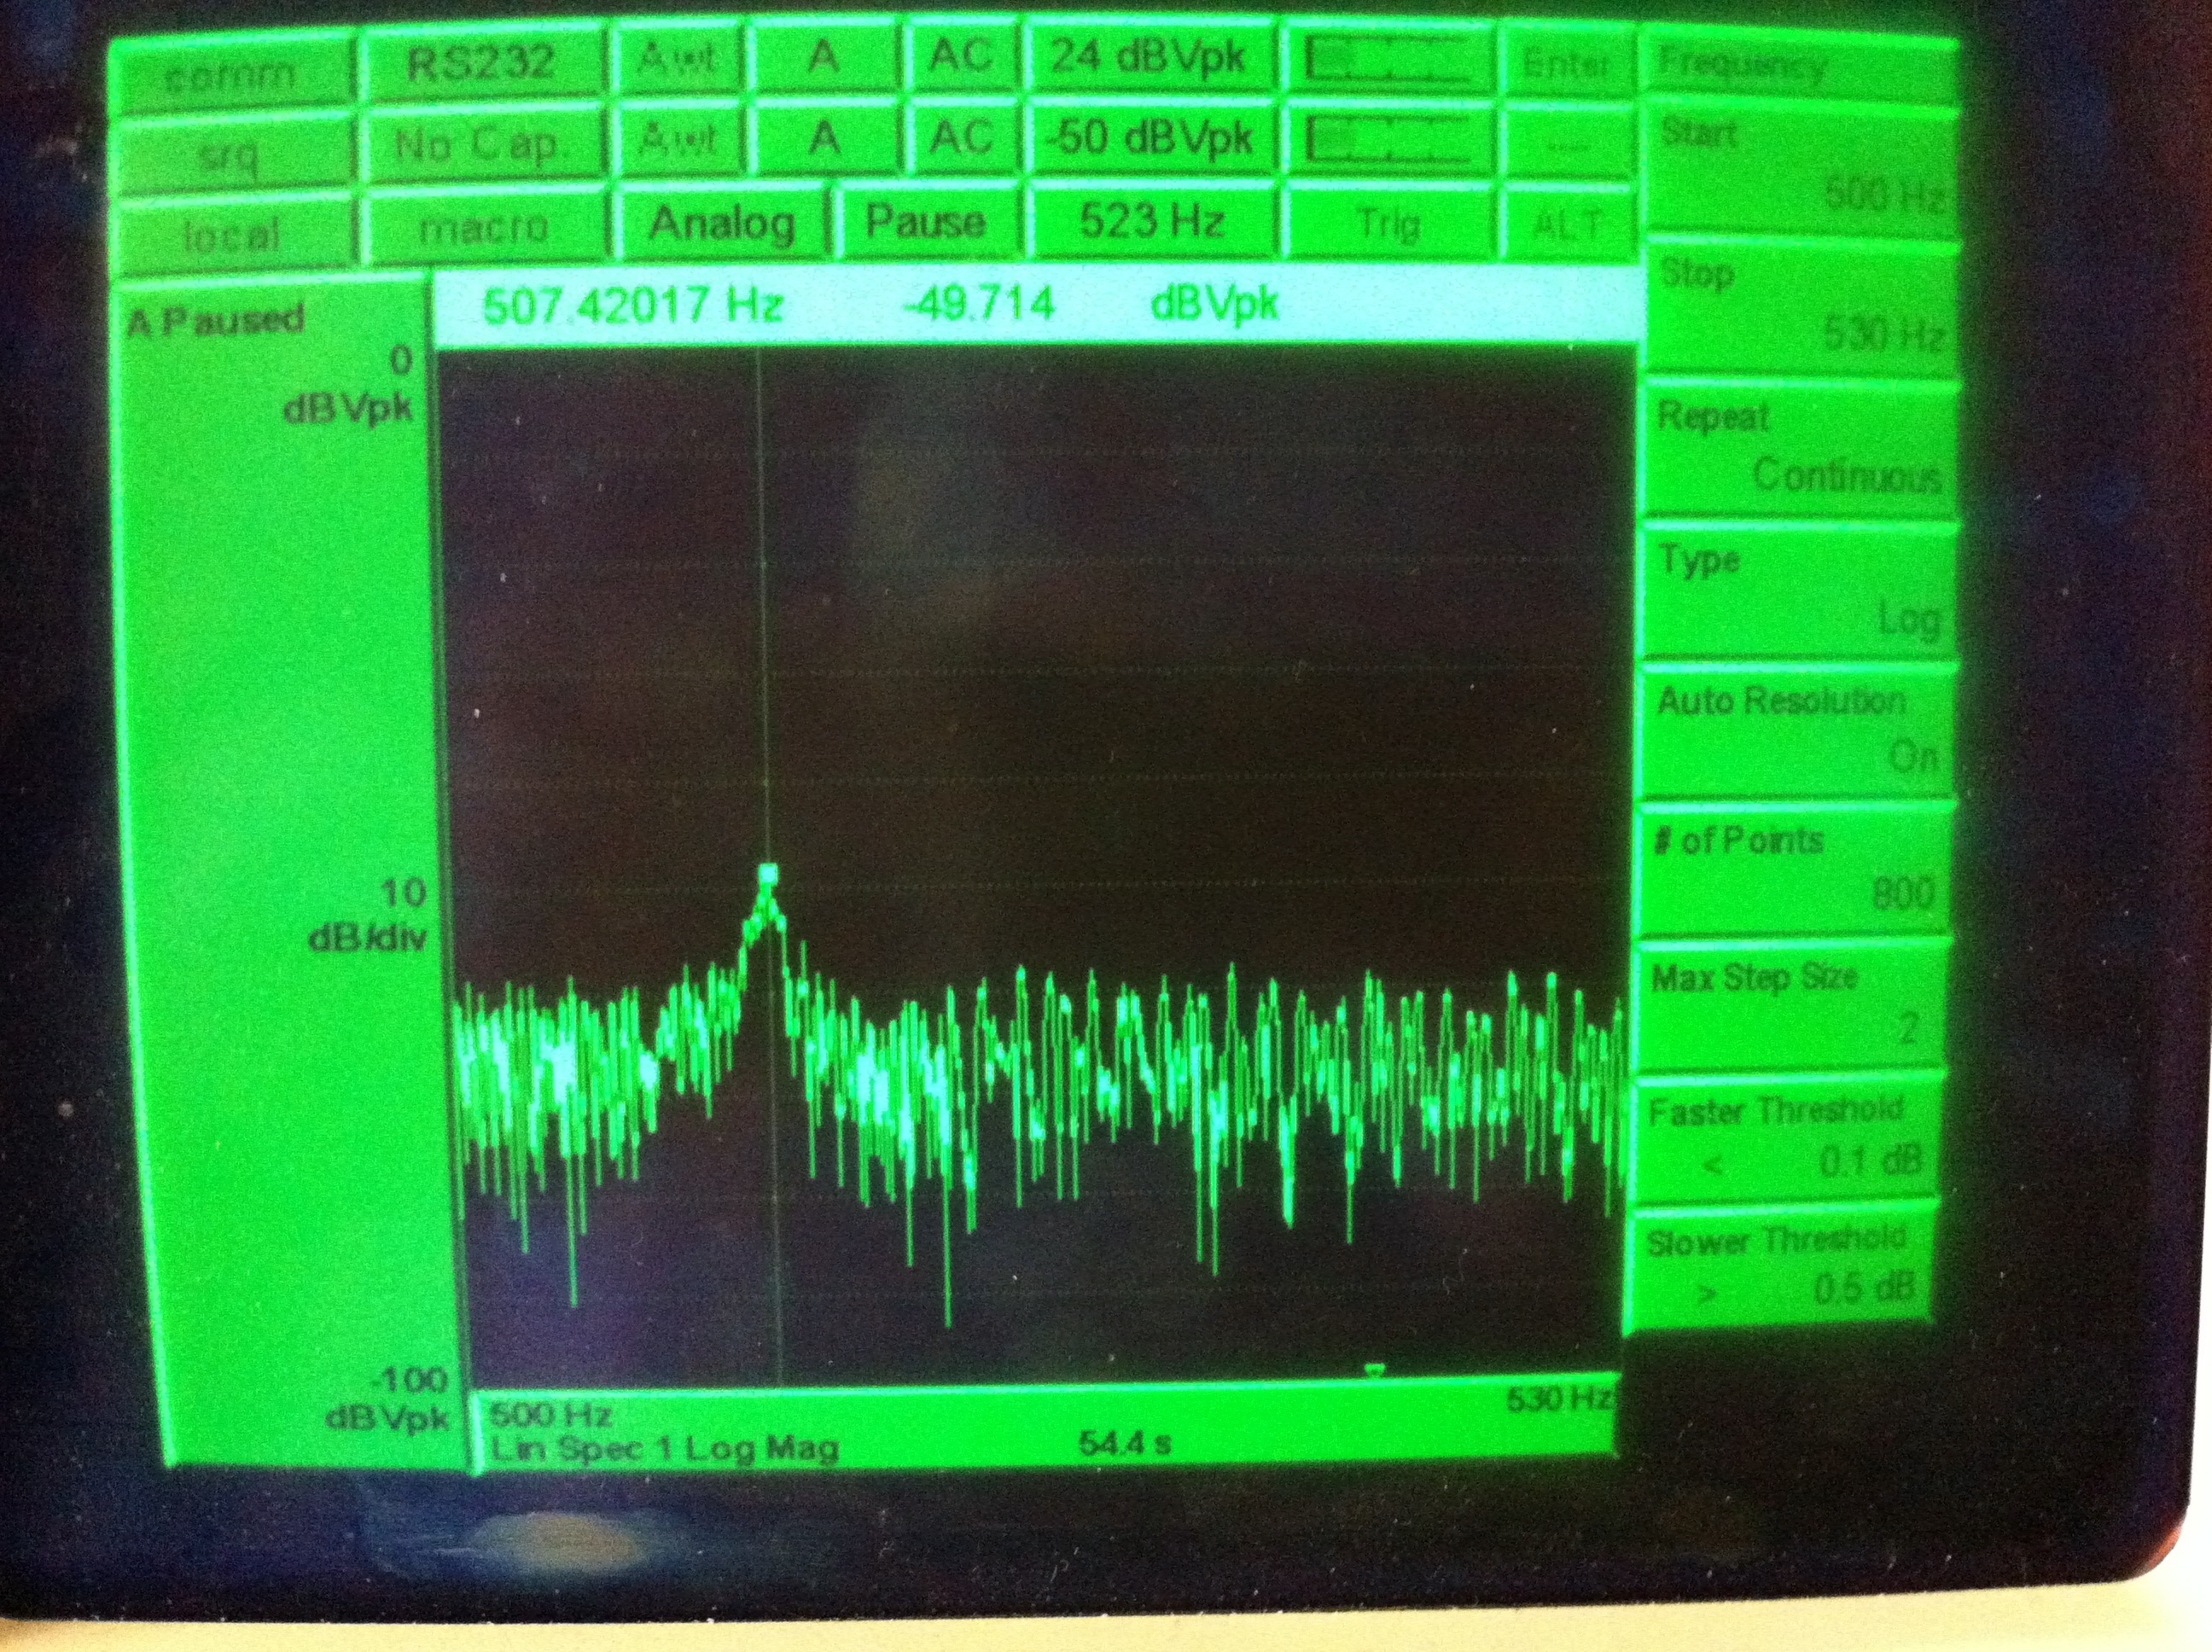
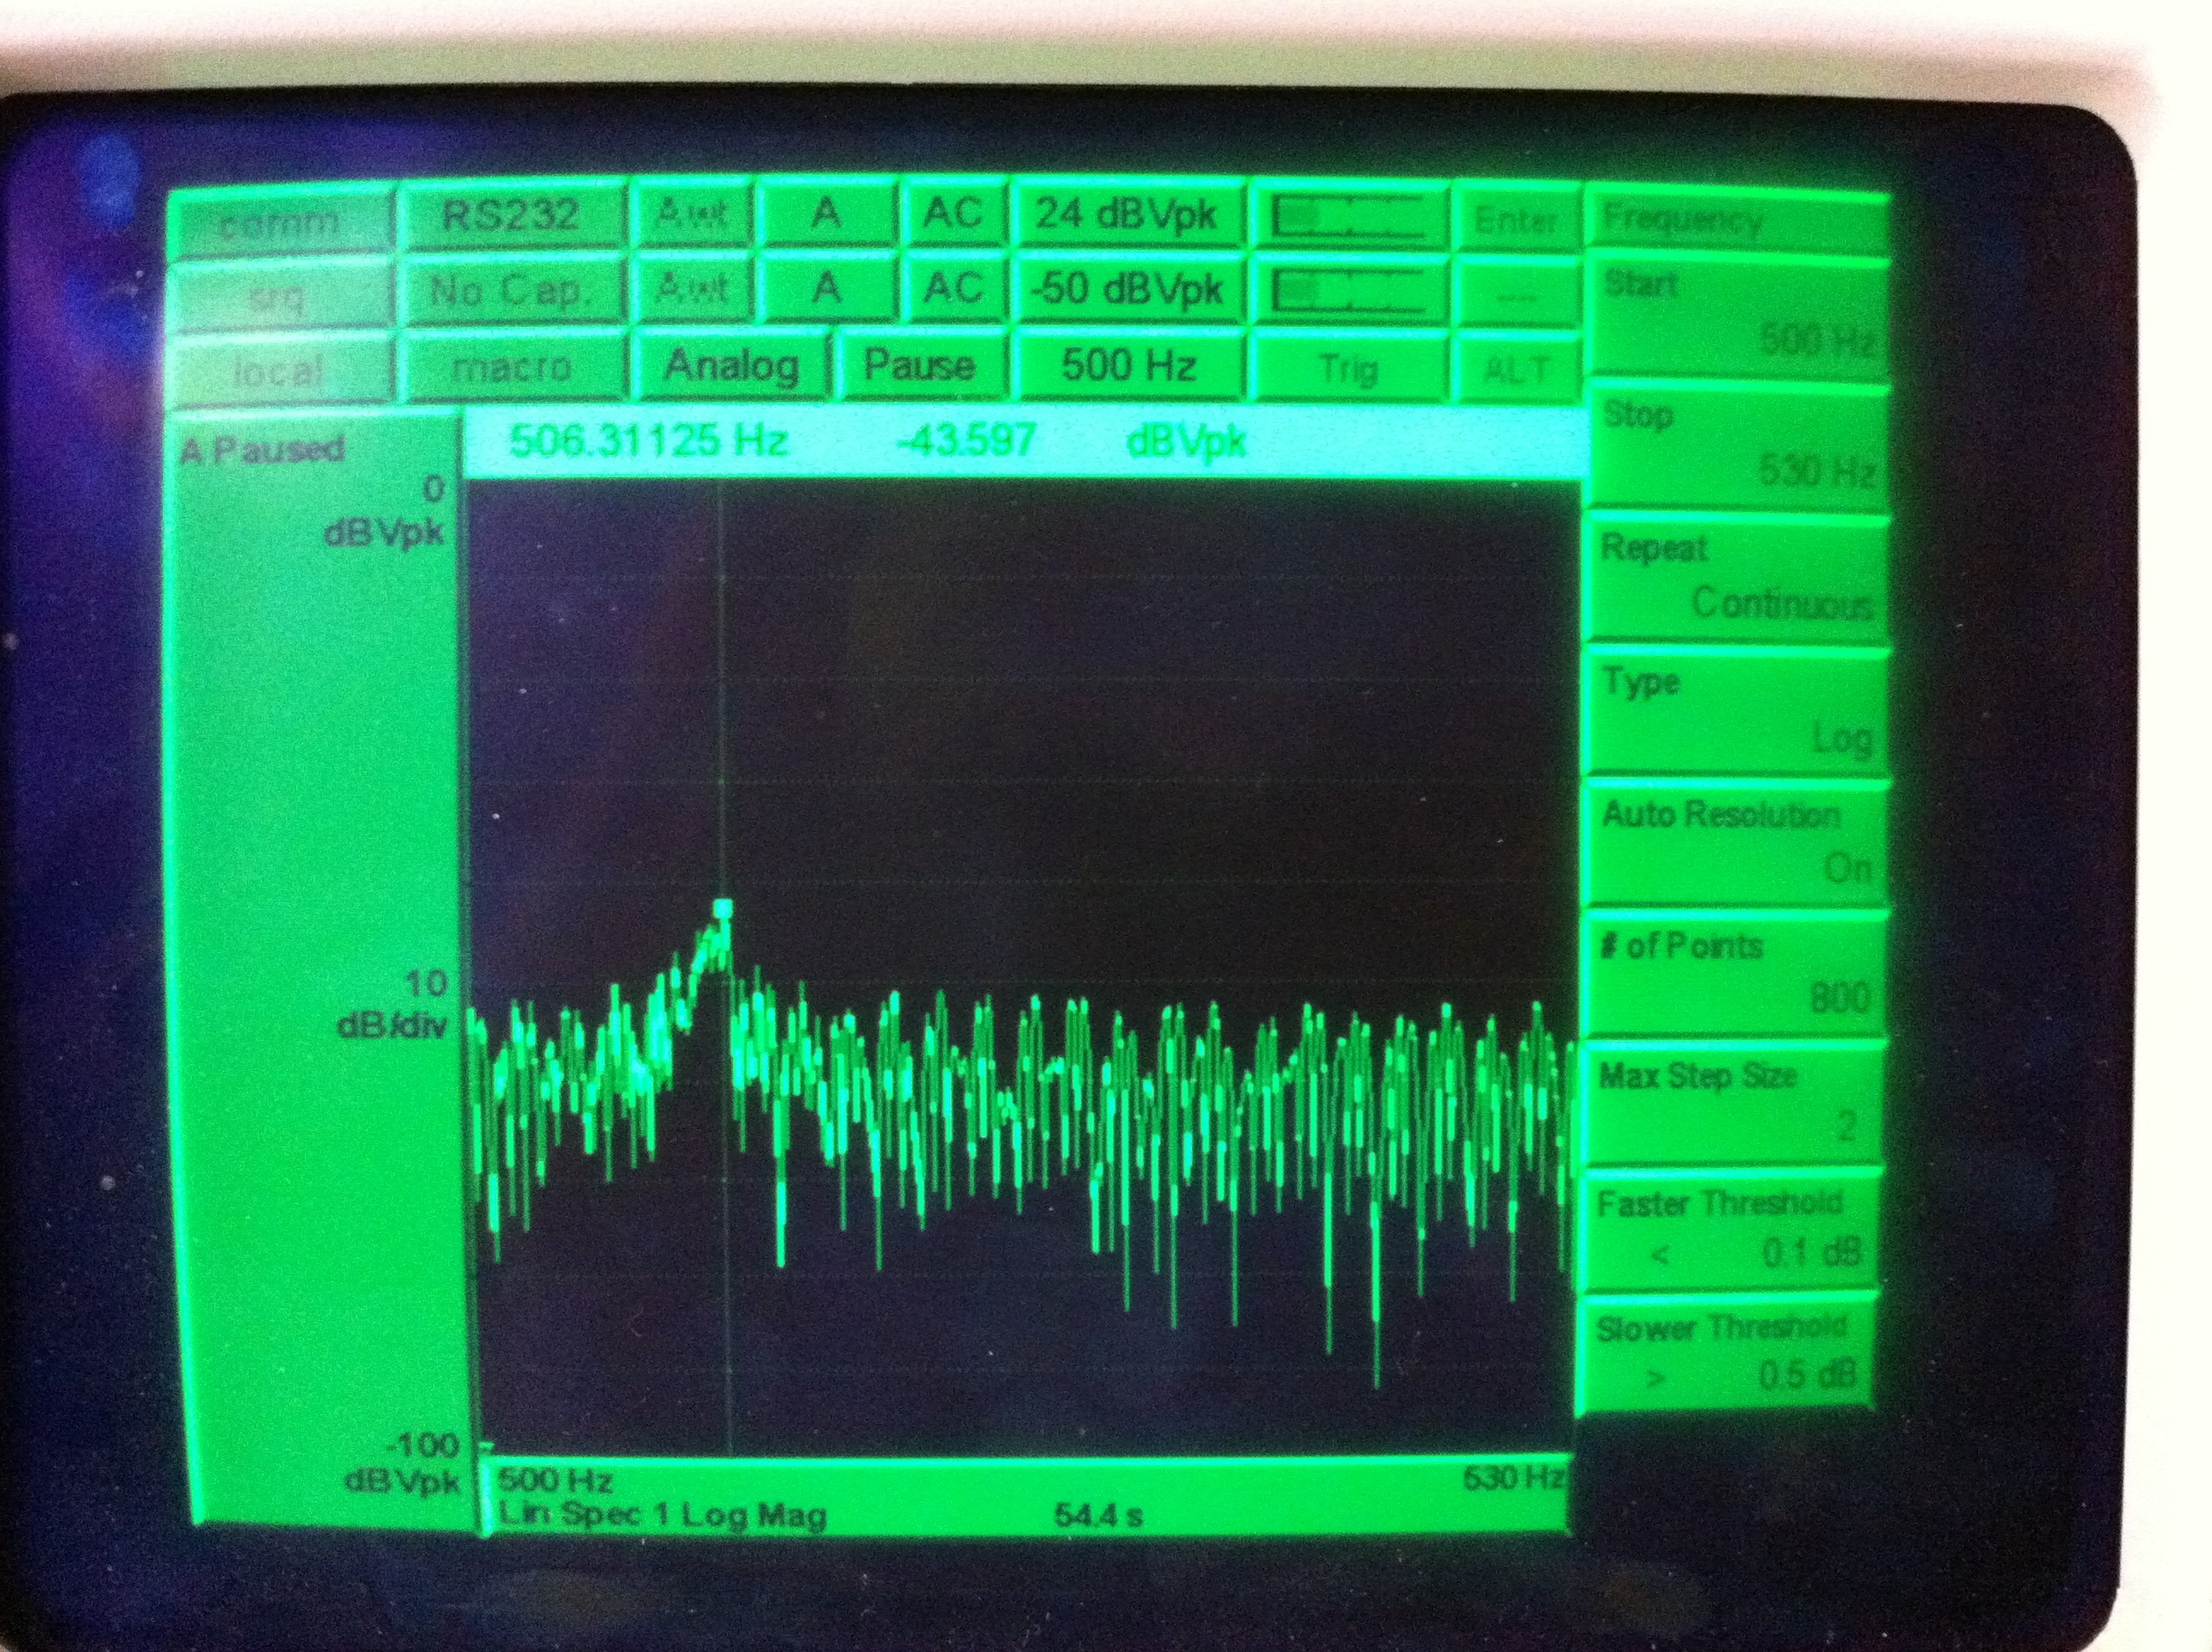
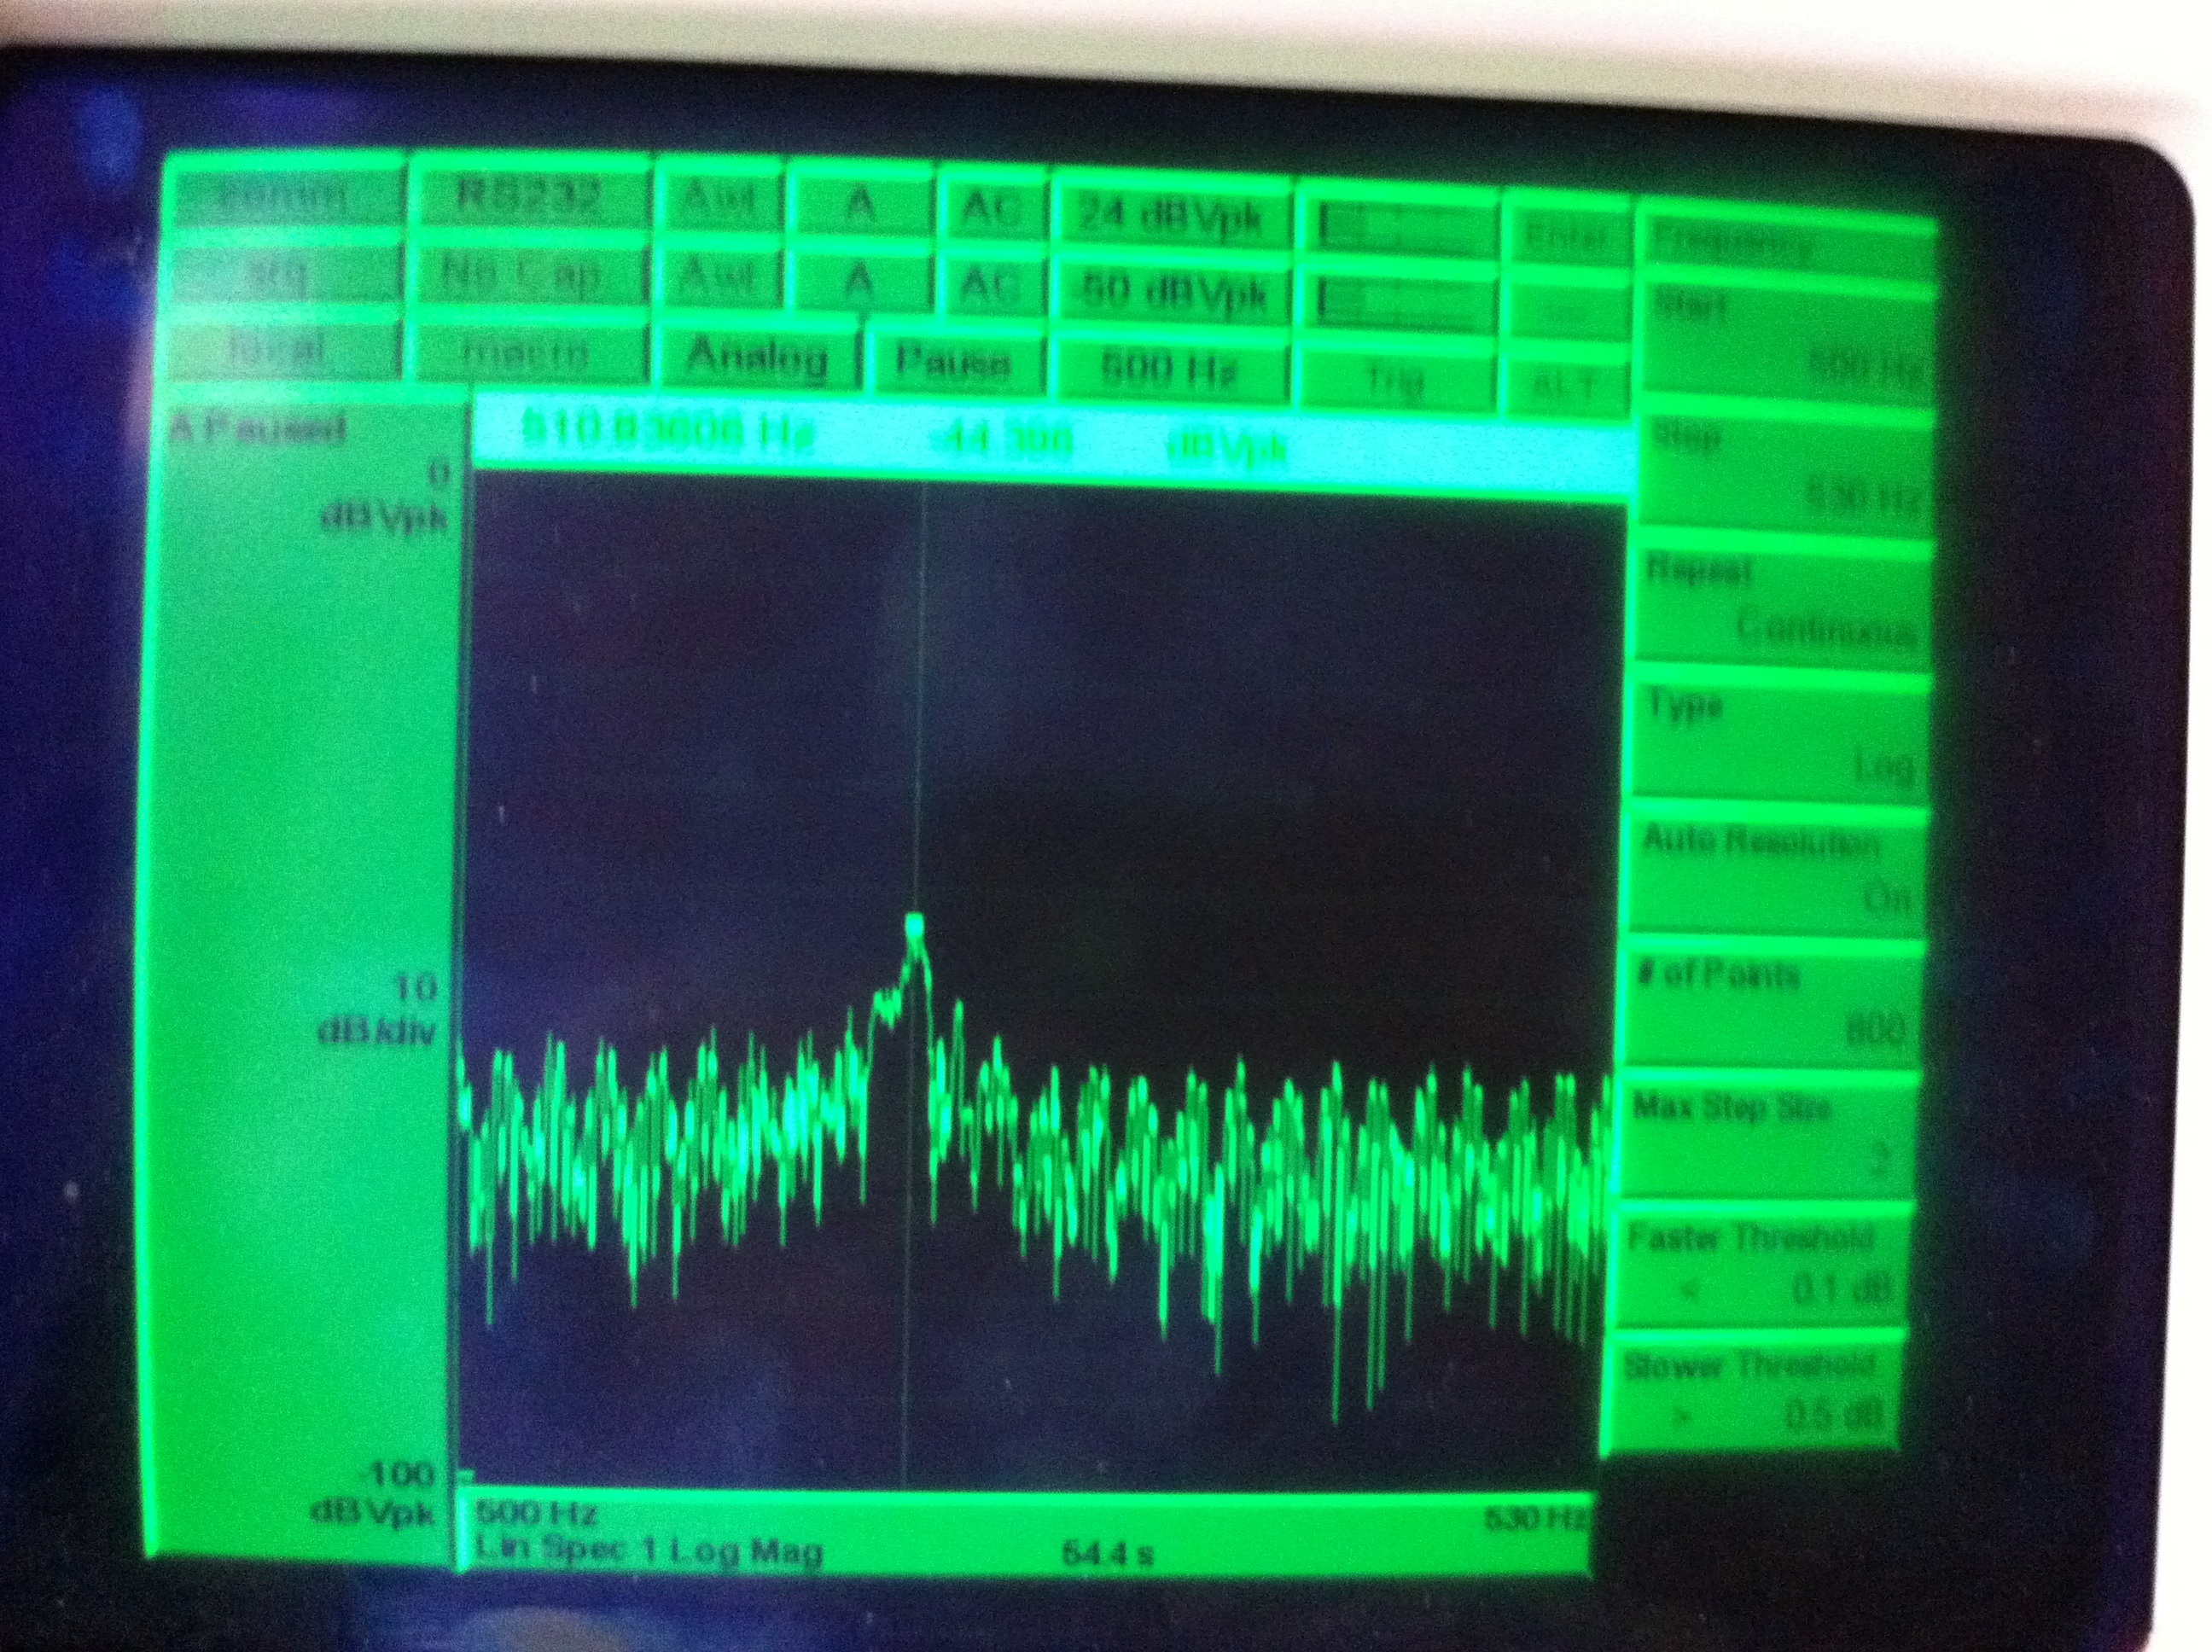
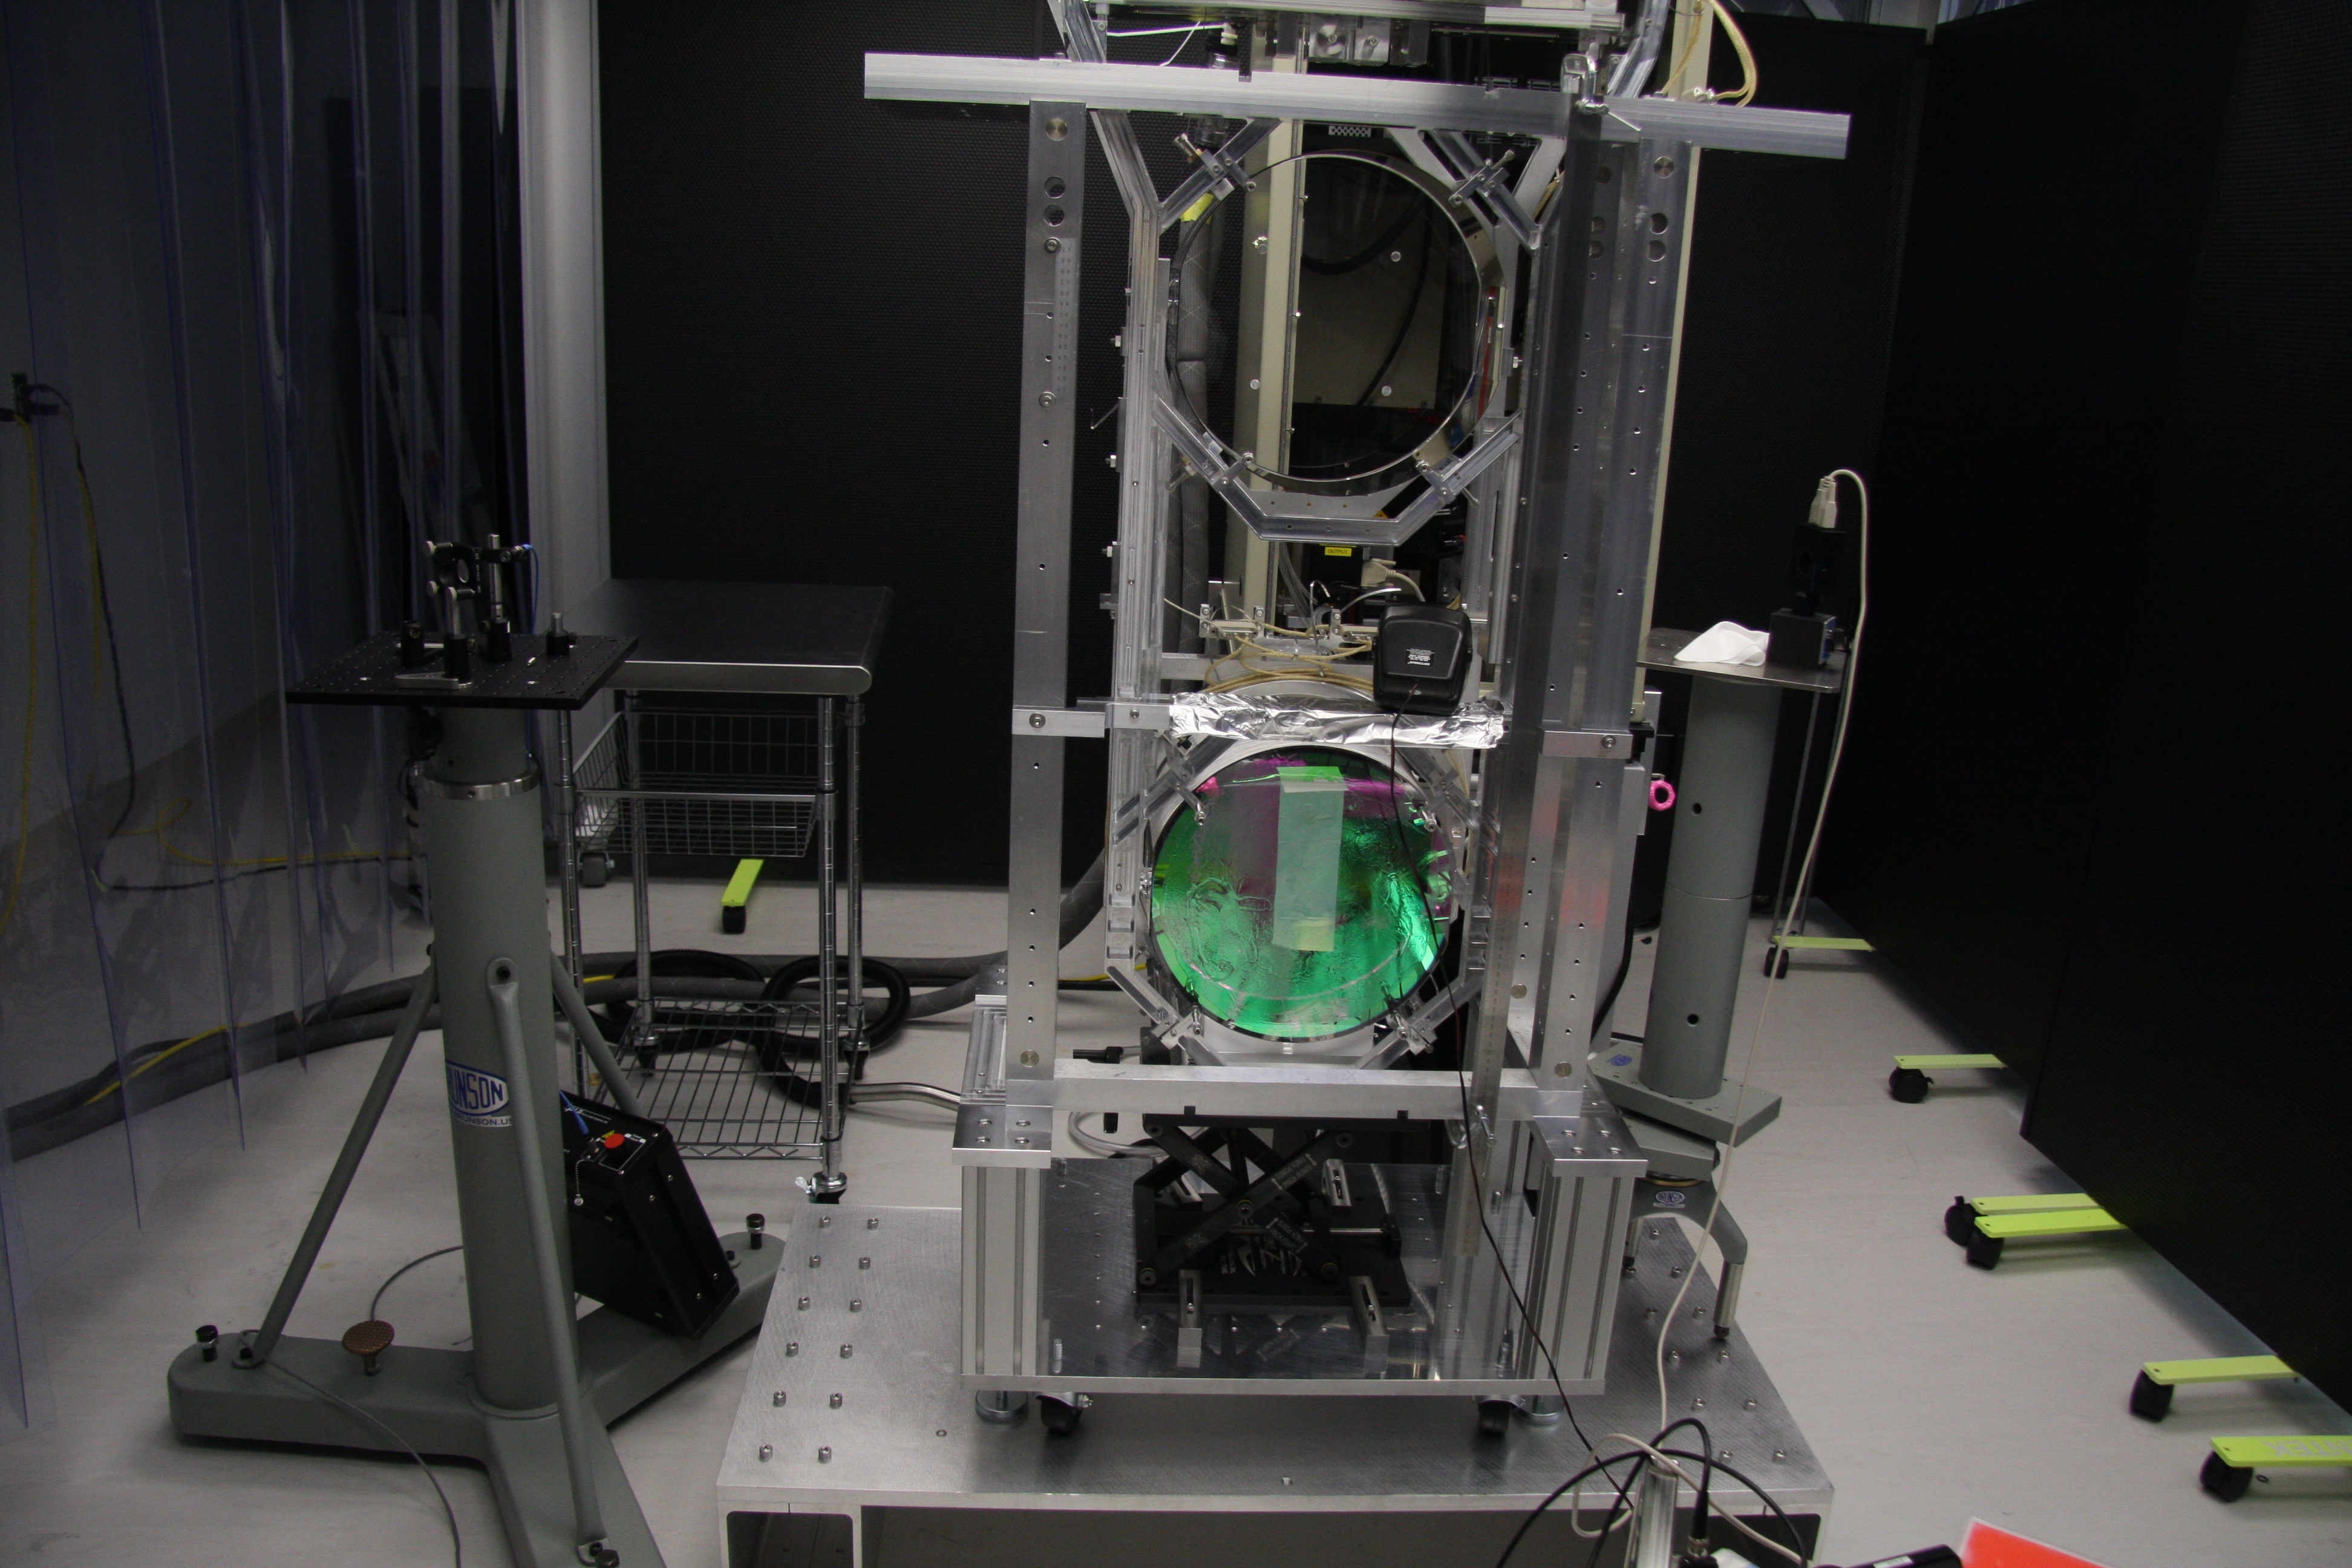
With help from Travis, I redid the provisional violin mode measurements on the monolithic stage from 9/24: https://alog.ligo-wa.caltech.edu/aLOG/index.php?callRep=1460 . I used (see attached photo of setup):

* The optical lever laser, with a steering mirror mounted on a Brunson stand to one side of the structure.

* A small audio speaker placed on UHV foil on the cross bar of the structure and pointed toward the fibre.

* A quad photodiode on an second Brunson stand on the other side of the structure, nearest the fibre to be tested.

* A Stanford signal analyzer for excitation and read back.

* A digital oscilloscope in XY for checking the DC spot position as reported by the QPD.

Procedure was:

(i) Adjust the steering mirror location and angle until the shadow of the fibre to be measured is clearly visible in the beam spot on a gloved finger just behind the fibre.

(ii) Adjust the position of the QPD until the spot is centred per the oscilloscope.

(iii) Tweak the position of the QPD until the swaying of the mass is clearly visible (sometimes the optimum position is slightly off-centre either horizontally or vertically).

(iv) Set the signal analyser source to 10 V. (The previous measurements used a powered speaker, but the Stanford can drive an unpowered speaker at a fair volume.)

(v) Do a swept-sine measurement from approximately 500 to 530 Hz, with 800 lines of resolution (this takes about a minute).

The peaks were low-Q and had about a 1 Hz bandwidth (see photos of analyser screen). The frequencies were approximately

Left front: 504.5
Left back: 507.5
Right front: 506
Right back: 511

(Here "back" is the AR side, and "left" and "right" are as seen standing at the back.)
Images attached to this report