Fabrice Krishna Hugh.
Krishna was suspecting that RX tilting on ITMY and the BS was impacting the HEPI Z Sensor correction results. Sure enough, when checked it was most coupled on the BS Z to RX and next on ITMY HEPI Z to RX. The other couplings, that is, HEPI Z to RY, and for ITMY both HEPI Z to RX & RY, where less by about a factor of 10.
The Measurement
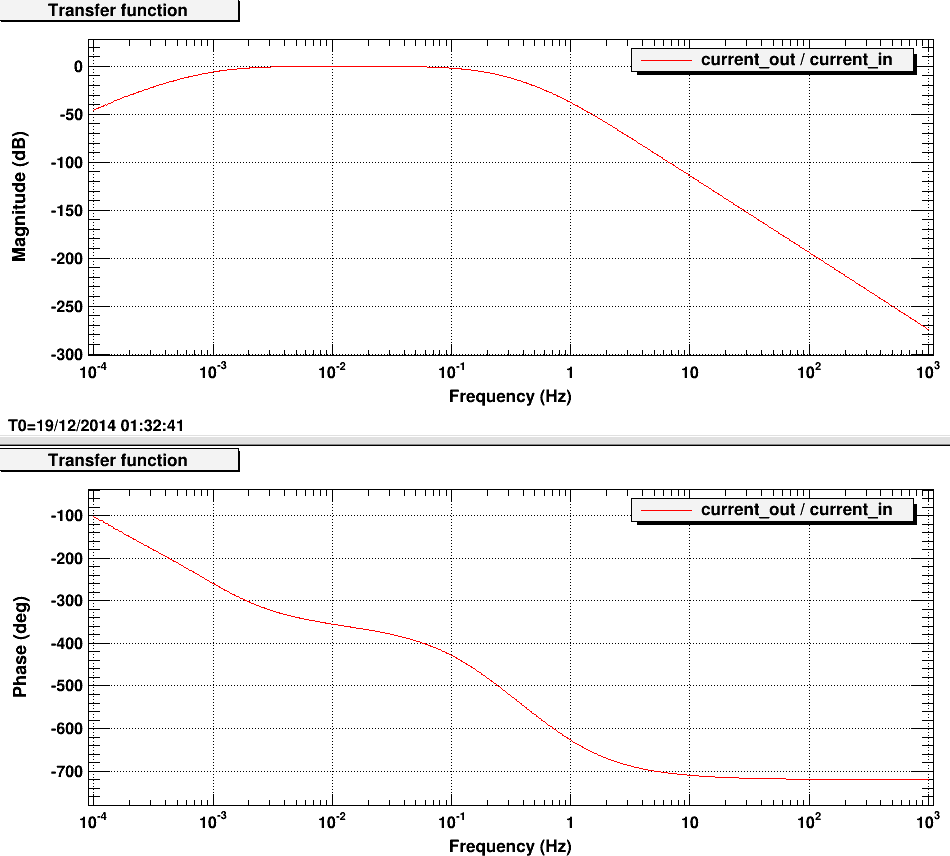
HEPI Z is driven with a 0.001 to .1 band pass excitation (see attachment 1) looking for coherence with ISI Stage1 T240 X & Y.
The HEPI is in normal configuration, Lvl1 position loops but with sensor correction off.
The ISI Stage1 all dofs are put into high blend (T750) and its sensor correction is also off.
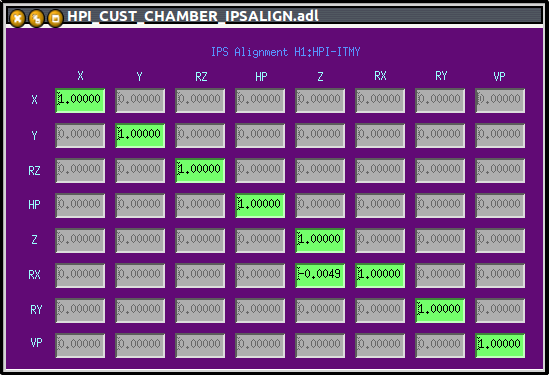
Once a baseline of the existing HEPI Z to ISI Stage1 T240 to RX & RY coupling is established as seen by the T240 Y & X, the HEPI is then Tilted in RX & RY with a smaller magnitude but similar bandpass to see the actual tilt of the ISI Stage1 when HEPI is tilted. The Decoupling factor is computed by the ratio of the former to the latter: RXz/RXrx. This correction goes into the IPS Align matrix.
Results
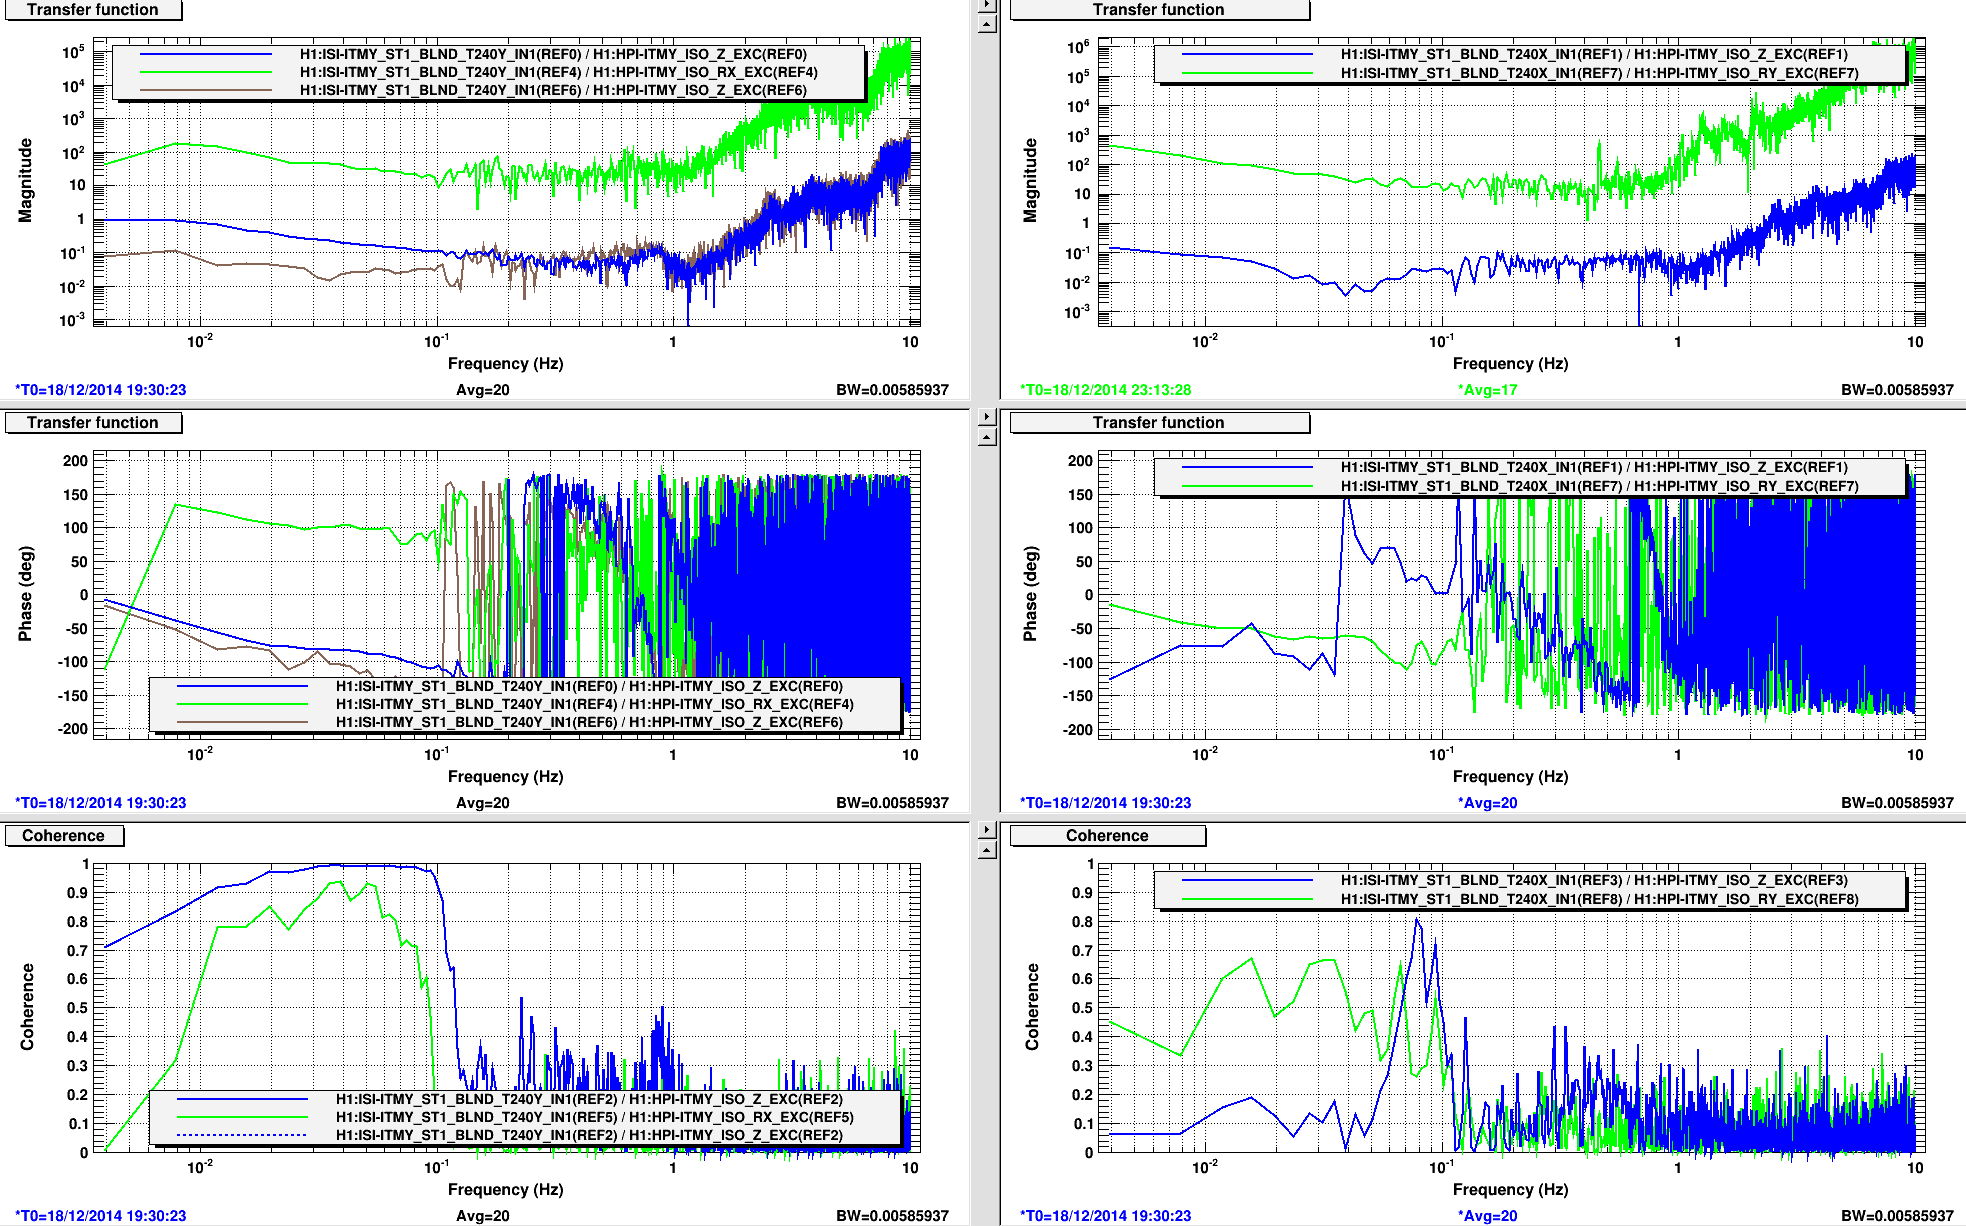
See attachment 2 for ITMY. The left three plots are the TF data for inline tilt on ITMY, this is the Y direction caused by RX; the three right plots are for the crossline tilt RY showing on X. The first step is shown in blue: the area below 0.1 to 0.01hz with good coherence is our tilt coupling. Notice on the right side, there is poor coherence and the TF magnitude is 10x smaller than the tilt in the Ydirection seen on the left side.
The green traces are the direct tilt measurement HEPI RX(RY) to ISI RX(RY). Picking a few magnitude points from the blue & green traces in the area of interest and averaging the ratios gives the decoupling factor blue/green= 0.23/46(e.g.) == -0.0049 with the sign coming from the phase which are ~180 out of phase.
The brown trace (only on the left side) shows the reduction with the decoupling factor in the matrix (see last attachment) when the first measurement is repeated. (I failed to save the coherence for this but it was reduced just above 0.8 from the near 1 at the start (blue.) This indicates there may be more improvement to be made but it will be time consuming and may not be worth it. The improvement though is clear, about a factor of 10.
Time constraints (commissioners) prevented a brown results curve measurement for the Z to RY tilting but I have the data to calculate the ratio. We expect the improvement to be minimal as the coupling is already low.
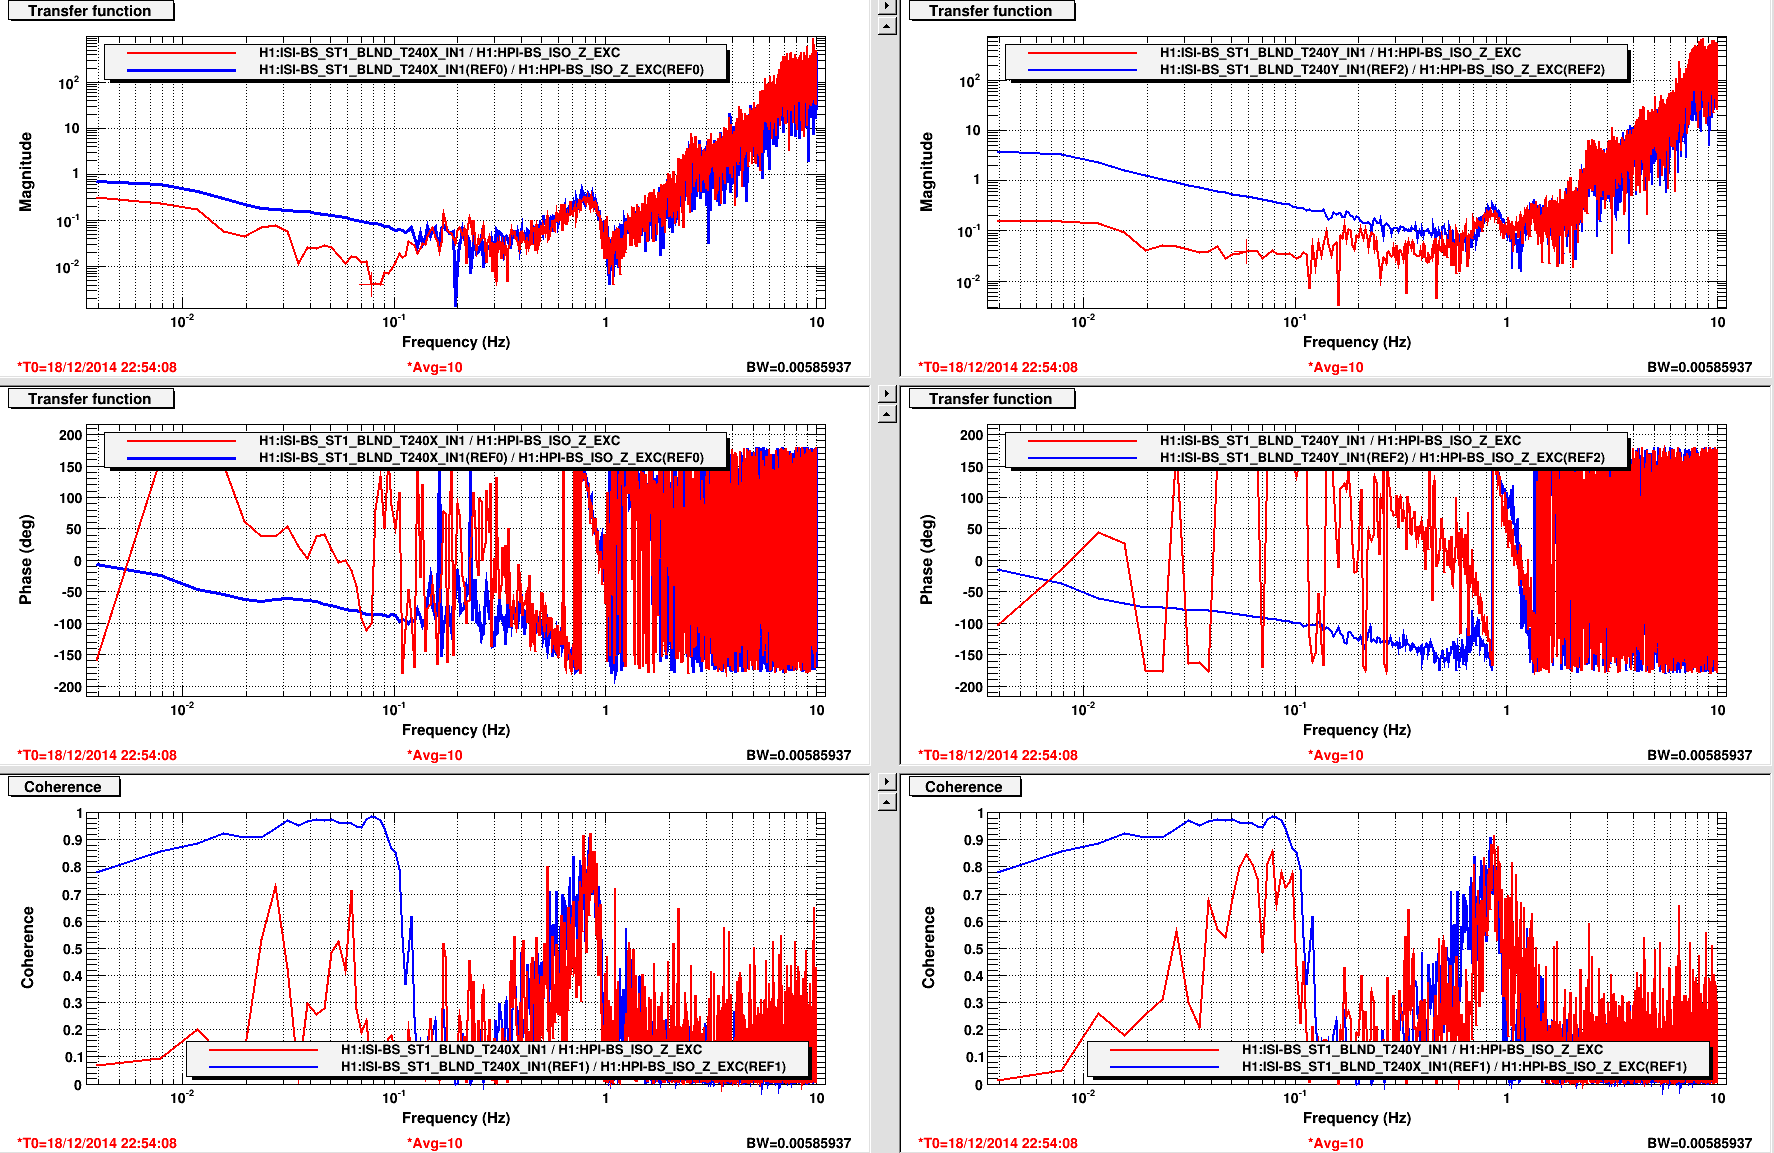
I've attached similar data for the Beamsplitter HEPI. The RX and RY correction values were based on the following measurement:
the transfer function between Z drive to X/Y
Correction value = ------------------------------------------------------------------------
the transfer function between RX/RY drive to X/Y
For the beamsplitter, we measured
RX correction = - 0.0172
RY correction = + 0.0038
The plot shows the transfer function between Z drive to X/Y before and after the tilt decoupling.