Based on my measurements this morning, it seems when the coupling is as small as it is for ITMX HEPI Z to ISI RX, the numbers we calculate are not accurate enough to use. A much more resolved measurement with many more averages may be required to calculate the correction factor directly. Otherwise the proper value may be found with an iterative approach and may frankly not be worth the effort.
Origins
See Fabrice's logs 8280 & 8284 for some informative references. The problem is (can be if the coupling is large enough) vertical motion on HEPI is not perfect likely caused by imperfect actuation on the four corners gives a tilt (RX & RY) to the ISI. Why would this be if the RX & RY loops are closed..error of Inductive Position Sensor?? The Trilliums feel this tilt and it shows as Y & X translation at low frequencies <<0.01hz. We much prefer to use this interial sensor at those frequencies and will be injecting noise into the ISI motion without correcting for this.
See alogs 15808, 15746, 15729, & 15726 for measurements collected for calculating the correction value for the H1 BSCs. The BS had the largest coupling in the Z to RX of 1.7% (see Krishna's 15745). ITMY Z to RX and BS Z to RY had the next largest couplings of .49 & .38%. Looking at logs 15726 & 15745, the amount of improvement based on the calculated coupling factor is still pretty clear. However, the amount of coupling for ITMX Z to RX & RY and ITMY Z to RY is much smaller. I calculated and implemented the correction ITMX Z to RY in alog 15729 but this 0.15% decoupling is difficult to assess as successful.
Now
Given the need to run many averages at 0.004hz bw, I never installed the other small corrections on the ITMs. I had the data to calculate them and I did that this morning. The process is drive the HEPI in Z and measure the T240 X & Y response. The low frequency (<.0.01hz) response is tilt especially if it is not falling off toward lower frequencies. We then drive HEPI in tilt (RX & RY separately) to get the actual tilt of the ISI when HEPI tilts. Fabrice's alog 8284 details this and we divide the induced tilt by the direct tilt to get the correction. Fabrice proposed that the sign of the correction was determined by the phase of the these two--if the phase are the same, the sign is positive. This has seemed to hold up for the larger coupling situations.
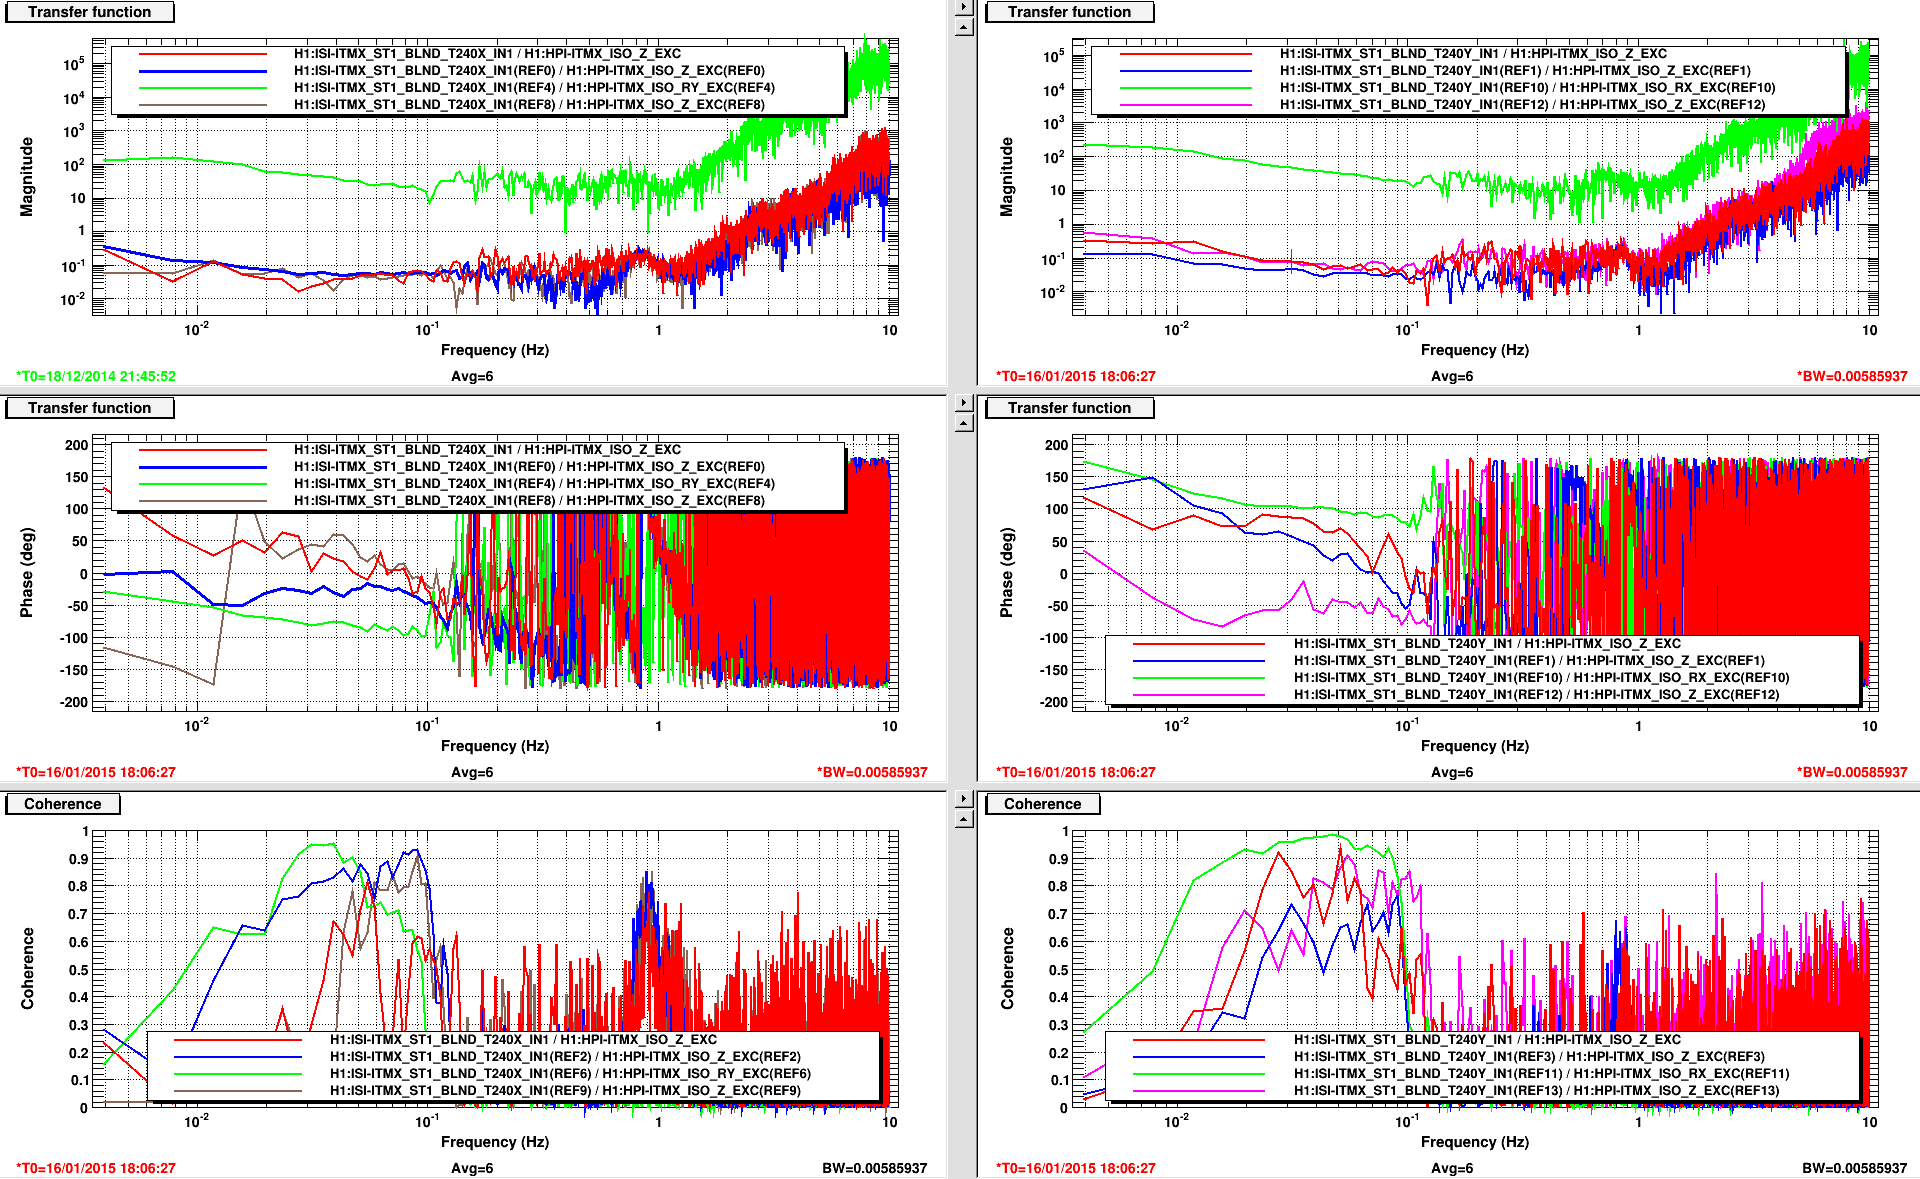
If you look at the right column of plots in the attached ddt you'll see the crossline coupling (that is Z to RX for ITMX) data. The blue traces are the undecoupled z drive data and the green trace is the HEPI RX tilted data, all collected before Christmas. Dividing the magnitudes of the blue by the green traces between 30 & 90 mhz gives a correctioin factor of 0.0010 to 0.0017 averaging out to 0.0013. The sign seems like it should be positive as the phase at low frequencies is similar and certainly not 180 degrees out.
Okay, with the correction factor of +0.0013 installed, another HEPI Z to ISI tilt was measured and the pink curve results. It was looking pretty consistantly wrong so I aborted the measurement after 6 averages. Not many averages for this measurement I agree but it wasn't jumping about, it was pretty steady bad. Notice the phase of the pink here, now that is 180 degrees out. Okay so I switched the sign and again after 6 averages the measurement (red traces) was aborted and it looks as equally bad as the pink.
Interestingly, in the right column of the DTT plots(HEPI Z to ISI RY), the correction factor calculated (0.0015[similar magnitude]) and affect measured(alog 15729, Dec18, brown traces) would suggest that maybe at least it did no harm(Magnitude may be lower and the coherence is lower) and remeasureing again today (red trace,) suggests it isn't unstable.
Conclusion/Next
This leads me to the conclusion that some detail of the plant condition/measurement set up is just not consistant enough to give a robust calculation at these coupling levels.
I think the next step is to remove the coupling factor and remeasure this Z to RX and see if it is similar to the blue. If it is similar, then good, things are maybe stable with time. And if we care, figure our a more robust measurement setup, or fish around with the coupling factor and find the minimum by search. This of course will be slow, painful and have the platform unusable for a few to several hours.
The likely course will be that we don't care about the coupling at this level and leave them unpopulated for now.