I am concluding that the scale factor in the original calibration (alog 16698) was underestimated by a factor of about 2.4 in 2 - 20 Hz frequency band (meaning, the DARM spectra we had collected were too good). This was due to my inaccurate estimation of the ESD actuation response.
For the frequency region above 20 Hz, it has been underestimated by a factor of 3.2 when the PSL power stayed at 2.8 W and the same DARM offset was used. This was due to the inaccuracy in the ESD propagating into the sensing factor and also inaccuracy in the UGF location. I did not try to track how the sensing calibration should have been compensated as a function of the PSL power or the DARM offset (alog 16726).
I have updated the CAL-CS online calibration coefficients accordingly in both the sensing and actuation paths.
Pcal_Y seems to still indicate that the DARM spectrum is consistently too good by 40-65 %.
(ETMX response agreed the sus model by 40 %)
The day before yesterday, I had a chance to repeat the calibration of the ESD response of ETMX by locking the X arm with the IR laser. Comparison with ITMX at 13 Hz gave me an ESD response of 6.32 x 10⁻¹⁶ m/cnts in ETMX at 13 Hz. This is 1.4 times larger than the expected than the suspension model. Since I used alpha of 2.0 x10⁻¹⁰ N/V2 in the model, the measured response corresponds to a slightly larger alpha of 2.8x10⁻¹⁰ N/V2. With the right force coefficient of -124518.4 cnts applied on ETMX, I tested both the linearized actuation and non-linearized. They showed almost same strength in a frequency band of 10 - 59 Hz as expected but with the linearized version somewhat stronger by 3-ish % (see the attached) presumably due to the charge on the test mass.
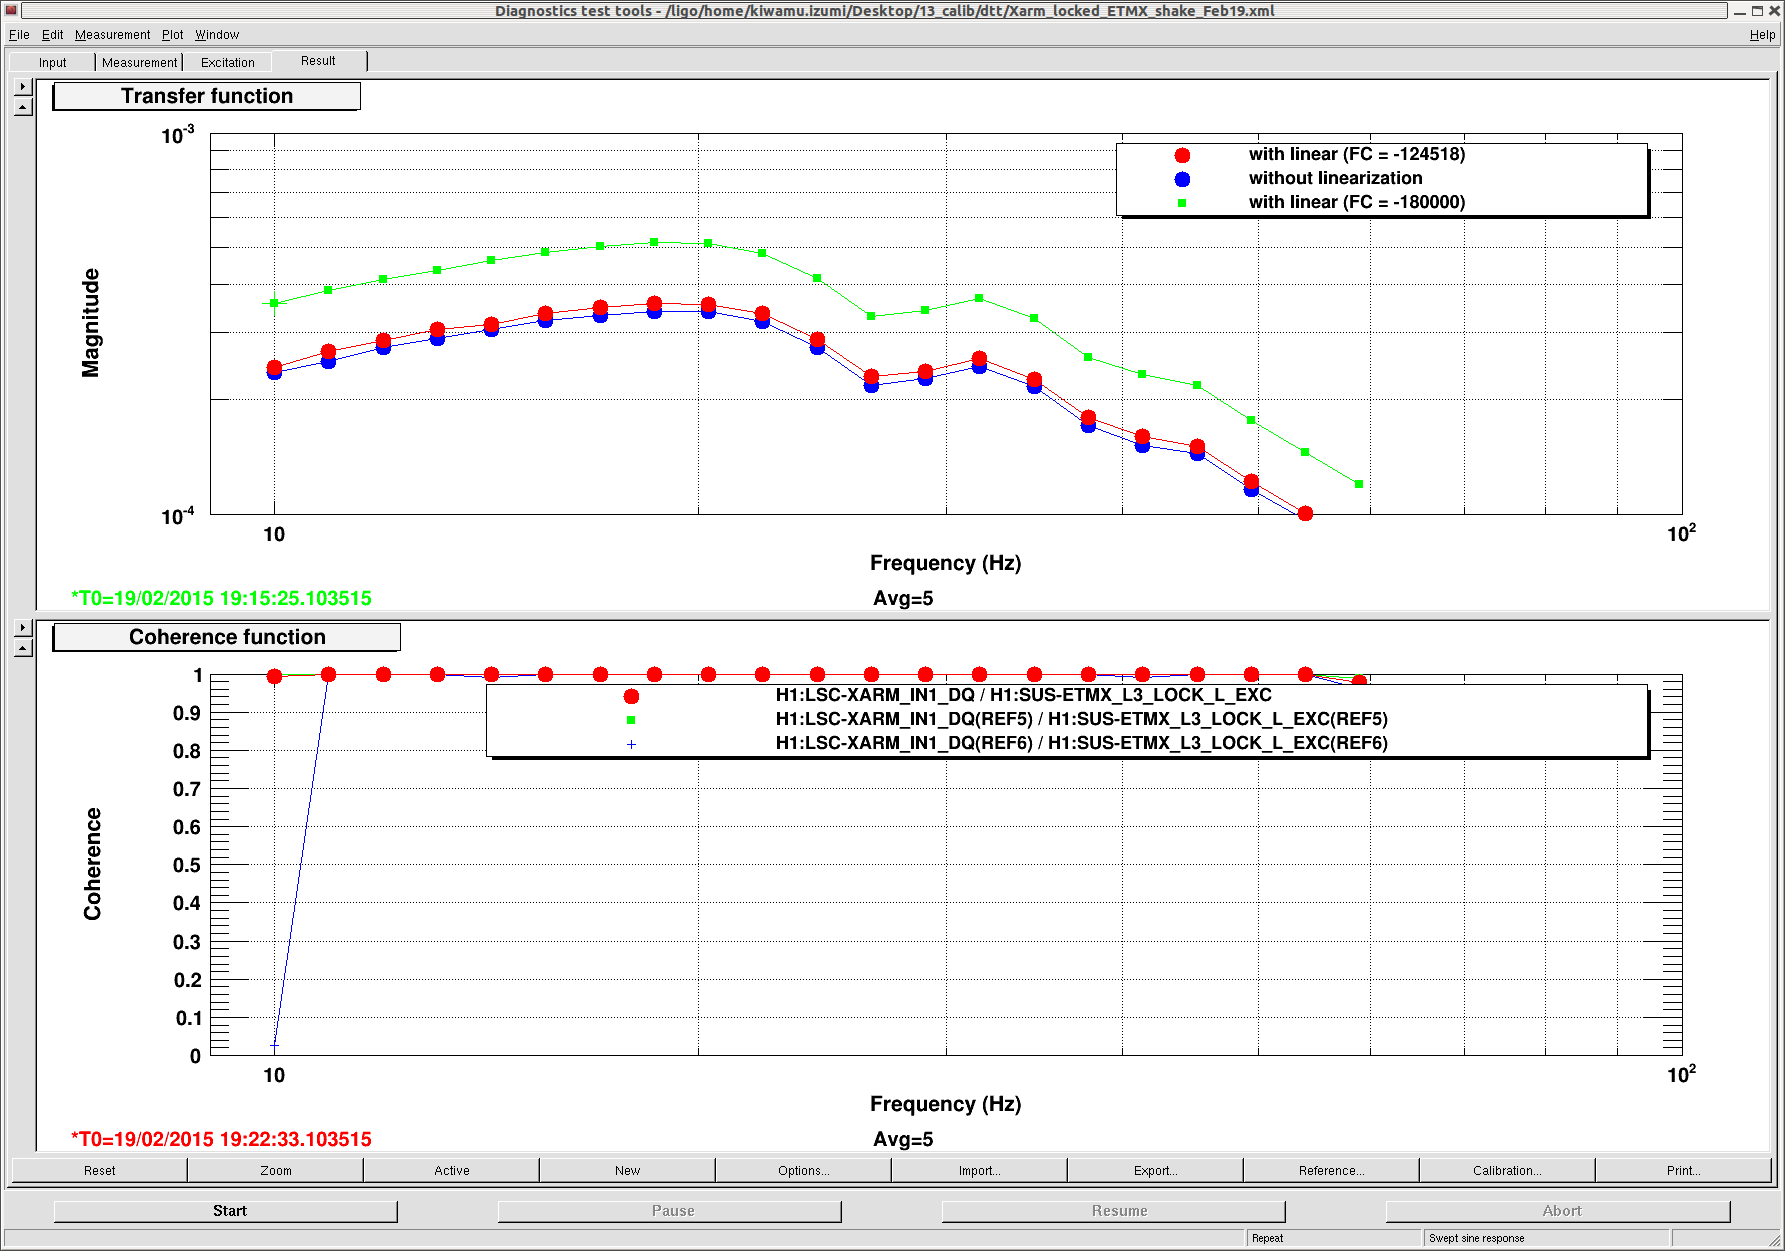
Since the change between the linearized and non-linerized actuations is so small, I neglected this effect and kept using the transfer coefficient of the non-linarized version at 13 Hz.
(Estimation of the DARM optical gain)
Using the measured data taken by Alexa (alog 16805), I estimated the optical gain of the DC read out to be 9.09x10⁻⁷ cnts/m. To get this number, I first extrapolated the ESD response to some frequencies at around 20 Hz. Since the loop shape is already known, fitting of the open loop gives me the optical gain. I did eye-fitting this time. The UGF was at around 23 Hz in this particular data.
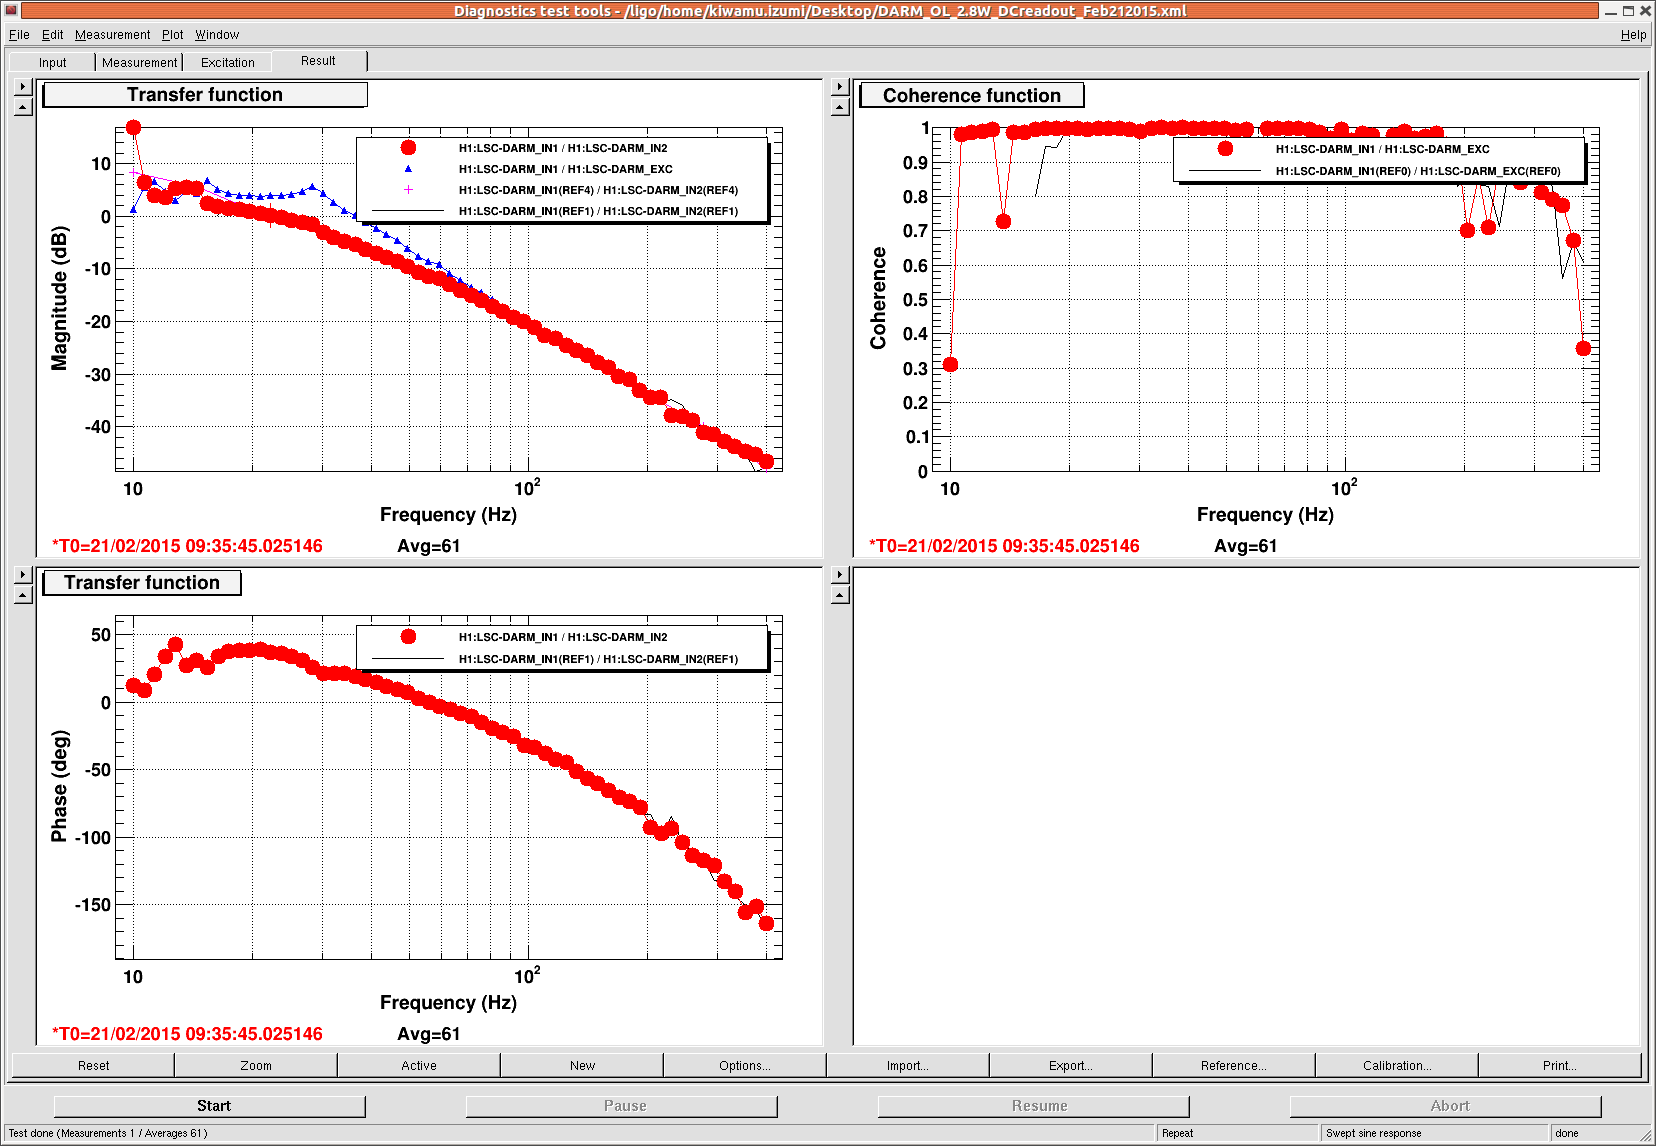
Since I was able to lock the interferometer at 2.8 W with the DC read out tonight, I cross-checked the DARM open loop. Running a swept sine, I confirmed that it sill kept the same UGF (see the attached below). Good.
(Comparison with Pcal)
First of all, one thing I have to mention is that, in an alog (alog 16781) describing the comparison between LSC-DARM_IN1 and PCAL is not a fair comparison because we know that LSC_DARM_IN1 was not well-calibrated. I checked the CAL-DELTAL_EXTERNAL_DQ at this particular time, but unfortunately the spectrum did not look reasonable probably because I was in the middle of changing some parameters in the CAL-CS. Instead, I looked into a different lock stretch at Feb-02, 5:13:11 UTC with the same IMC incident power of 2.8 W. The Pcal reported greater displacement by a factor of approximately 4.6 (see the attached below).
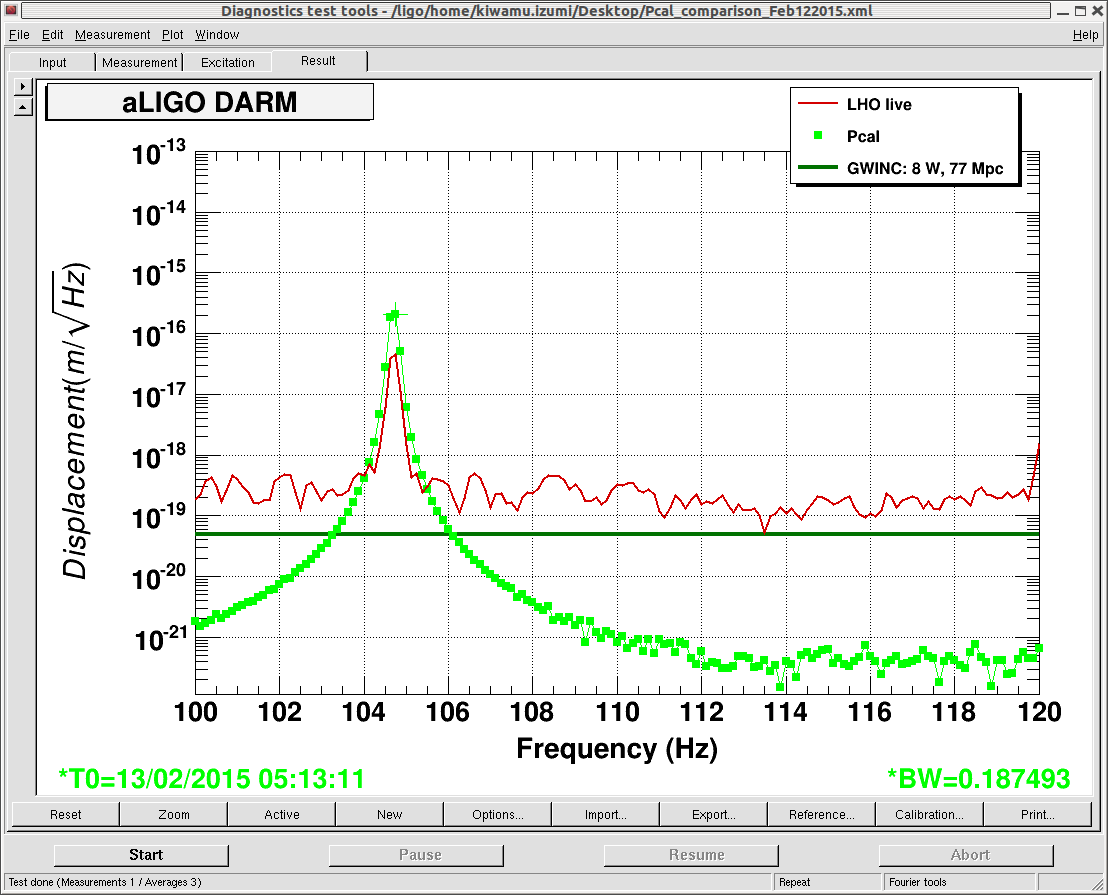
If I applied the new accurate sensing calibration, the discrepancy would have been a factor of 1.45 or 45% with the Pcal higher than the DARM spectrum.
To double check it, I checked the Pcal again during one of today's lock stretches at Feb-21, 10:04:05 UTC. One thing we have to pay attention is that the Pcal excitation frequency is now shifted to 540.7 Hz (alog 16815). I used the Pcal calibration formula that Sudartian posted in alog 16718 to get the displacement. The ratio between the Pcal and DARM spectrum was about 1.65 or 65% with the Pcal greater than the DARM spectrum. Even though the ratio is slightly different from 8 days ago or so, it still indicates that the DARM calibration is too good by several 10%.
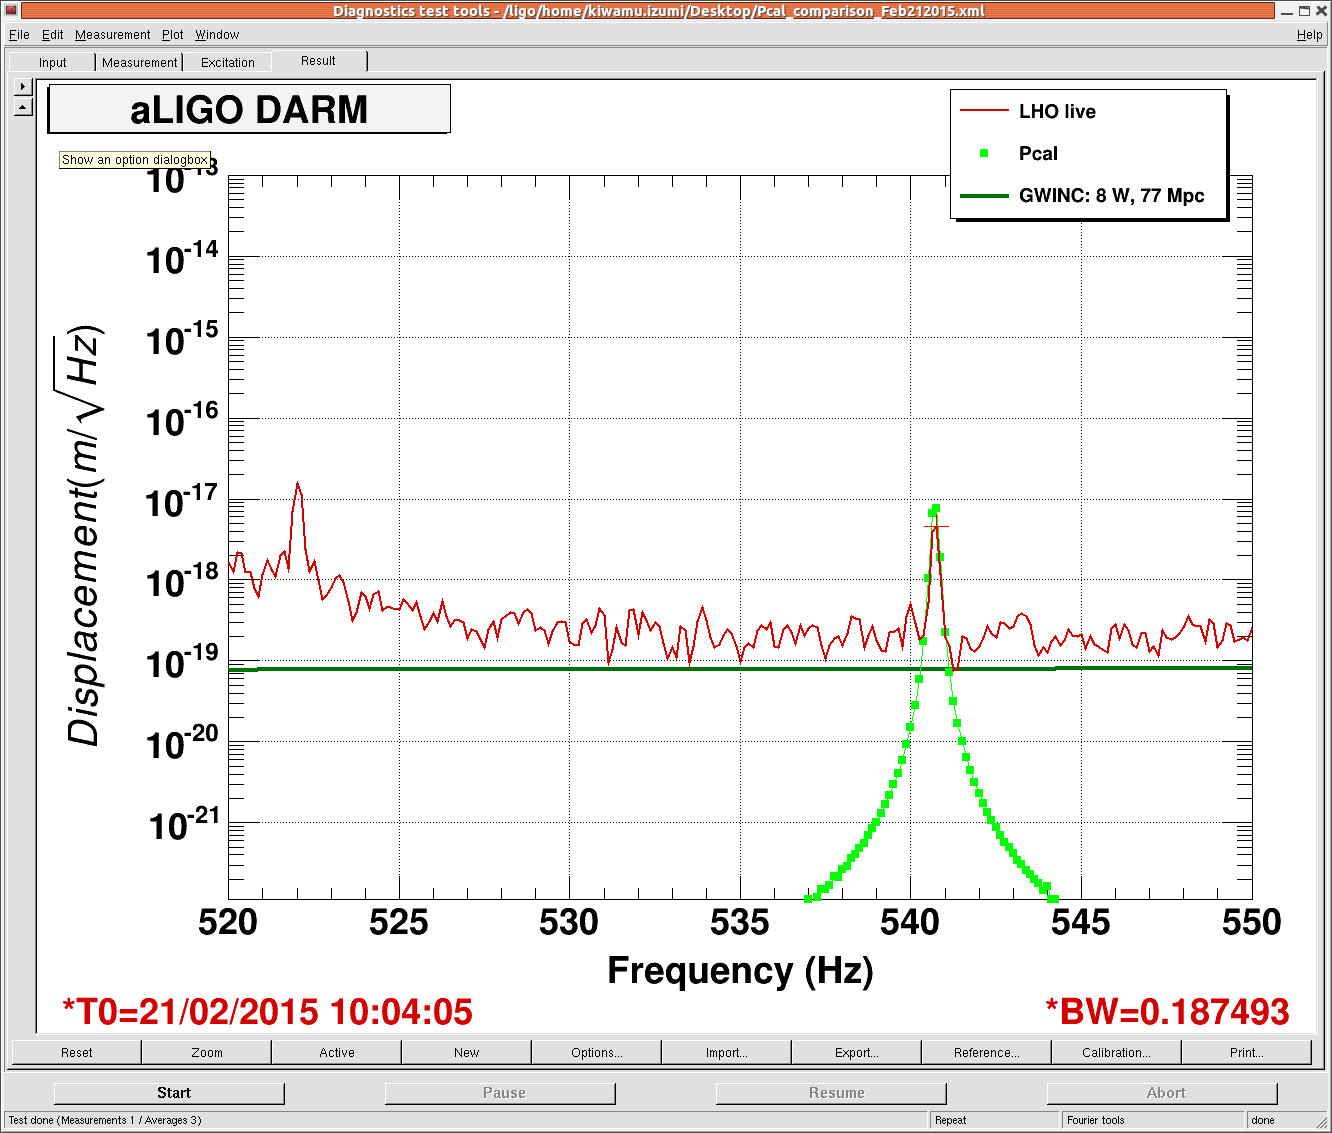
The other excitation at 36.7 Hz (alog 16815) did not have signal-to-noise ratio more than 2 in the DARM spectrum due to high noise in this frequency region and therefore I did not use it this time. Nevertheless, the Pcal at this frequency was also greater as well. So the relation between Pcal and DARM spectrum is qualitatively consistent.

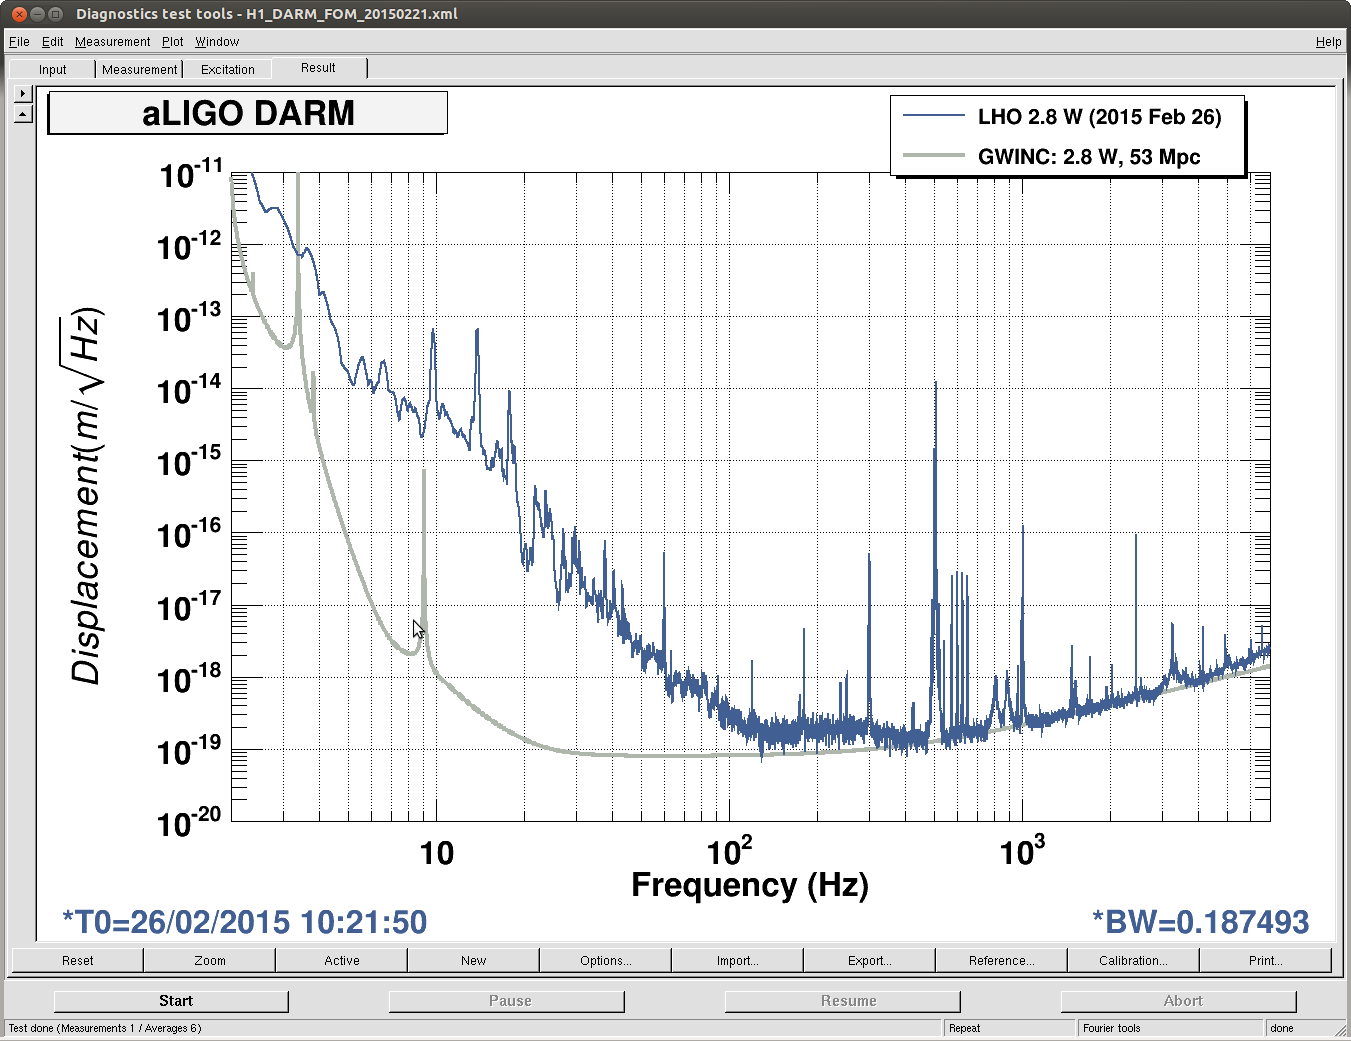
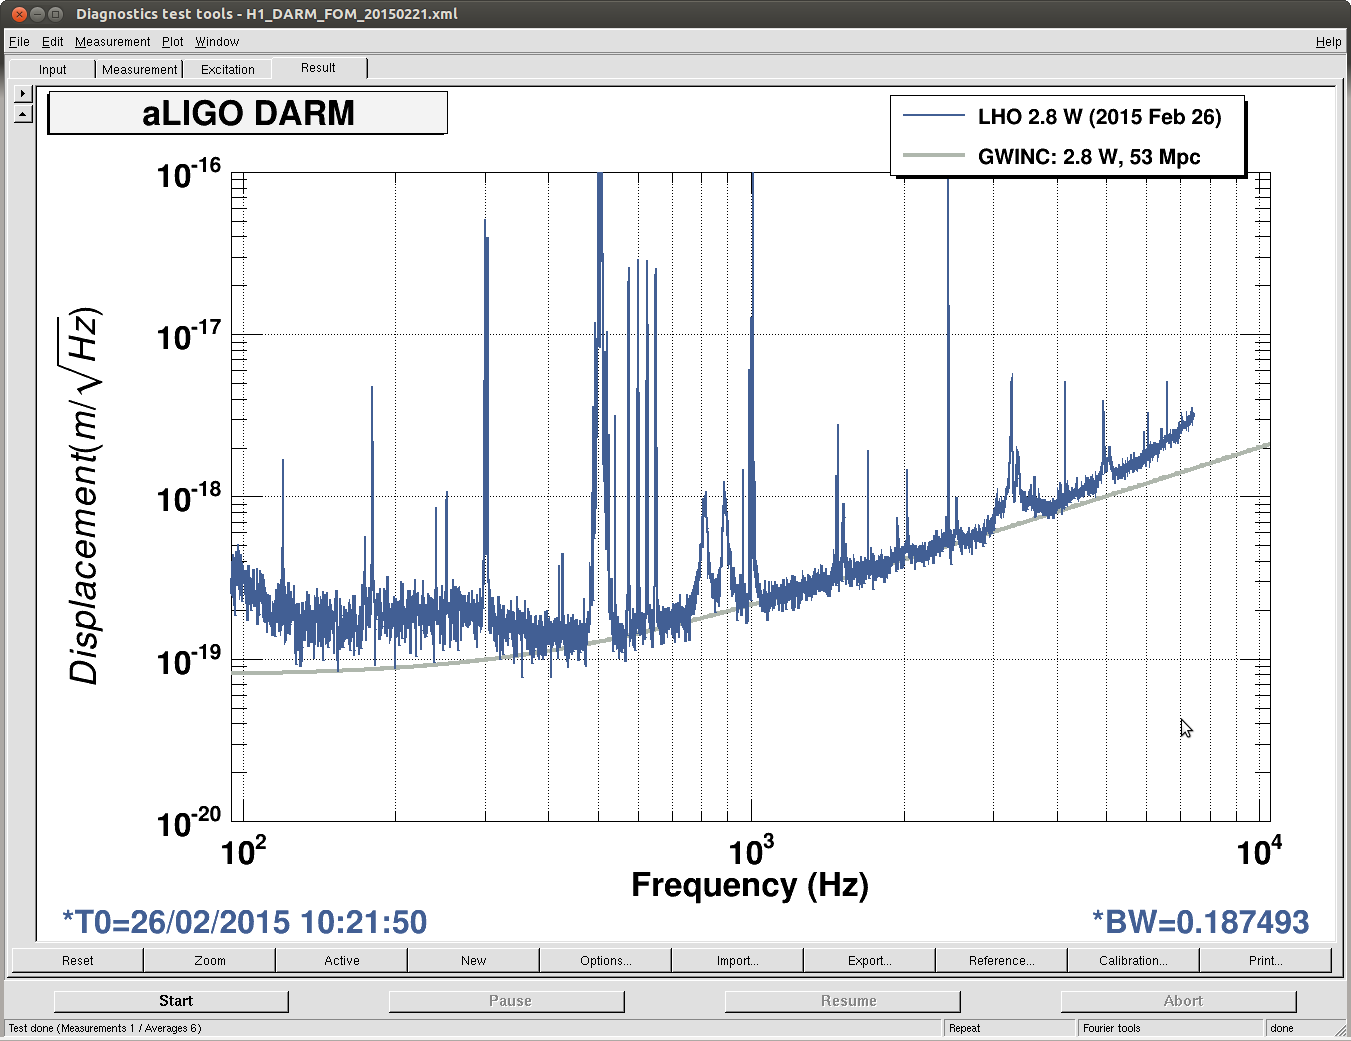
Here is a fresh DARM spectrum (from 2015-02-26 10:21:50 UTC) compared with the GWINC prediction. Between 1 and 3 kHz (where the spectrum looks reasonably clean and has the right shape for shot noise), the agreement looks good.
GWINC reports 9 Mpc from this measurement.

This is another detail point of this calibration log (for my self-justification).
In the ISC call last Friday, people pointed out that the first Pcal plot (link to the plot ) seemed greater by a factor of 10-ish than the calibrated DARM. Here, I explain that they don't differ by a factor of 10 but a factor of 4.6 as I declared in the original alog.
- Pcal line at 104.75 Hz = 2.07566 x 10⁻¹⁶ m/sqrtHz
- DARM spectrum at 104.75 Hz = 4.49421 x 10⁻¹⁷ m/sqrtHz
To be celar, I attach a zoomed version of the previous plot. See below.
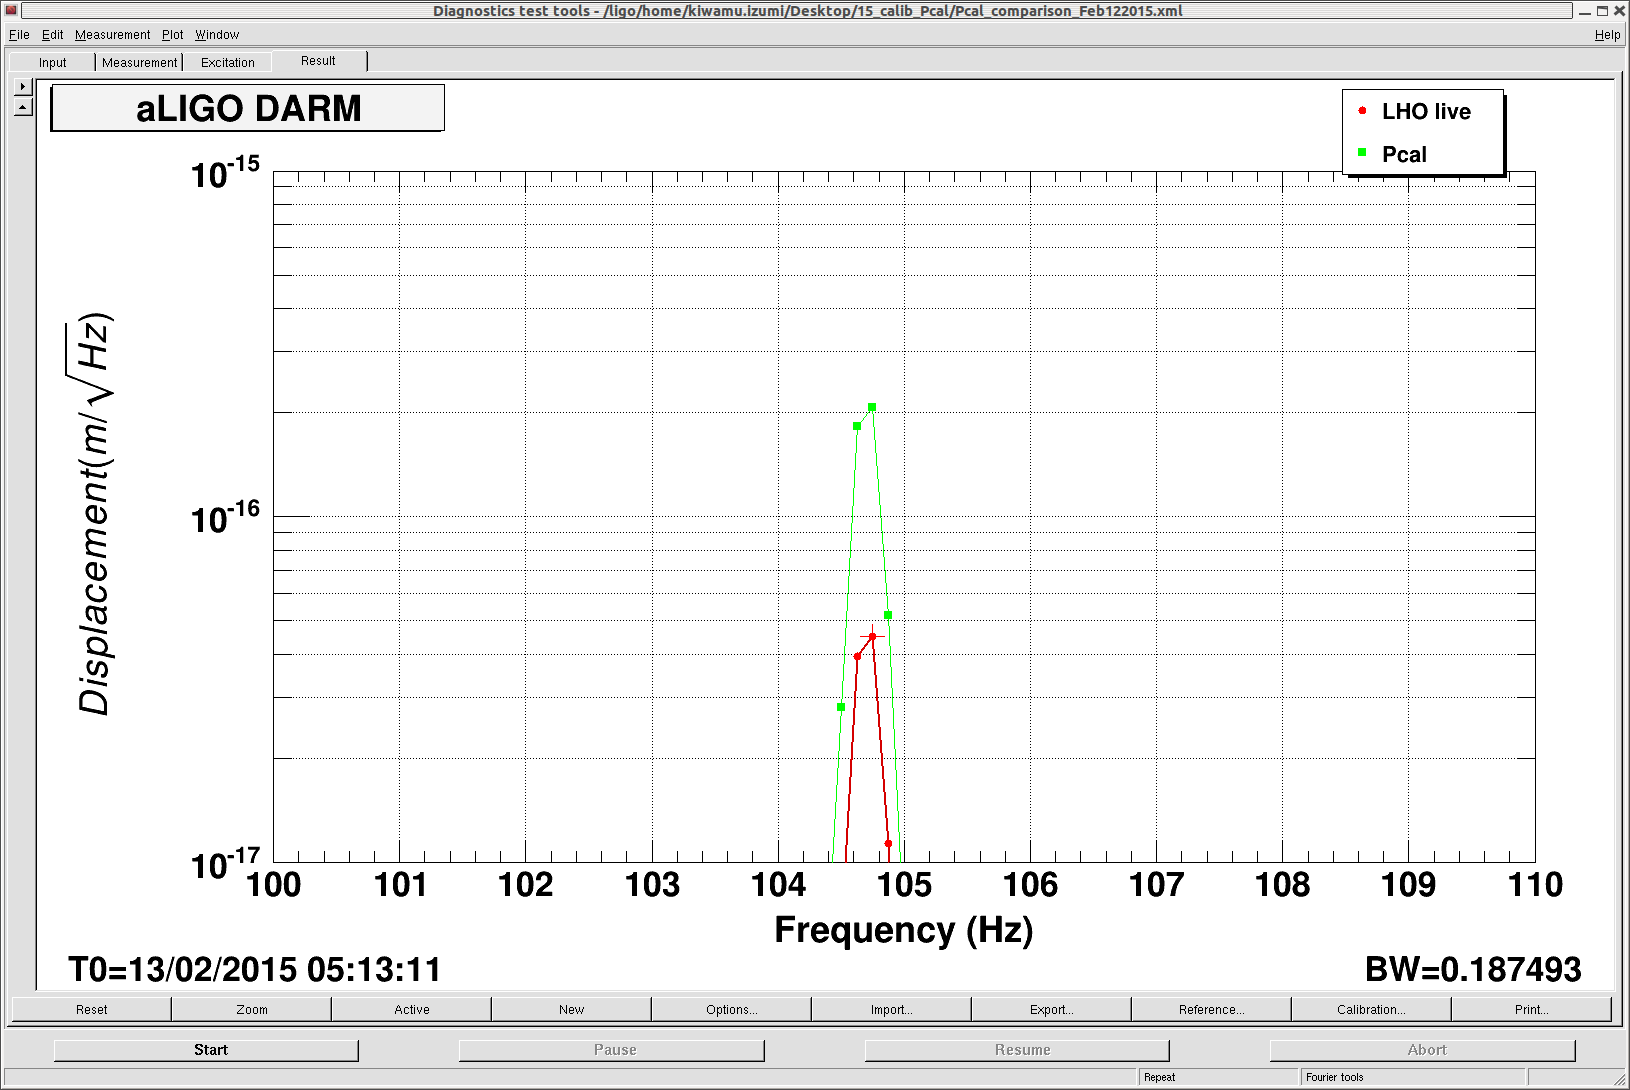
Taking the ratio of Pcal/DARM, I again confrimed that the ratio is 4.6185. This is the number I quoted in the original alog. Here, I repeat a conclusion I said in the original alog: since we now know that the DARM calibration was off by a factor of 3.18 on Feb 12th, if we apply this correction the descrepancy between Pcal and DARM would have been a factor of 1.45 or 45 % with the Pcal greater.