jeffrey.bartlett@LIGO.ORG - posted 14:07, Friday 27 February 2015 - last comment - 16:22, Friday 27 February 2015(16978)
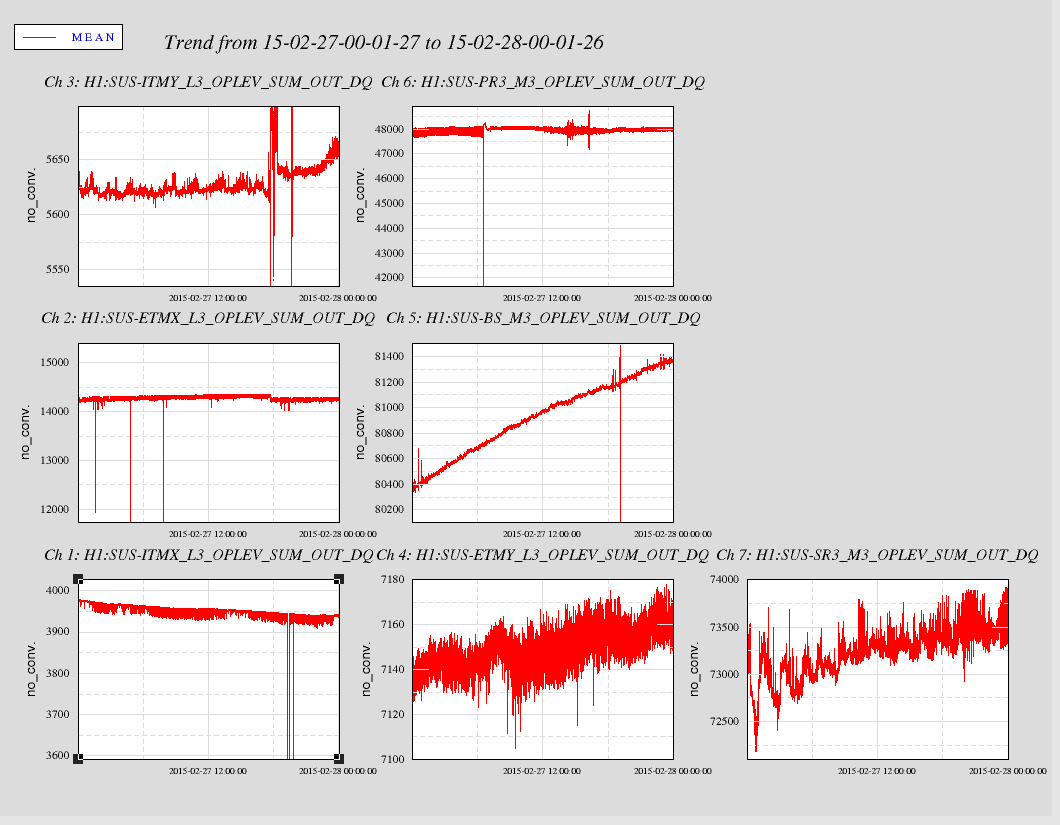
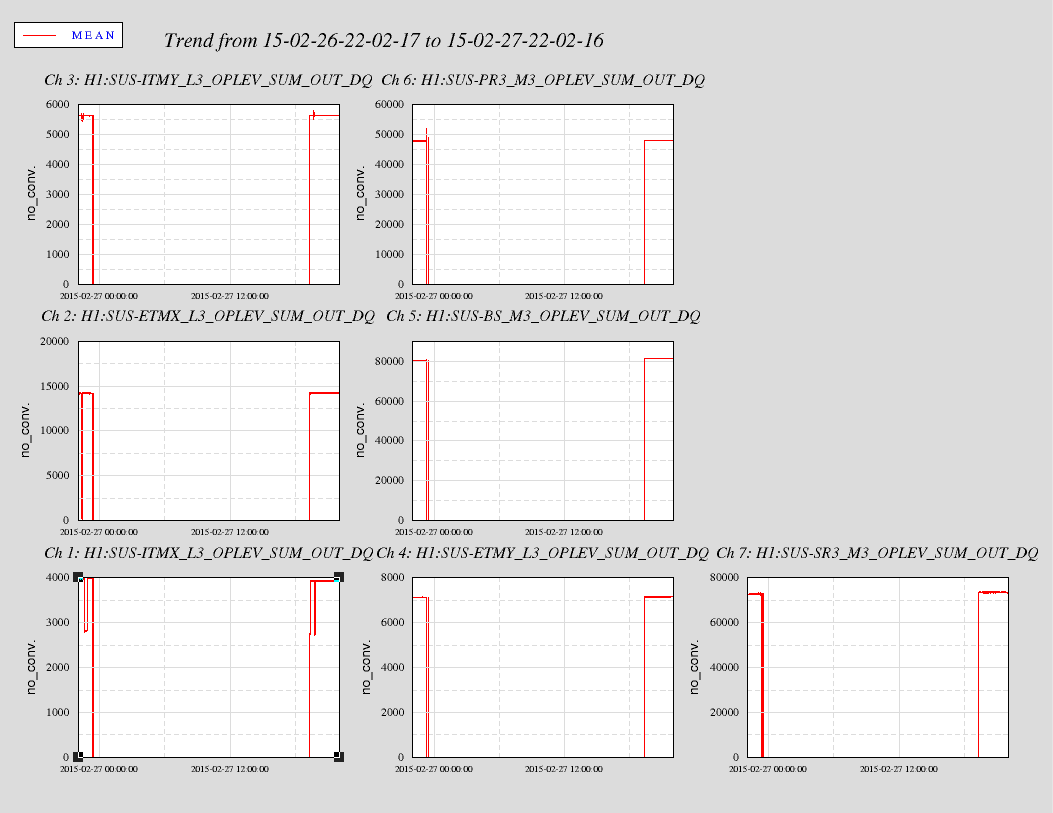
24 Hour OpLev Trend
The plots below are the 24 hour OpLev trends
Images attached to this report
Comments related to this report
First plots did not show all the data. Reran the the plots and zoomed in to show greater detail. The second plots shows more interesting data. For future plots will continue to zoom.
Images attached to this comment