jeffrey.bartlett@LIGO.ORG - posted 14:43, Monday 02 March 2015 (17024)
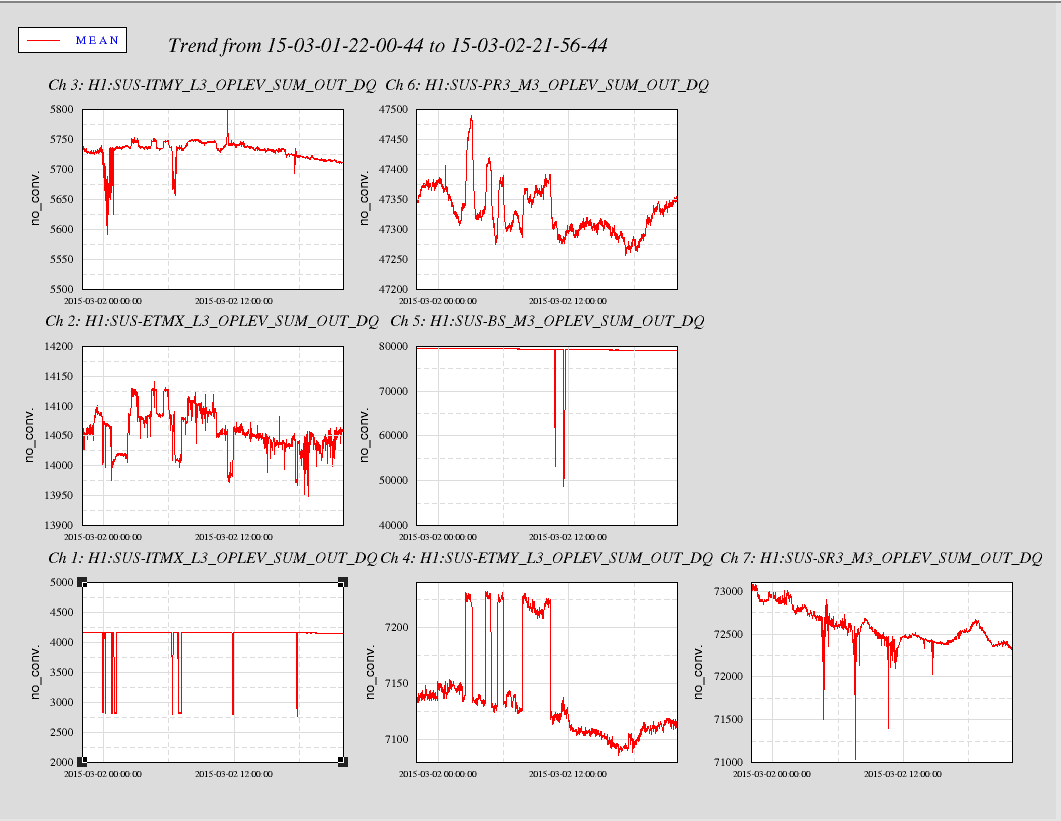
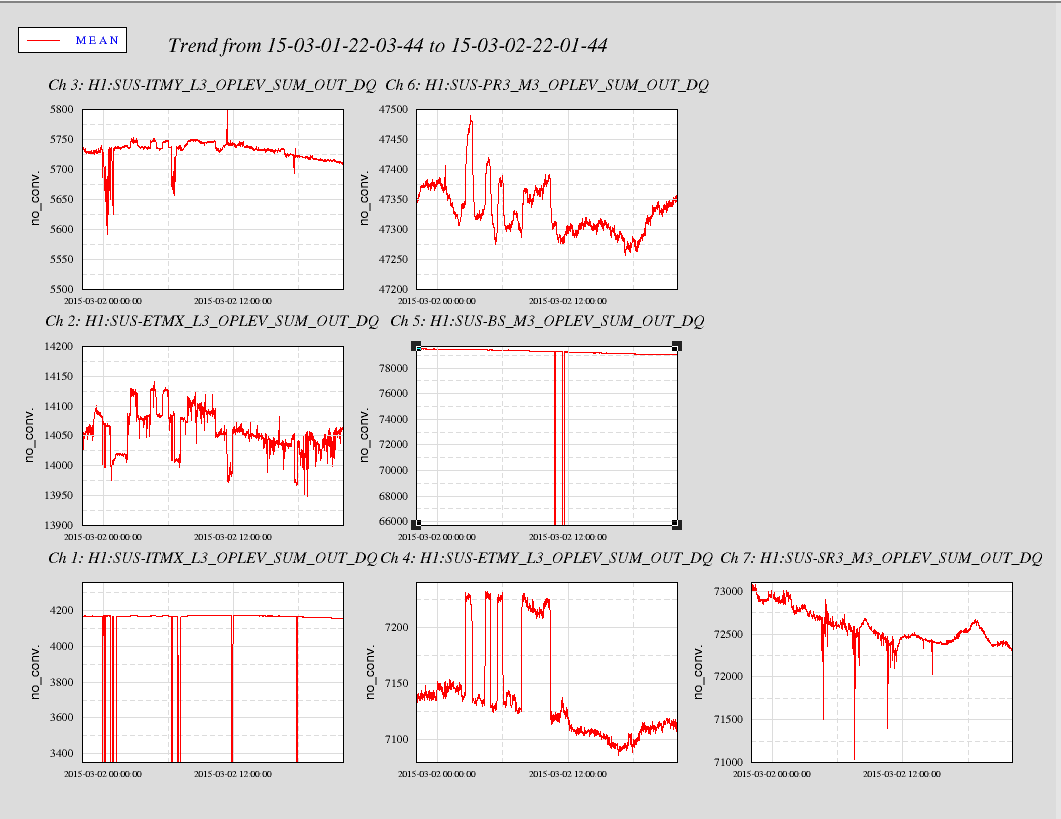
24 Hour OpLev Trends
   Have posted two sets of plots; one is with no zoom and the other with zoom in on ITMX and BS. The four peaks on ITMX has some time correlation with the peaks on ITMY and ETMY. The time of the second peak on the BS correlates with the third peak on ITMX. There is no clear pattern with the peaks on all 7 OpLevs being plotted. Will discuss with the OpLev folks.

   These plots are run with minute trends not second trends, due to an error with plotting the second trend data. I an looking into the cause of this error.
Images attached to this report