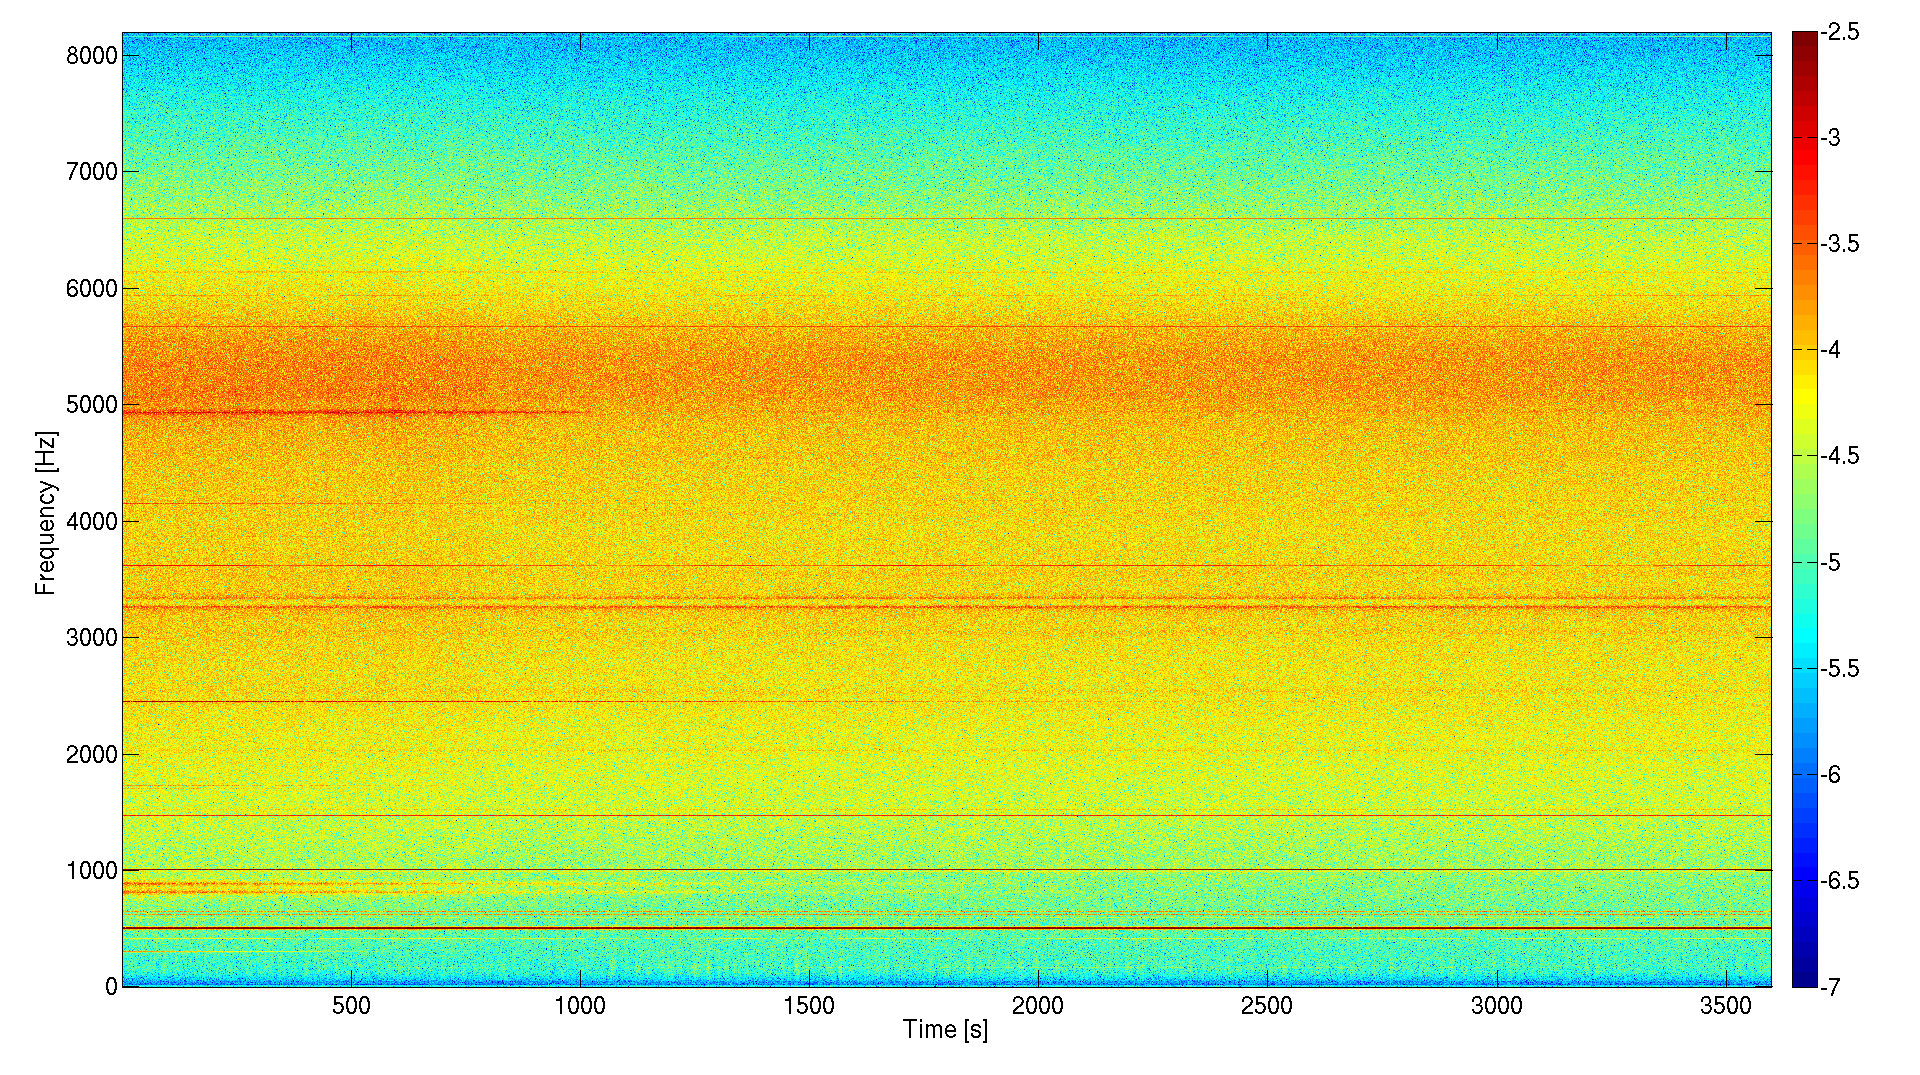
Last night lock in DC readout lasted about one hour, with good stability of build ps on the on term. However, looking at the noise spectrogram, one can find some interesting non stationarities. The first plot is a spectrogram of the high frequency part, which is mostly stationary, except for a line at about 5 kHz which seems to ring down during the lock.
Twin peaks at 800-1000 Hz
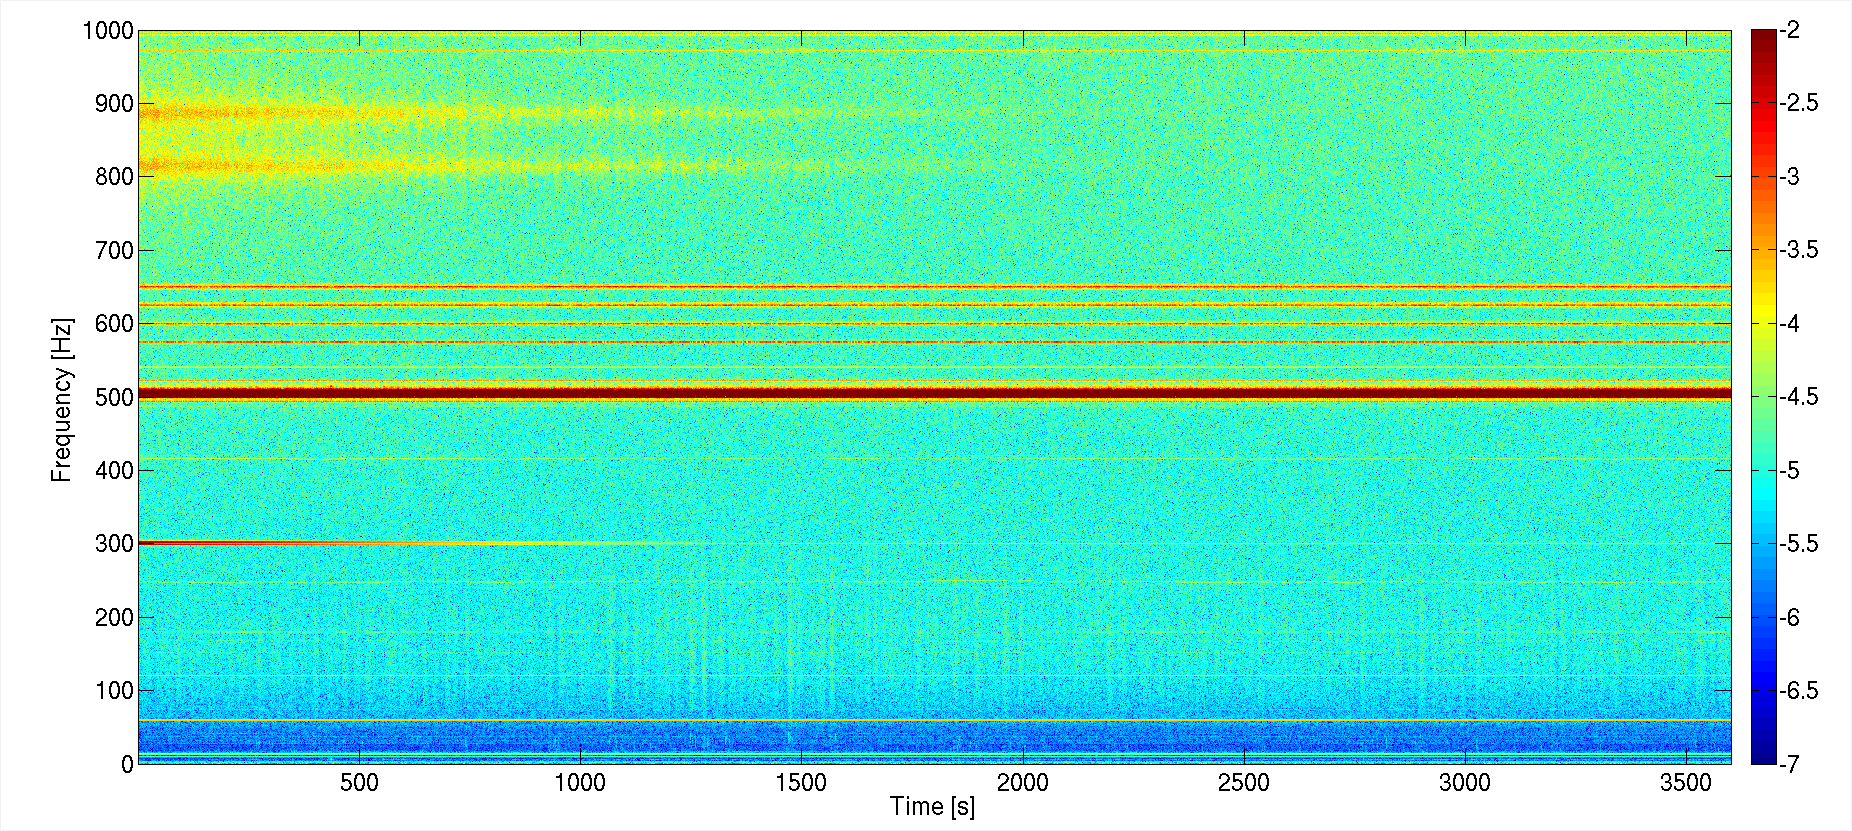
Between 800 and 1000 Hz we've always seen two broad peaks, see the second attached spectrogram. Those peaks are usually high at the beginning of some locks, and gets lower. Out first guess was that they get better because the alignment is improved. However, during last nigh lock there was no human intervention to improve the alignment, and the two peaks got smaller with a time constant of about 15 minutes. It seems unlikely that they are mechanical modes ringing down, since they are too broad. There seems to be some correlation with a much narrower peak at 300 Hz: this peak roughly decay with the same time constant.
I ran my brute force coherence, and remarkably there isn't any signal showing any significant coherence with the twin peaks.
Mid frequency non stationarity
The noise in the 100-300 Hz region is still non stationary, altough the situation is much better than before (closing DHARD with high gain helped). The third plot is a spectrogram of the region, showing the noise moving up and down in amplitude.
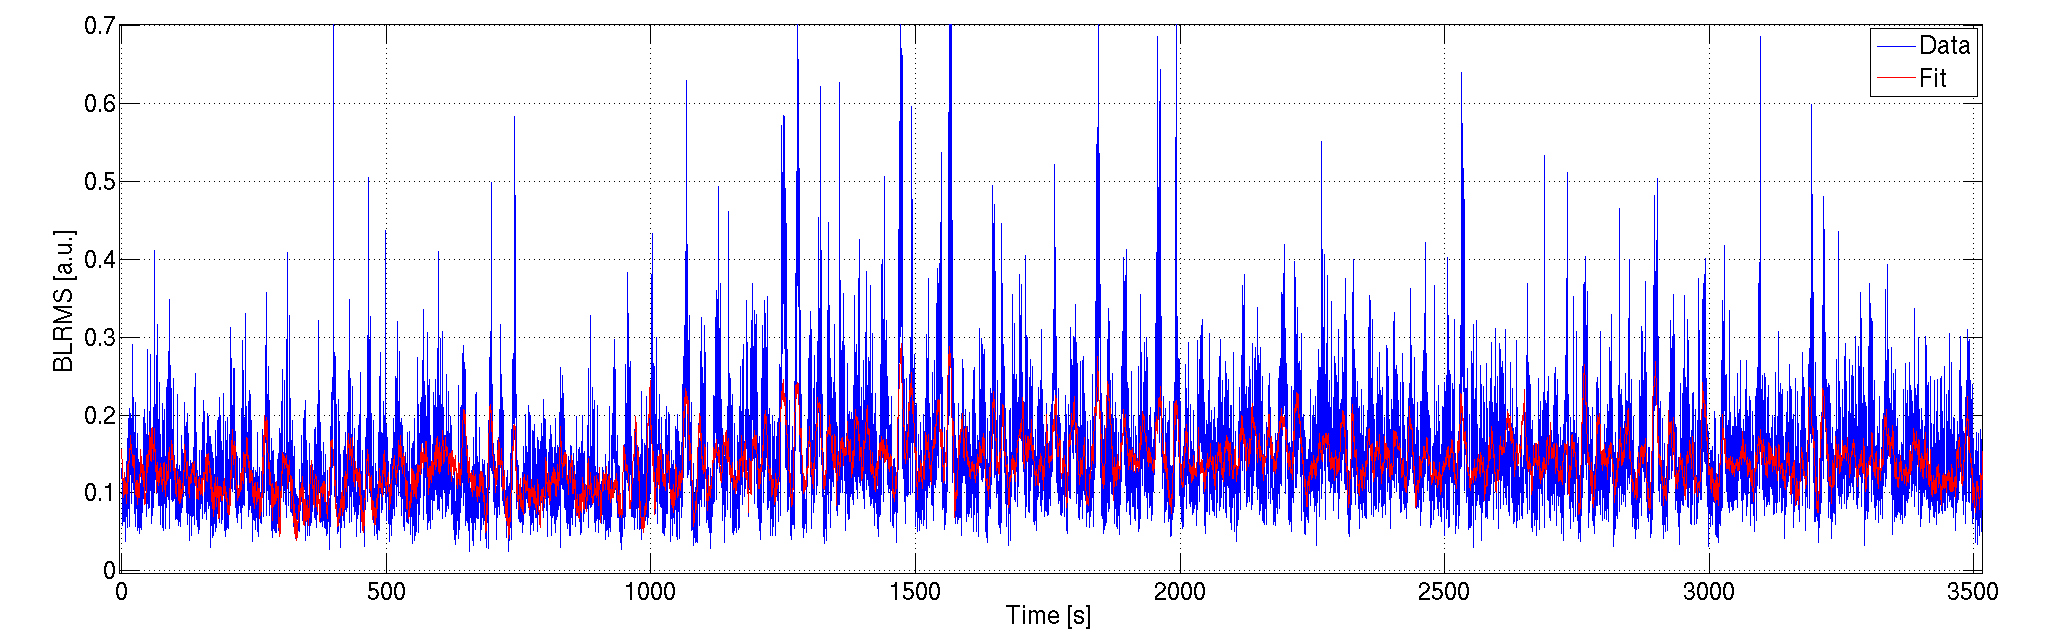
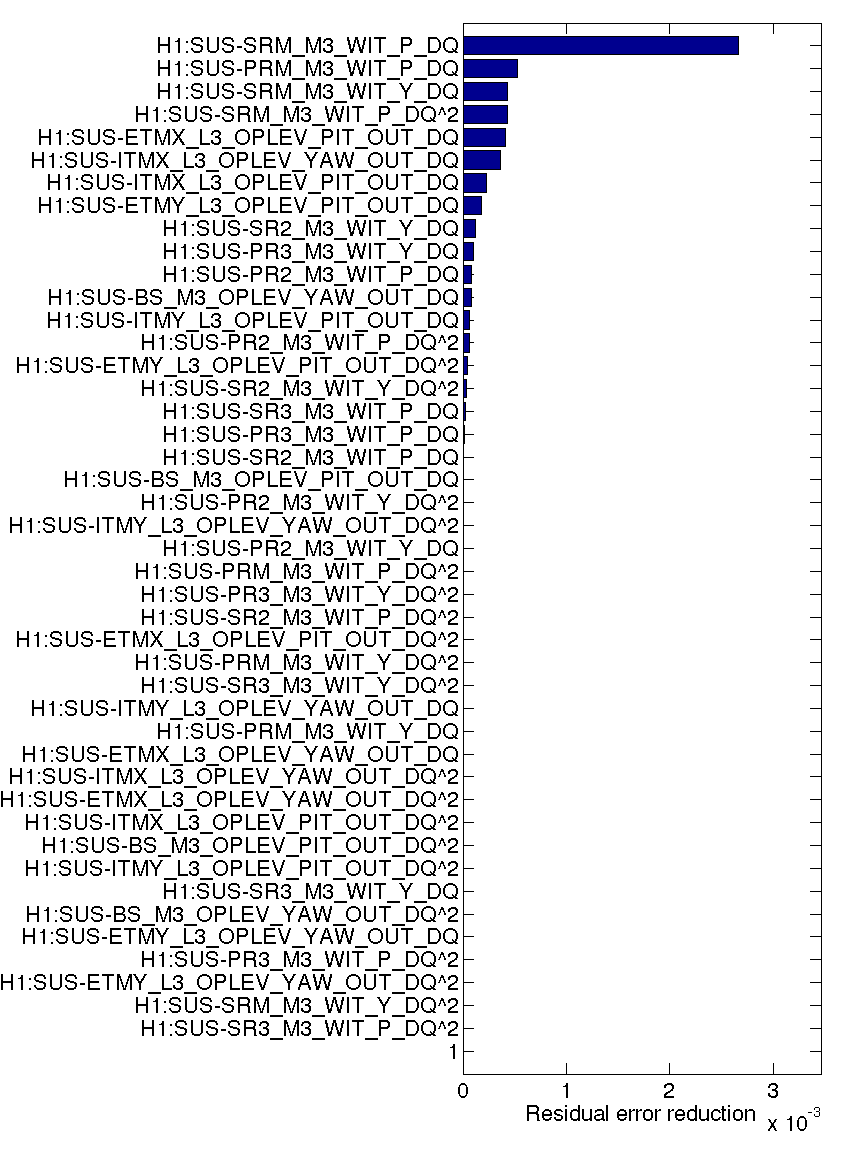
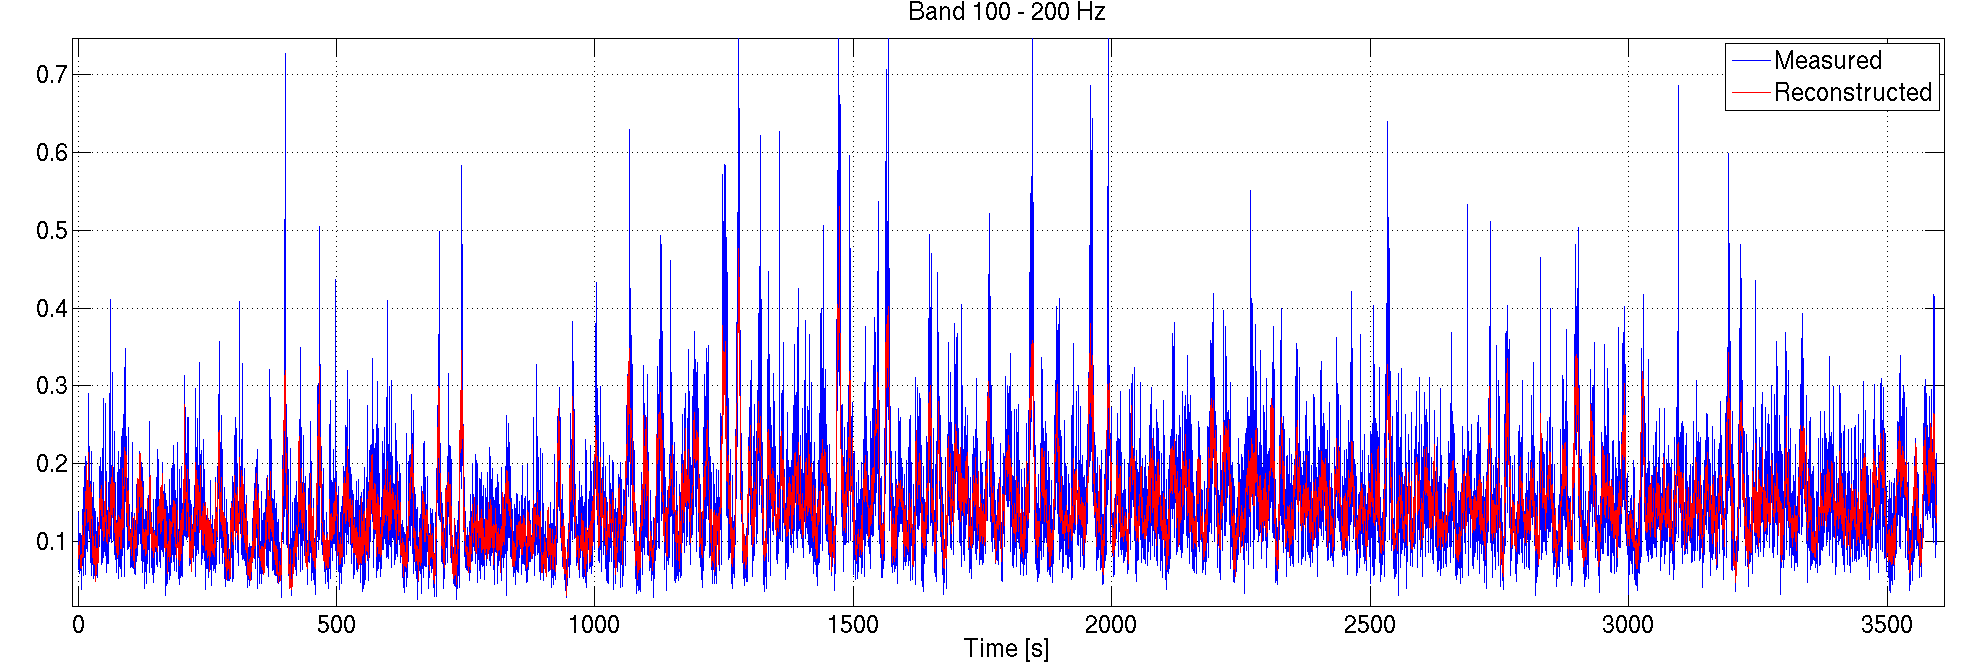
The fourth plot shows the band-limited RMS in the region between 100 and 200 Hz, after notching out the 120 and 180 Hz main lines. The blue trace is the measured BLRMS, while the red trace is the least square fit to it using all mirror local sensors (ETMs, ITMS, PR*, SR*, BS). The reconstruction is quite good, at least for most of the slower variations. Using the same kind of code described elsewhere, I produced a list of the channels ordered from the one that contributes most to the one less important. This is shown in the 5th attachment. The channels are listed in order of descending importance. The blue bar shows how much each channel contributes to the BLRMS fluctuations. It seems that most of the noise non stationary is caused by residual motion of the SRM and PRM.
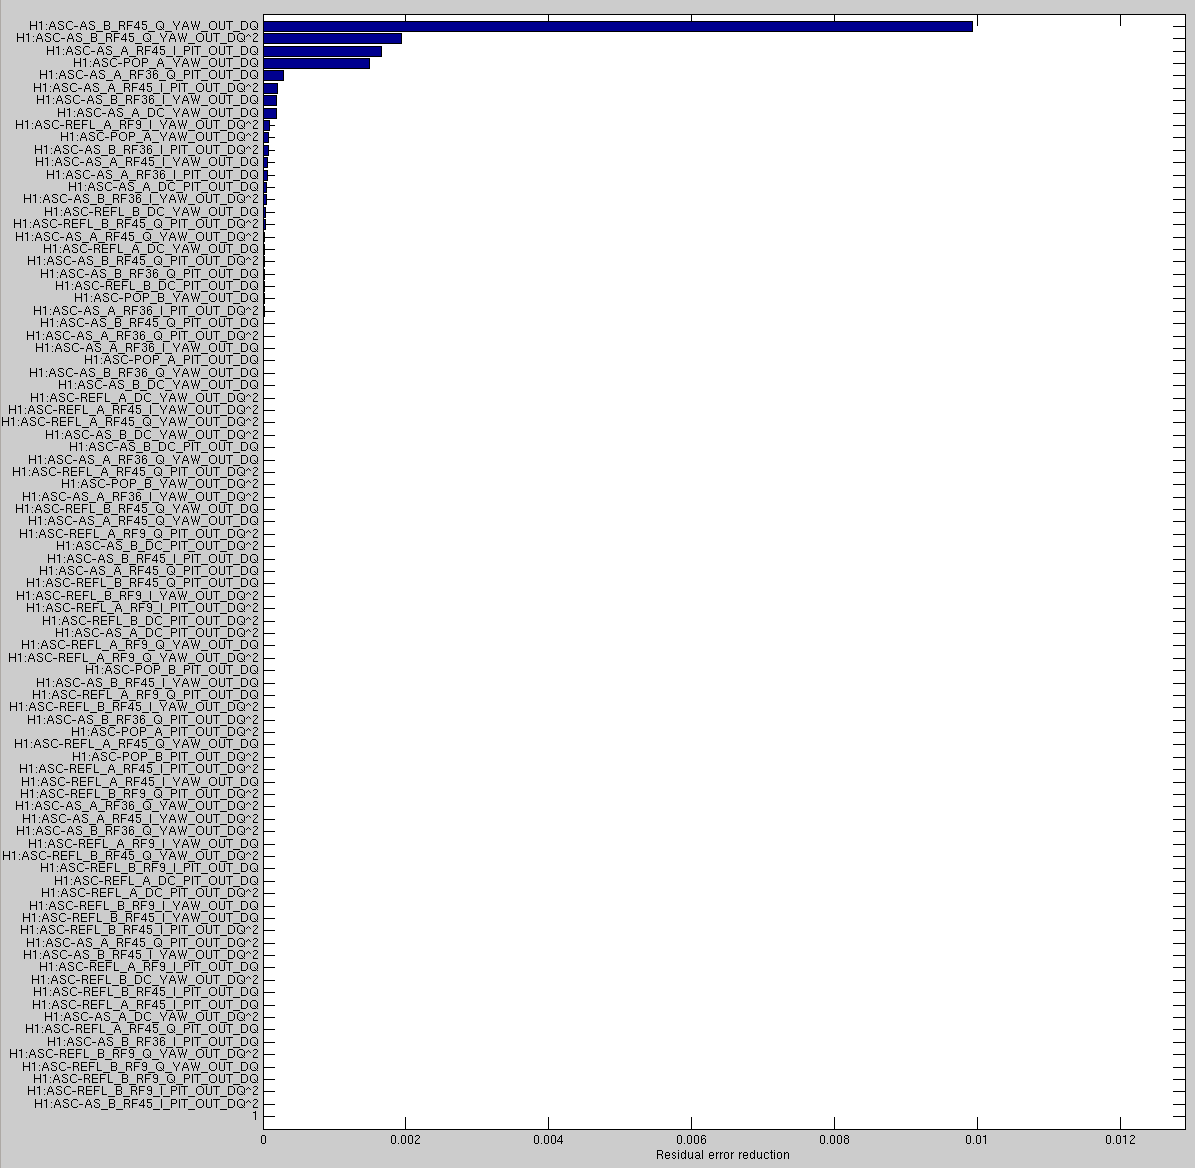
Another way to look into what is causing the residual angular motion is to use directly the ASC signals instead of the local sensors. The advantage is that ASC signals should be much cleaner than the local sensor. The drawback is that it's more difficult to trace back to which angular d.o.f. is important. The 6th and 7th attachments shows respectively the BLRMS fit and the channel ranking using the ASC signals. First of all, the reconstruction of the BLRMS fluctuations seems to be more accurate. It looks like that most of the BLRMS fluctuation can be related to AS_B_RF45_Q_YAW, including both the linear and quadratic terms. This signal was not used for any ASC loop (we are using AS_A_RF45_Q for DHARD). This is a bit surprising, since the BLRMS fit using local sensors pointed to a picth motion as he largst contribution, while the ASC signals point to a yaw motion...
Wandering lines
Looking again the the low frequency histogram (third attachment), there are at least two narrow lines that slowly move in frequency. They are at about 168 and 249 Hz. It seems to me that they move in a correlated way. They might be generated by some fan or other spinning electromechanical device. I can't find any coherence with environmental channels, but the lines are coherent with SRCL and LSC-POP_A_RF45_I