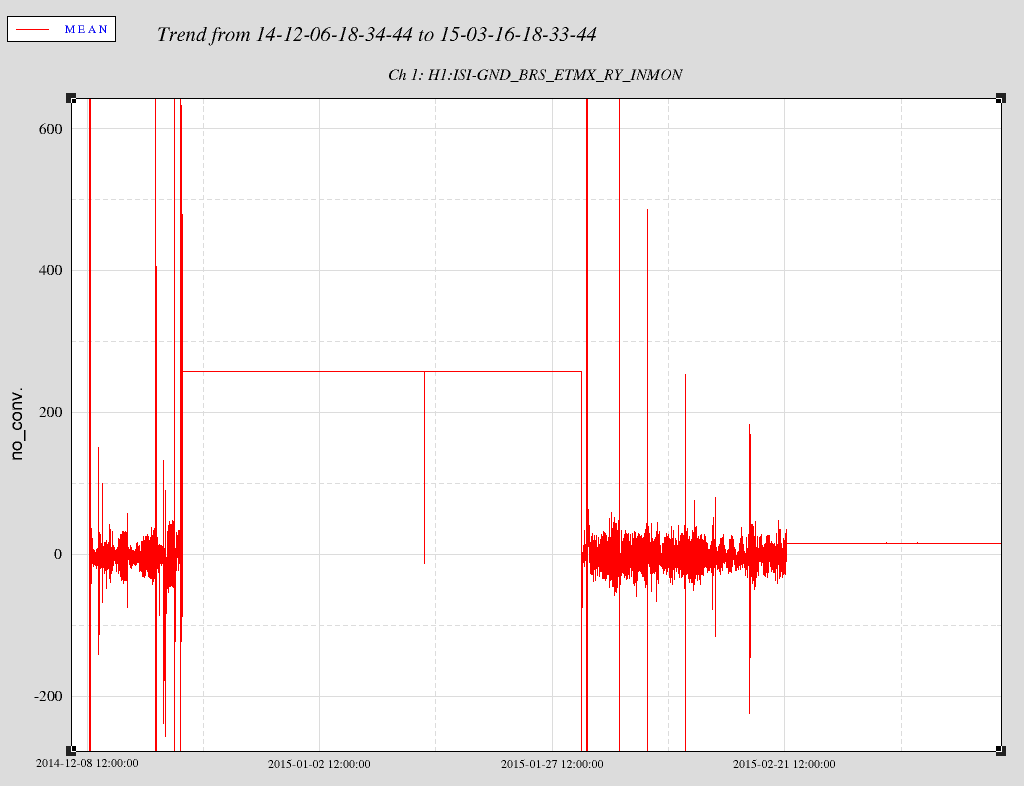
See the attached for trends of the BRS for health assessment. It has been down since ~22 Feb.
The first plot is the minute trend of H1:ISI-GND_BRS_ETMX_RY_INMON. This is 100 days of just the mean and the flat lined sections are BRS in trouble areas. The 2nd attachment is a 60 minute second trend. This shows the healthy 9mhz signal of the BRS.
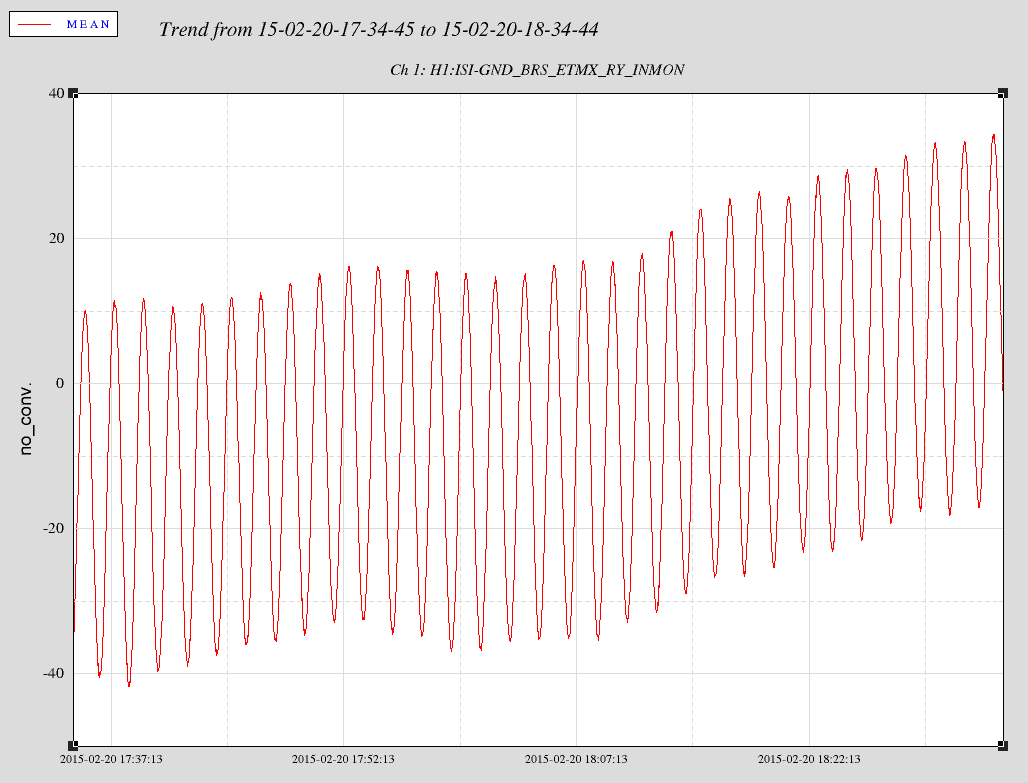
Thanks Hugh. Some comments: The BRS was turned off around Dec. 18th for the ETMX vent and restored after things normalized again in EX VEA. The 'spikes' in the BRS data are mostly the disturbances from people in it's vicinity, which is damped quickly (in ~10 mins). Therefore in the normal/good state BRS_RY_INMON shows between 5-50 count amplitude and 9 mHz oscillations, as Hugh showed. When the BRS software crashes, the output remains flat and shows <2 count variation.
Currently the software crashes once in 2-3 weeks. A preventive restart (which takes <10-15 minutes) once in two weeks would be useful till a better solution can be found.