Sheila, Nutsinee
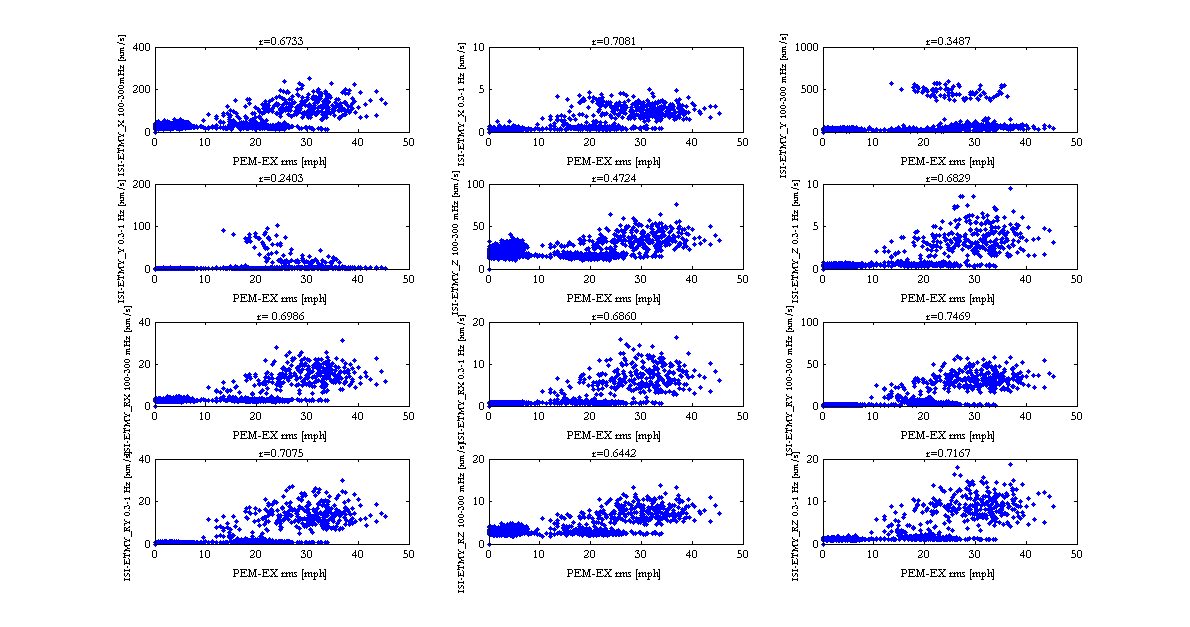
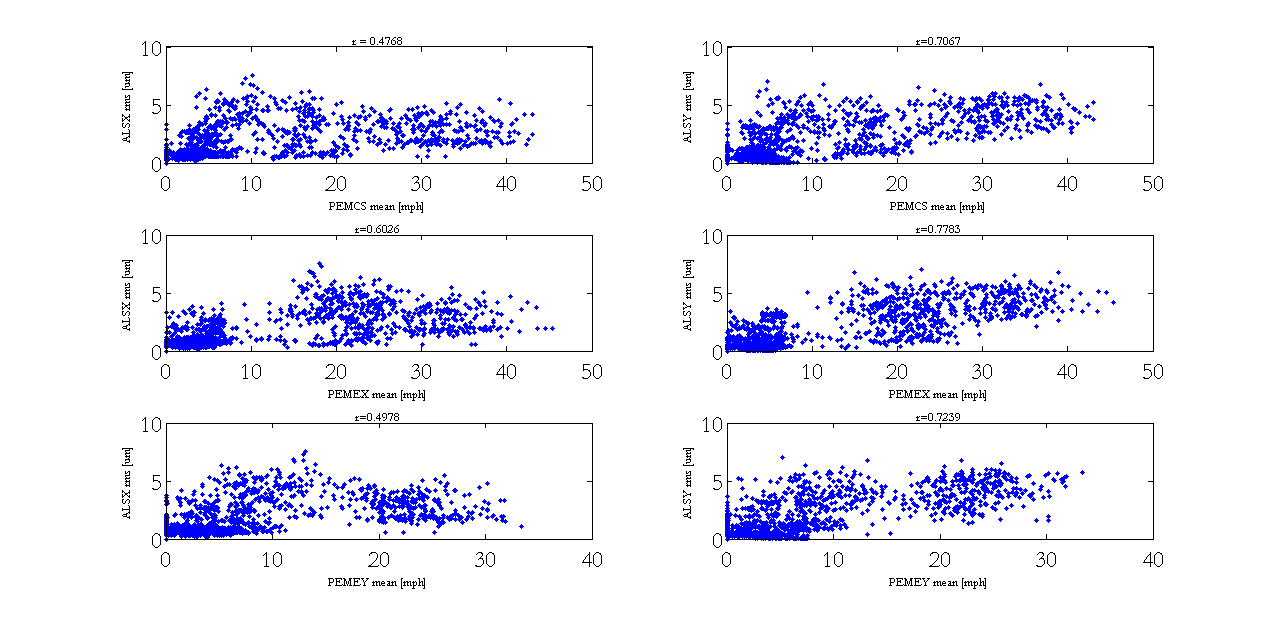
Attached below are the plots of PEM/ALS and PEM/ISI correlations. Using data from March 14 (we had high wind up to 45 MPH). The x-axes are wind speed in mph, the y-axes are either ALS-X(Y)_REFL_SCTRL_OUT_DQ (rms) or ISI-ETMY_ST1_FFB_BLRMS_(DOF)_(100M or 300M)_(300M or 1) (mean). The correlation (r) is calculated and printed in the parentheses. Since PEM-EX and ALS-Y seems to correlate the most (r=0.7783) I only plot the correlation between PEM-EX and ISI-ETMY for the PEM/ISI correlation. PEM-EX and ISI-ETMY-RY (100-300 mHz) appears to have the highest correlation (r = 0.7469).
A Matlab script also attached.
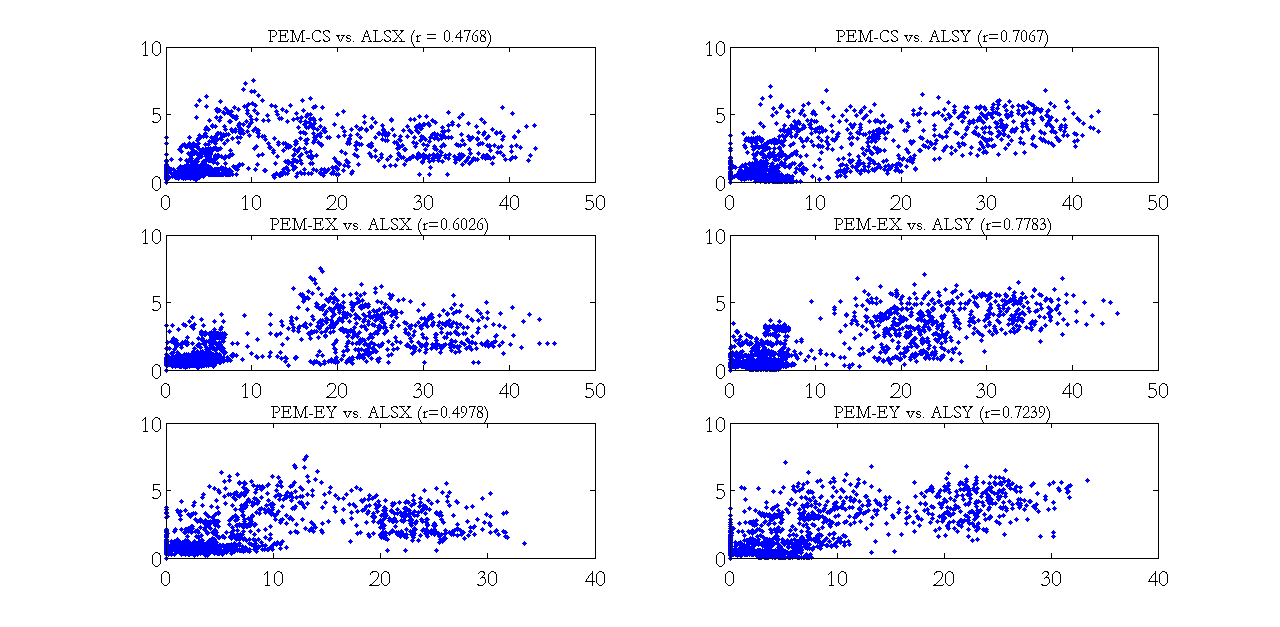
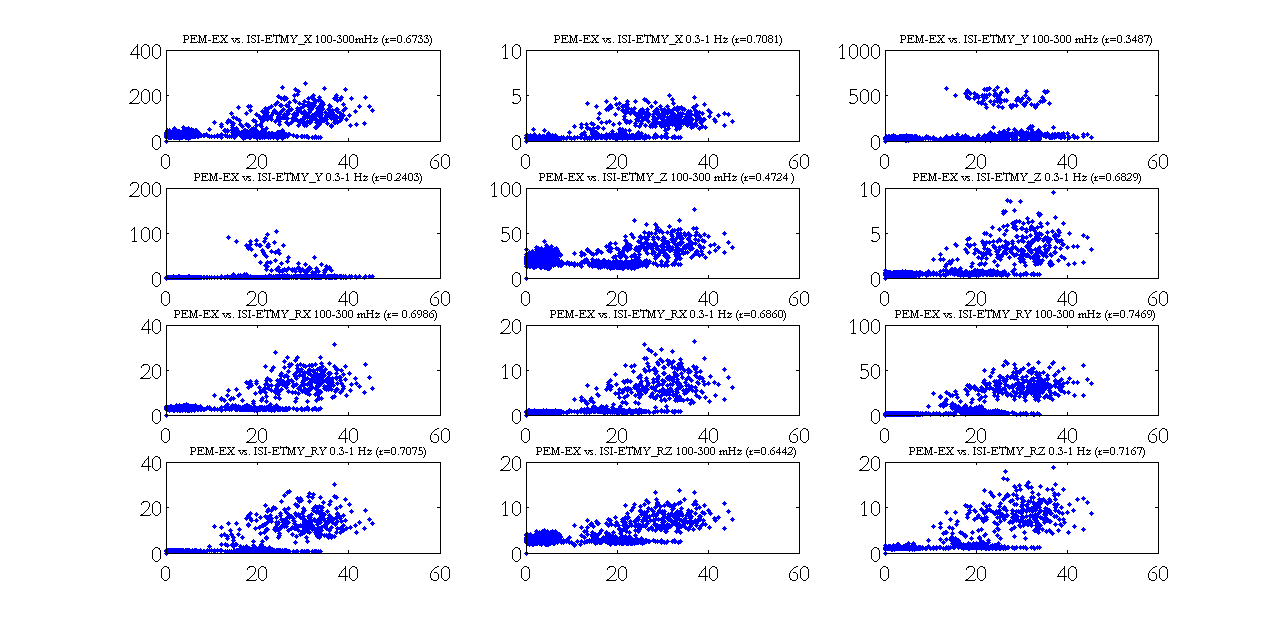

My apology for the lack of axes labels earlier. I have attached better plots below....
Also, note that PEMEX, PEMEY, and PEMCS is in X, Y, Z direction (not locations). Also, the "ISI-ETMY_ST1_FFB_BLRMS_(DOF)_