OPLEV Overview Screens UPGRADED
Following Stuart Aston's suggestions I have added:
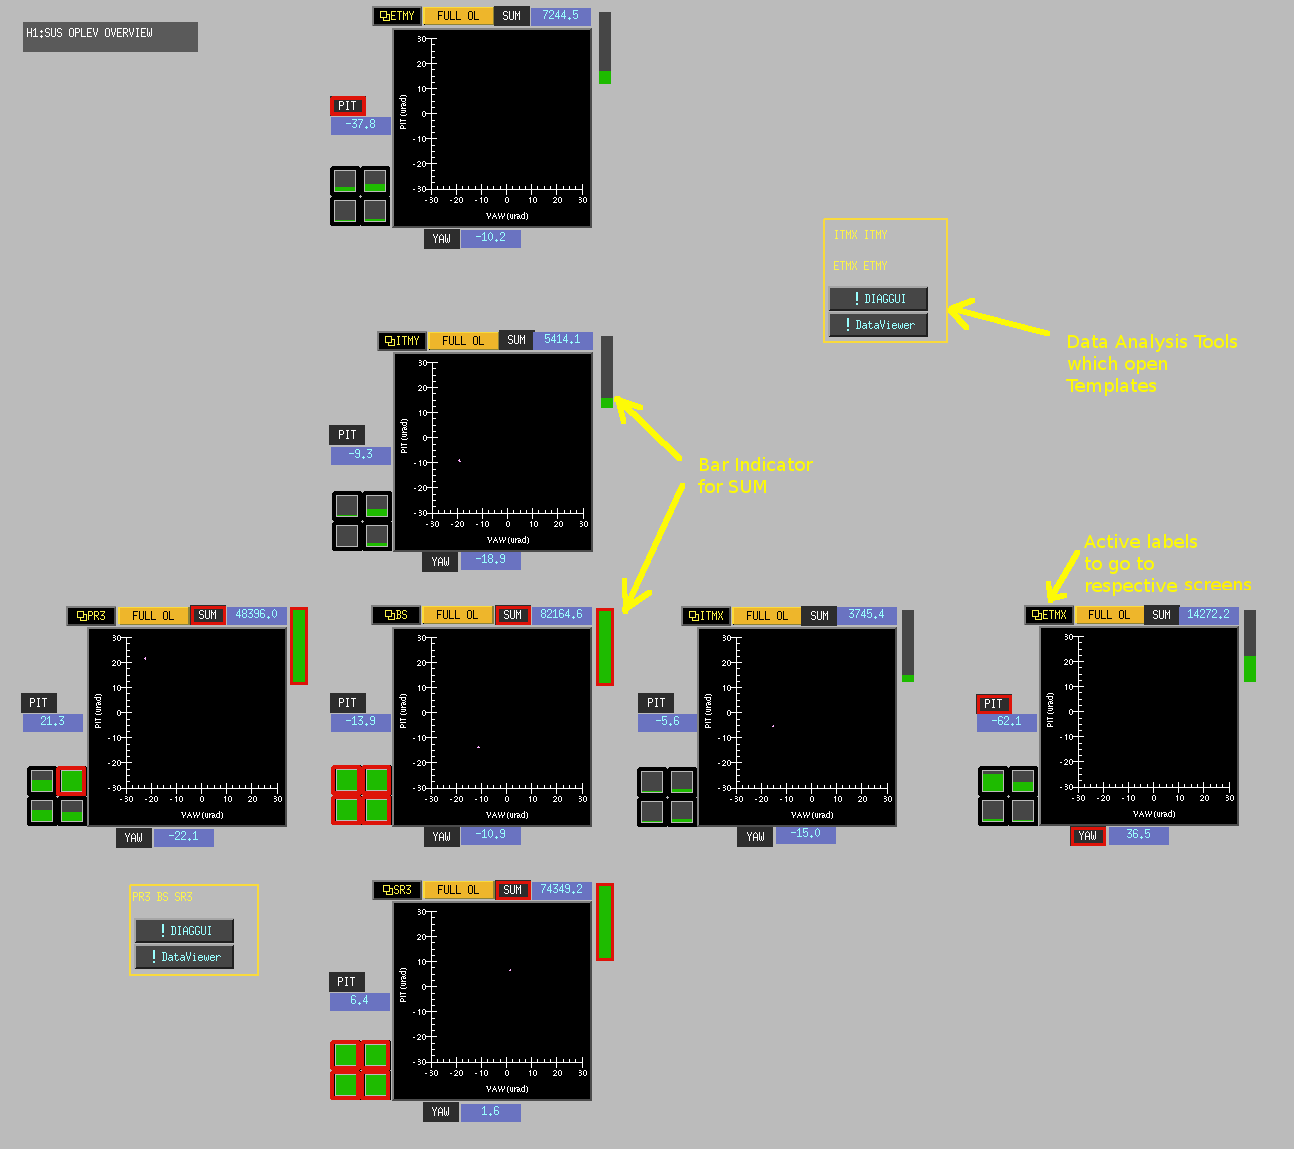
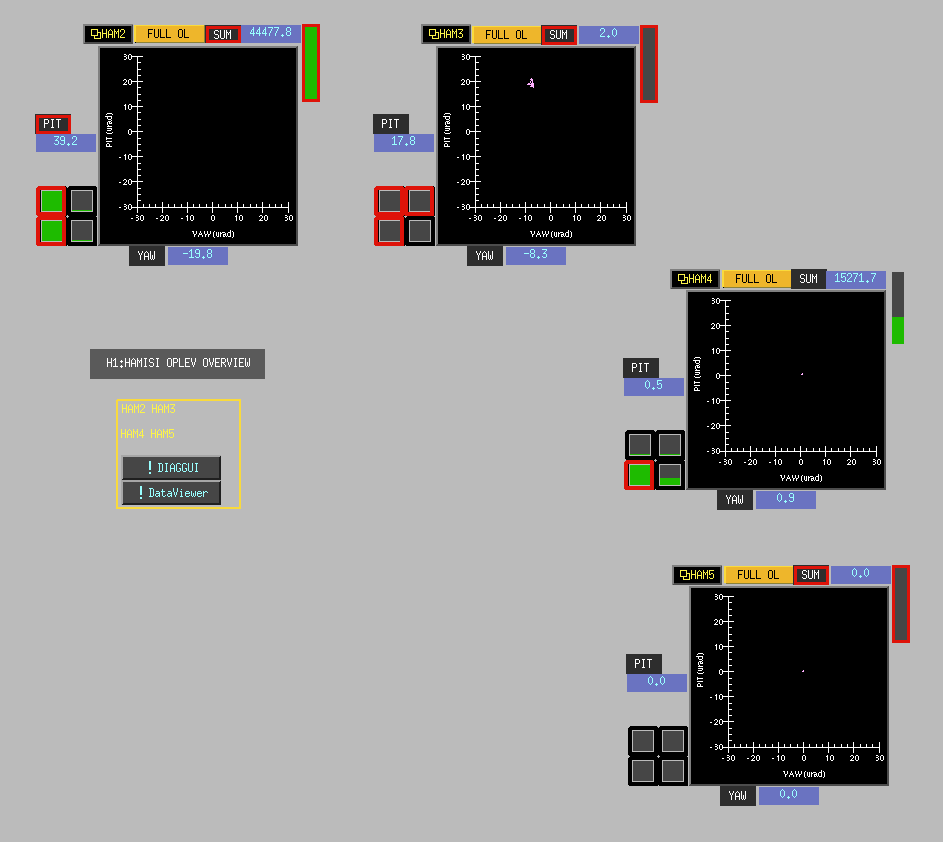
1) a bar indicator to show the SUM value. This enables us to tell at a glance if the value is close to saturation
2) a set of menu buttons to call data analysis tools like Diaggui and Dataviewer, which open corresponding templates so that we can look at time series and spectra of relevant channels.
3) a button to every oplev screen which accesses the SUS or ISI corresponding to the Oplev, so that, if the oplev is misaligned, the corresponding suspension or table can be reached directly from this screen.
SITEMAP updated:
I have removed the menu items in ISI tab for reaching individual HAM ISI Oplevs. As we now have the overview screens and also command line scripts to access individual oplev screens I have reduced the complexity of SITEMAP by removed these menu items.
All screens have been committed to the svn and can be customised at LLO
Screenshots attached: