lisa.barsotti@LIGO.ORG - posted 11:11, Wednesday 25 March 2015 (17460)
Impact of wind on range
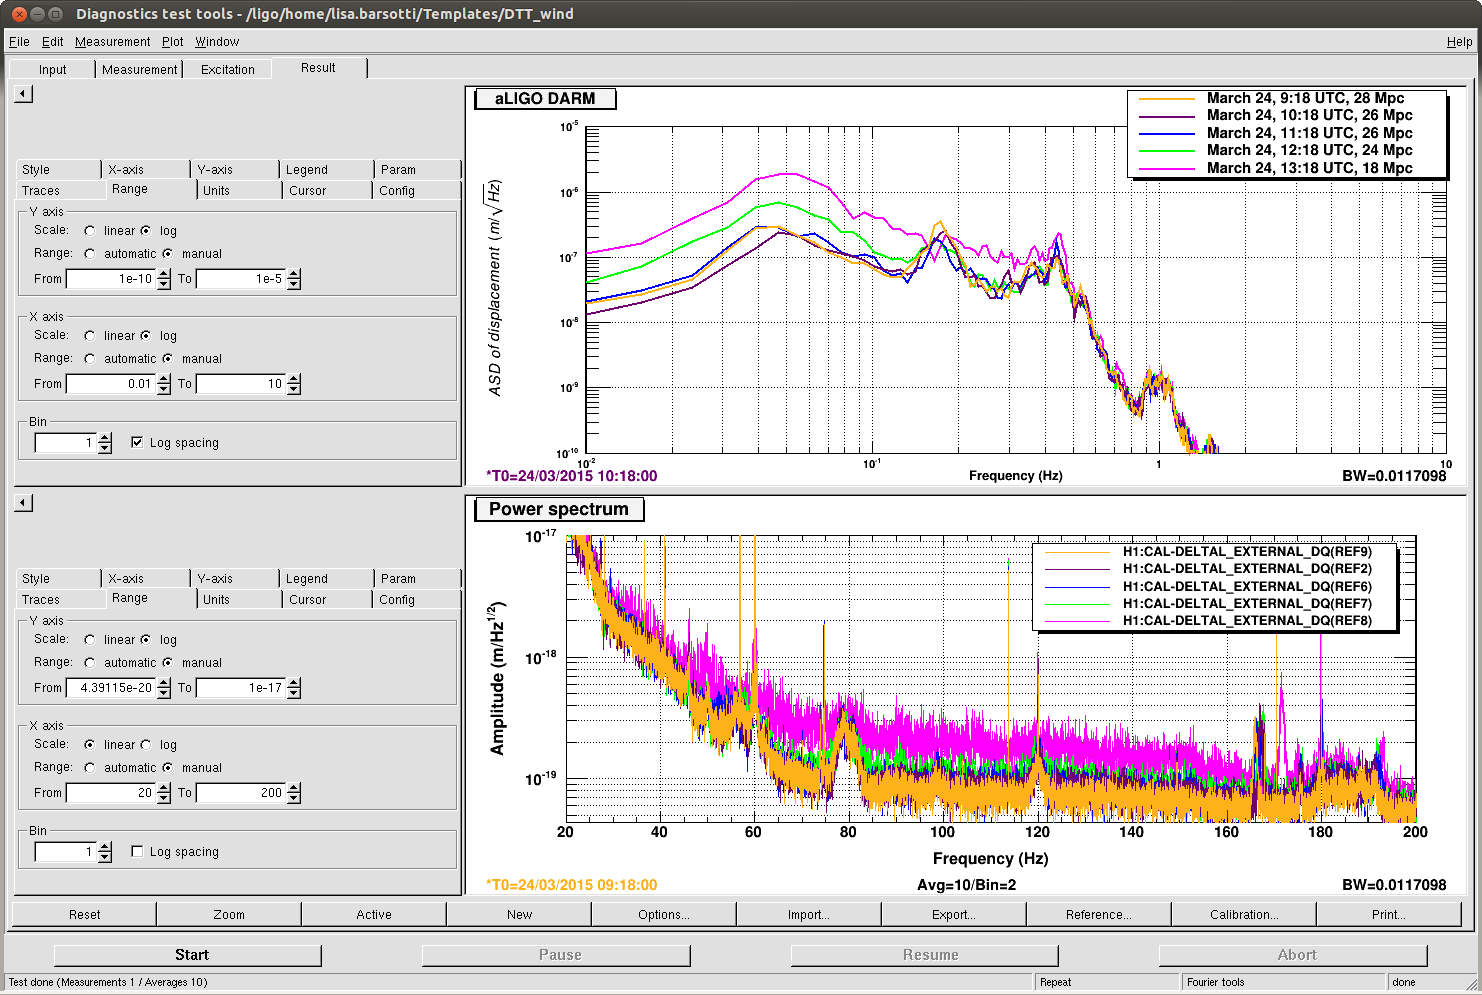
Sheila and Dan made this nice plot to show how the range degradation during the lock the other night was well correlated with the wind going from 0 to 20 mph. This plot has the calibrated DARM spectrum, zoomed in two regions (10 mHz - 1 Hz) and (20 - 200 Hz), showing how the excess of noise in the low frequency region is up-converted in band. Here we had the "nominal no wind" 45 mHz blend for the ISI, as there was no wind when we left.
Images attached to this report