gabriele.vajente@LIGO.ORG - posted 13:38, Wednesday 25 March 2015 (17464)
Wandering lines
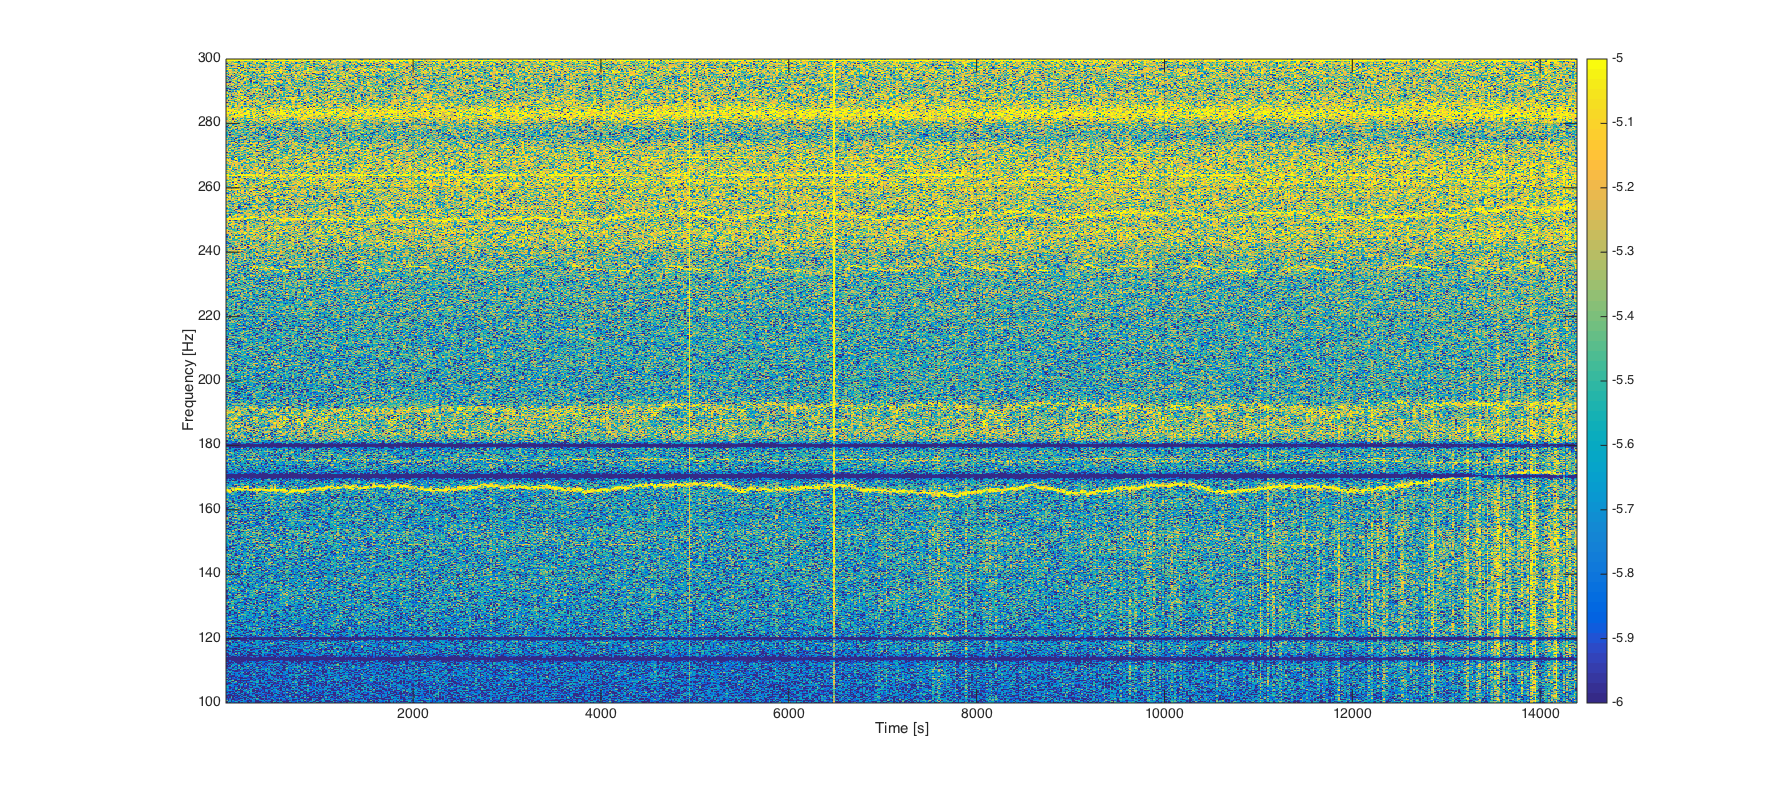
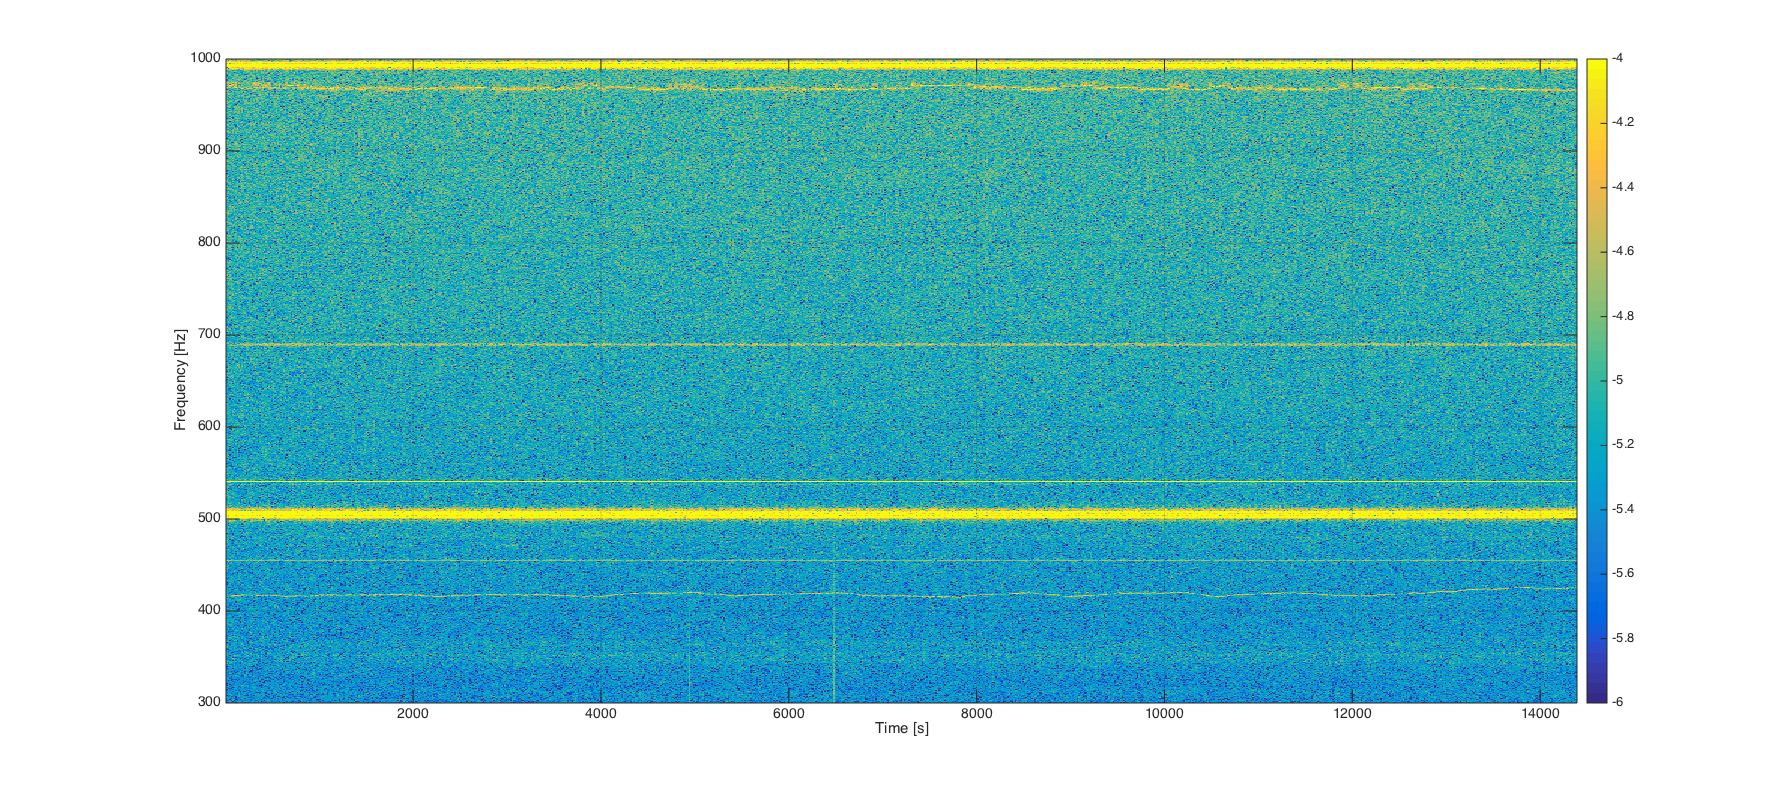
Looking at the DARM spectrogram, there are few lines that wander around in frequency over long periods of time:
- 166 Hz, showing high coherence with SRCL
- 235 Hz, showing coherence with PSL Periscope (not sure if this is the real origin of the line)
- 250 Hz, showing coherence with PRCL
- 416 Hz, showing coherence with SRCL/PRCL and moving in frequency like the 166 Hz.
- 970 Hz, showing coherence with PRCL
The attache spectrograms show all these lines. I wrote I simple peak identification script (attached) to extract the frequency as a function of time. It's not perfect, so the traces are kind of noisy, but they should be good enough to try to correlate them with some slow channels (power, temperature, angular drifts, etc.). Unfortunately it's too painful to access remote data for me right now, so I'll let this analysis to somebody else...
Attached a txt file with the frequency of the lines a function of time (firt column) measured in seconds from GPS time 1111224616
Images attached to this report
Non-image files attached to this report

