SudarshanS RickS
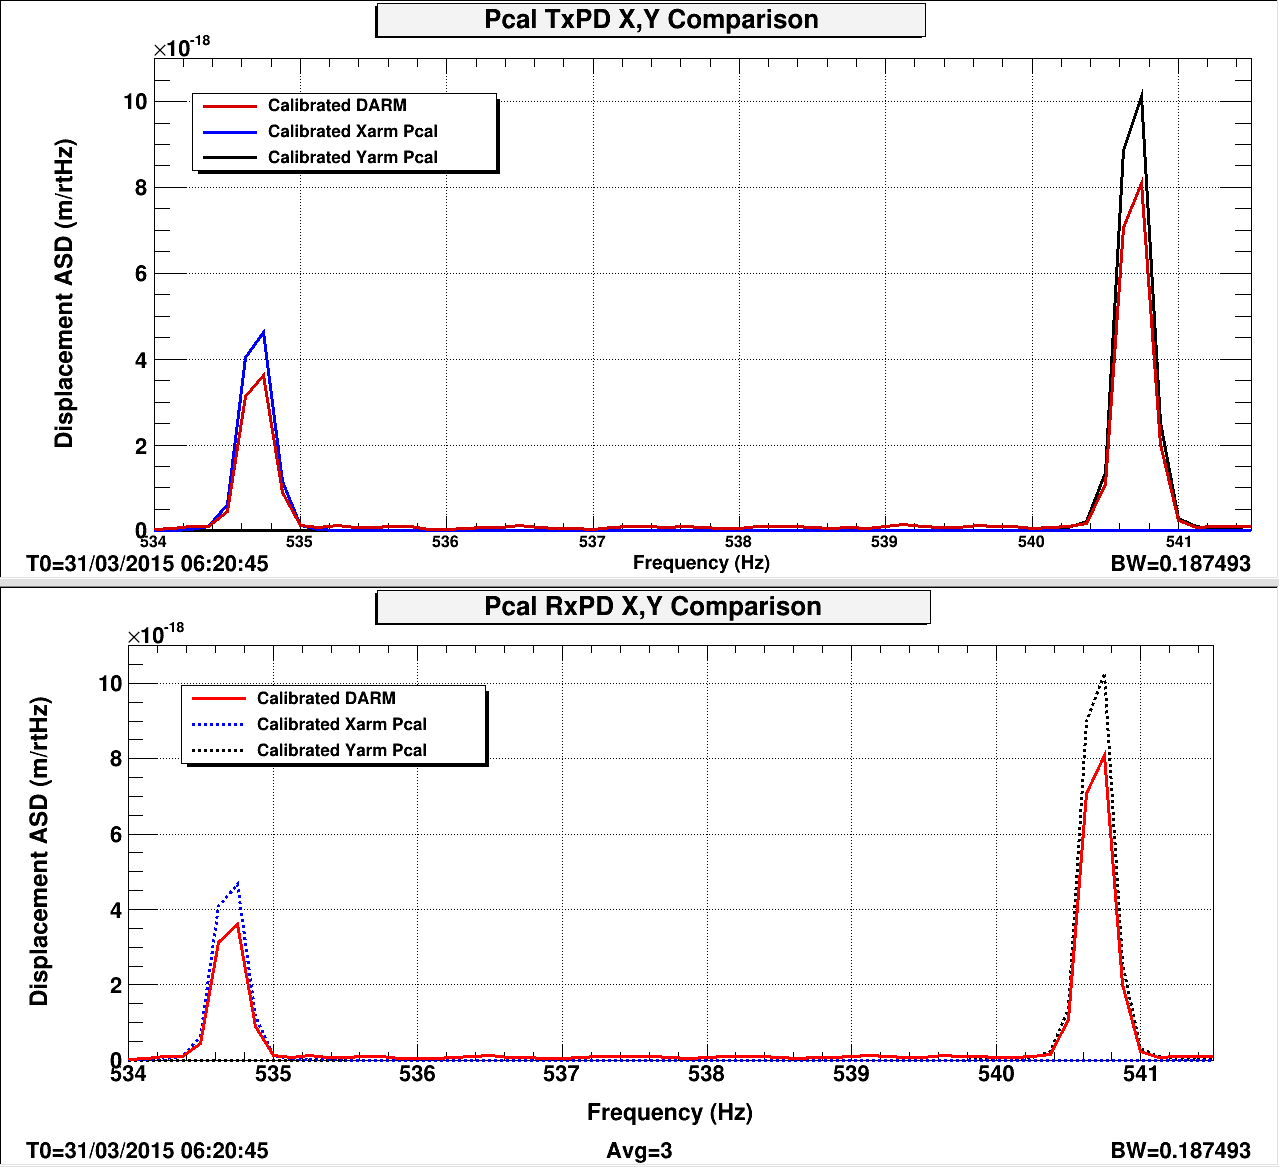
Using a lock stretch from last night, we compared the Xarm and Yarm Pcal calibrations using the calibrated DARM spectrum (see plots attached below). We assume that any errors in the shape of the DARM response function are small over the few Hz between Xarm and Yarm lines.
We have calibrated both the photodector inside the Pcal transmitter modules that samples the transmitted light (TxPD) and the photodetector mounted to the integrating sphere inside the receiver module that captures the light reflected from the ETM (RxPD). Their calibration coefficients are:
|
TxPD (m/V)*1/f^2 |
RxPD (m/V)*1/f^2 | |
|
Xarm |
8.517e-13 | 6.799e-13 |
|
Yarm |
1.789e-12 | 6.861e-13 |
By comparing the ratio of the (Xarm and Yarm) calibrated Pcal photodector peaks with the ratio of the DARM peaks, we can compare the Pcal calibrations at the two end stations.
For the Tx PDs, the ratio of the calibrations is 1.0214 and for the Rx PDs the ratio is 1.0191. Ideally, the ratios would be 1.0. Some of the 2% variation could be due to response function errors in the DARM calibration. We can test this by swapping the line frequencies between the X and Y arms some time in the future.
We plan to repeat the Pcal calibrations to get some insight into statistical variations.
Note that the Pcal estimates of the calibrated DARM displacements are about 25-30% higher than the amplitudes reported by the calibrated DARM spectrum:
| Pcal/DARM | TxPD | RxPD |
| Xarm | 1.28 | 1.29 |
| Yarm | 1.25 | 1.27 |