[Ed. Merilh, Jason Oberling, Doug Cook, Suresh D]
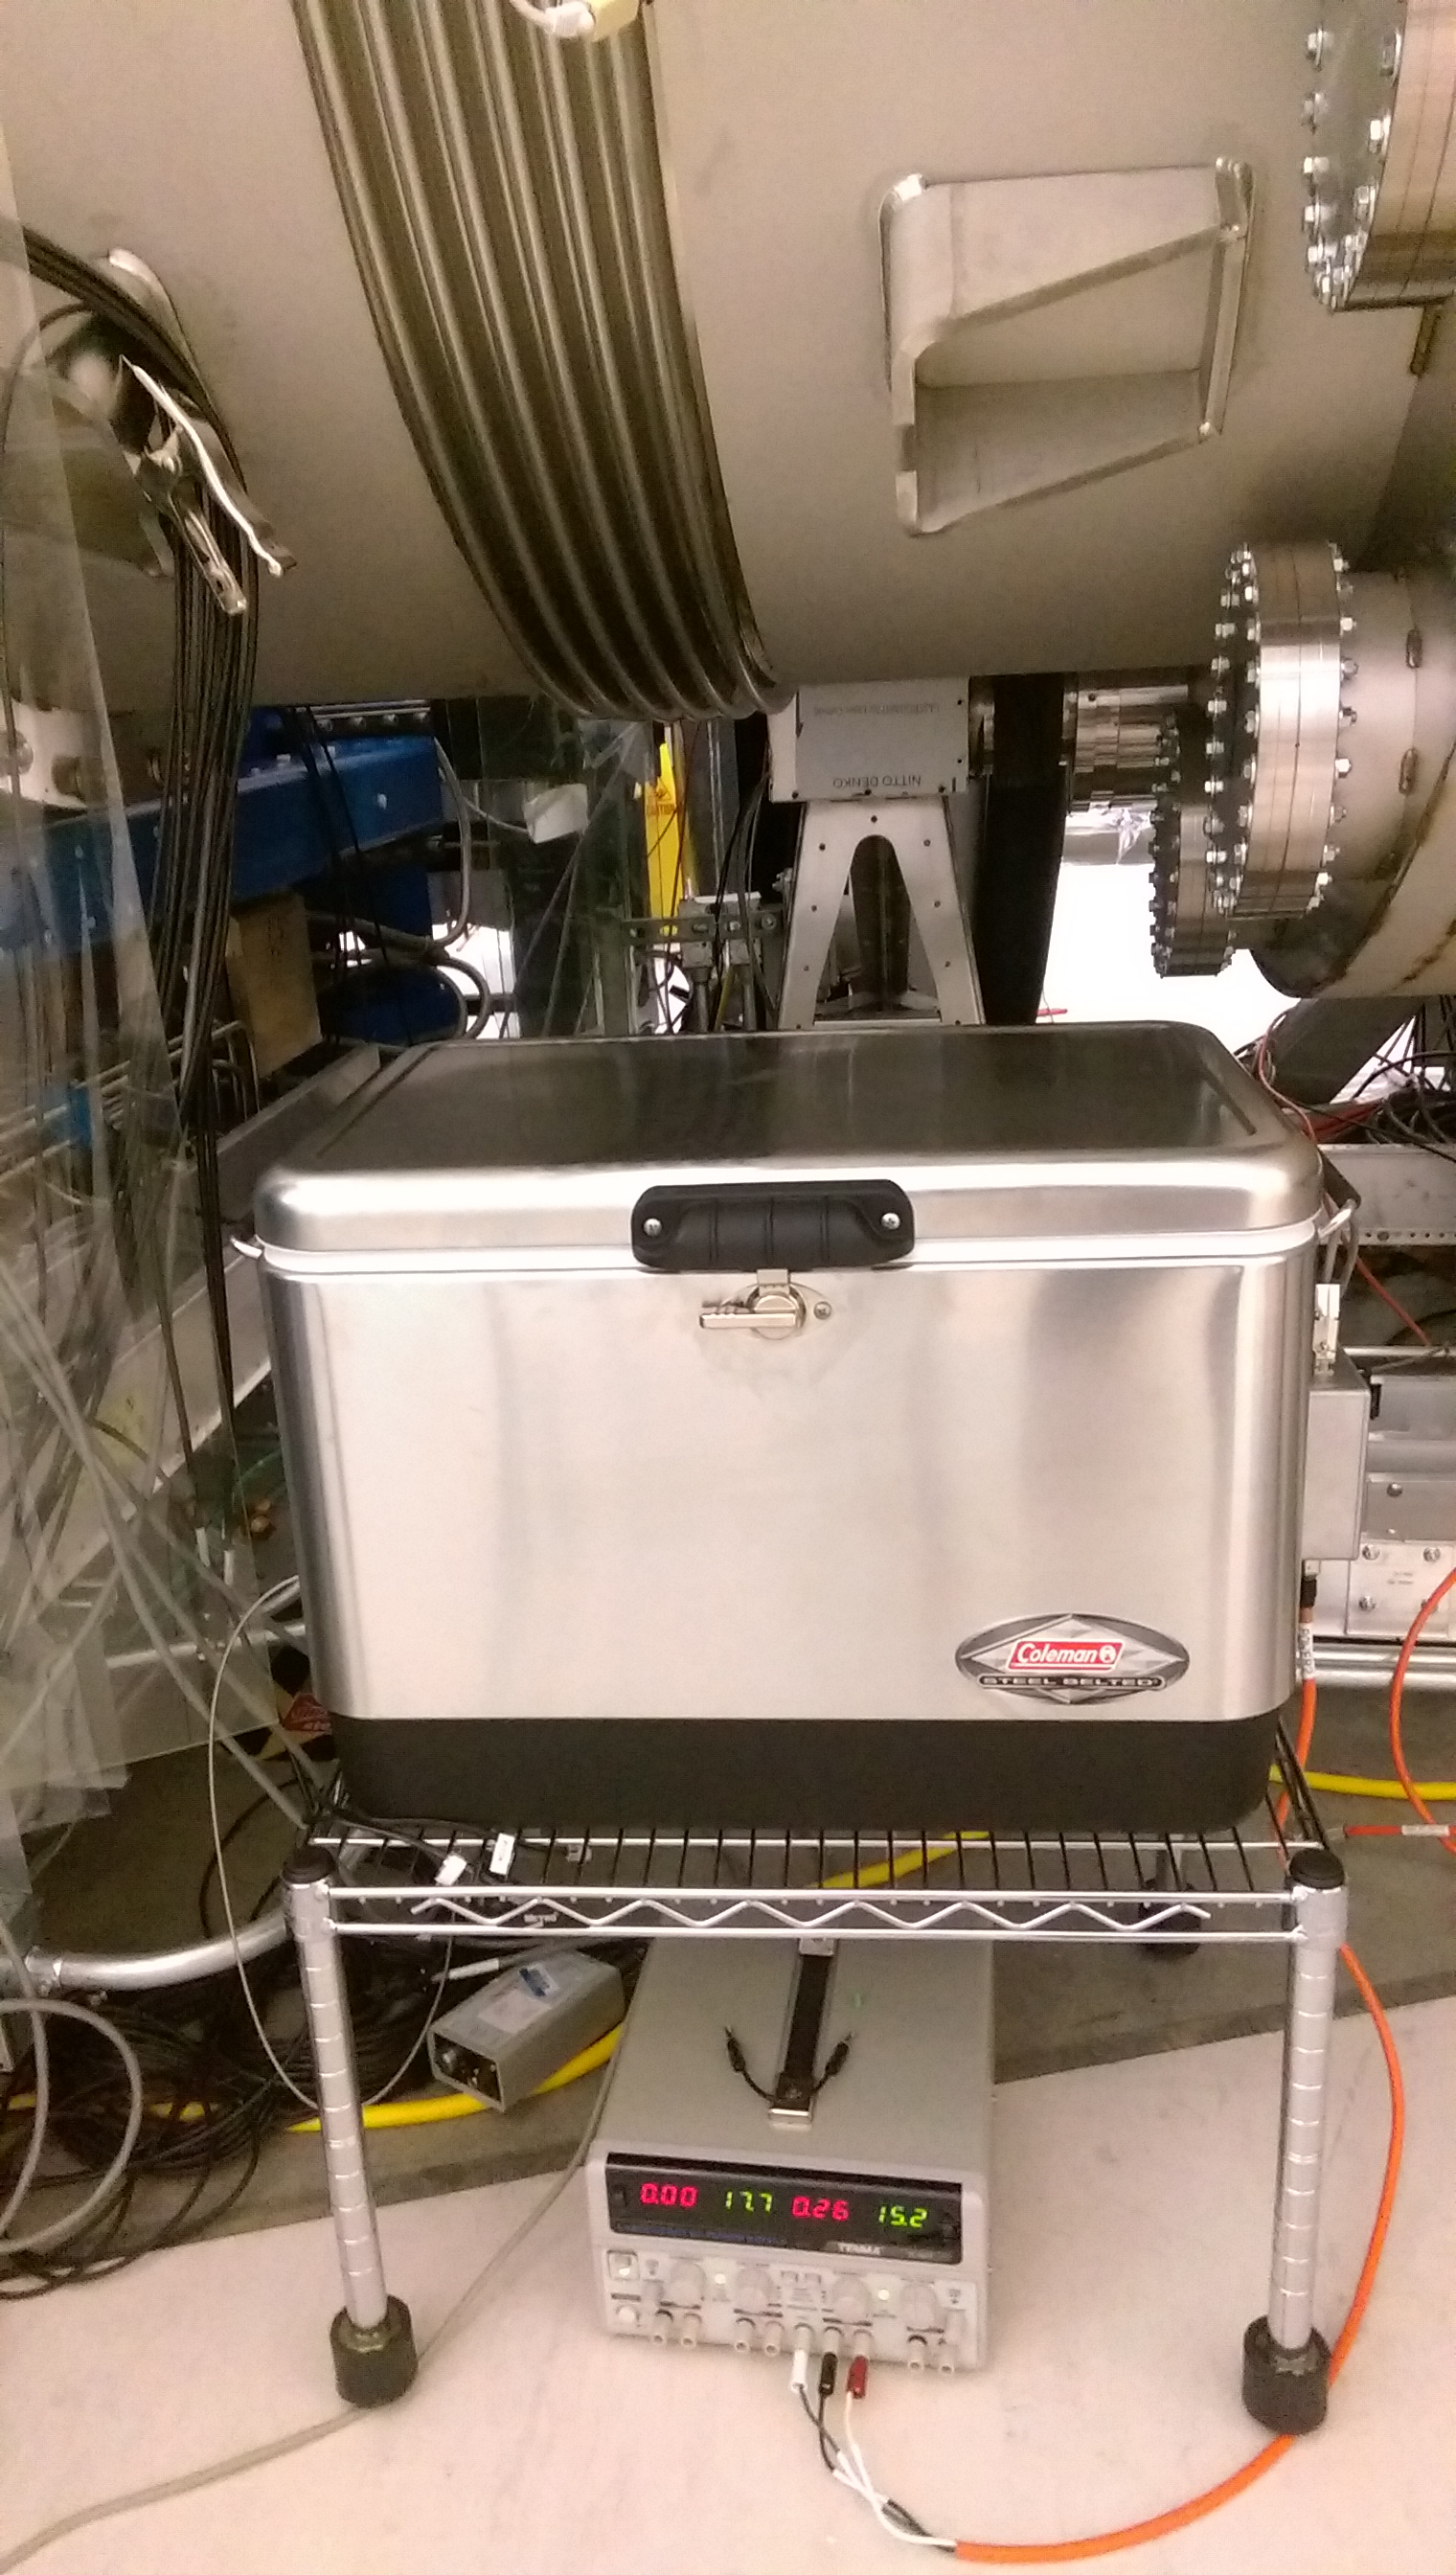
Doug replaced the diode laser at the HAM3 oplev this morning after it was fixed for reducing glitching (SL No. 197) in the optics lab 2. We wanted to let it settle for a while and reach thermal equilitbrium before adjustting the power level. We did that around 12:30PM and I checked the results around 4PM. The laser is still settling down as seen in the attached plots. We plan to monitor it for another day.
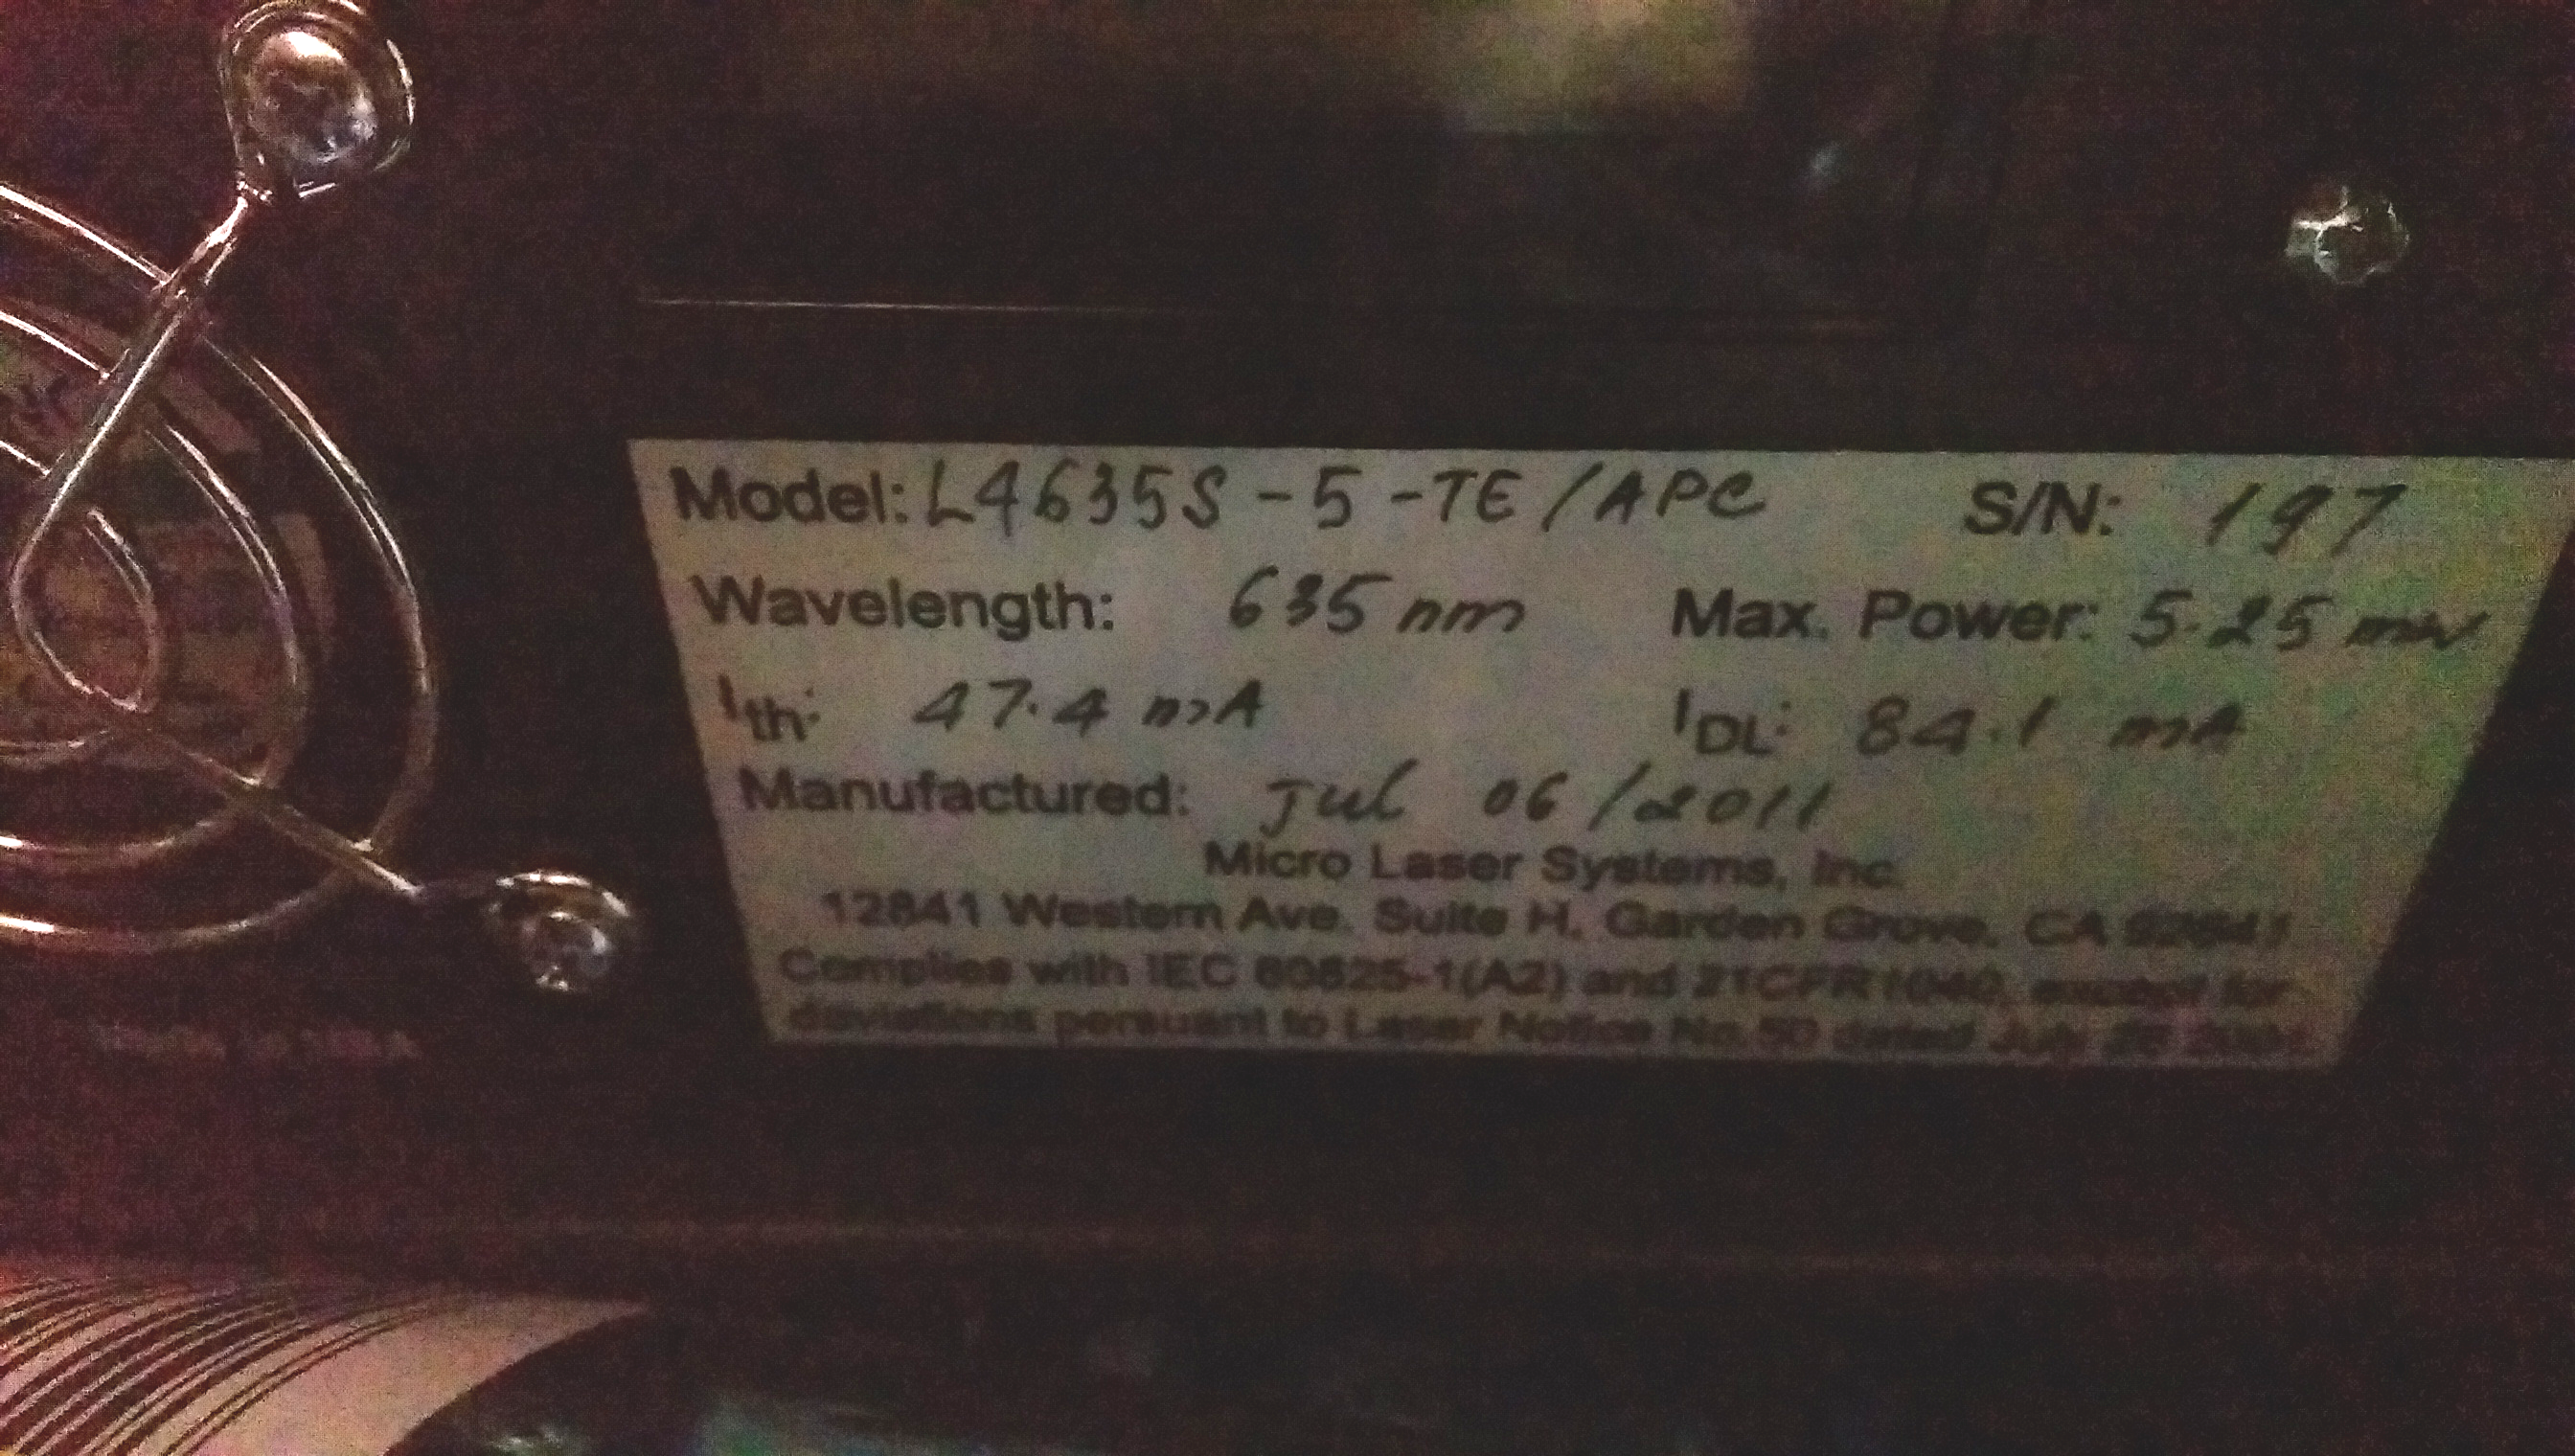
Sl. No. 197 Diode laser requires readjustment of power.
Please see the two attached plots.
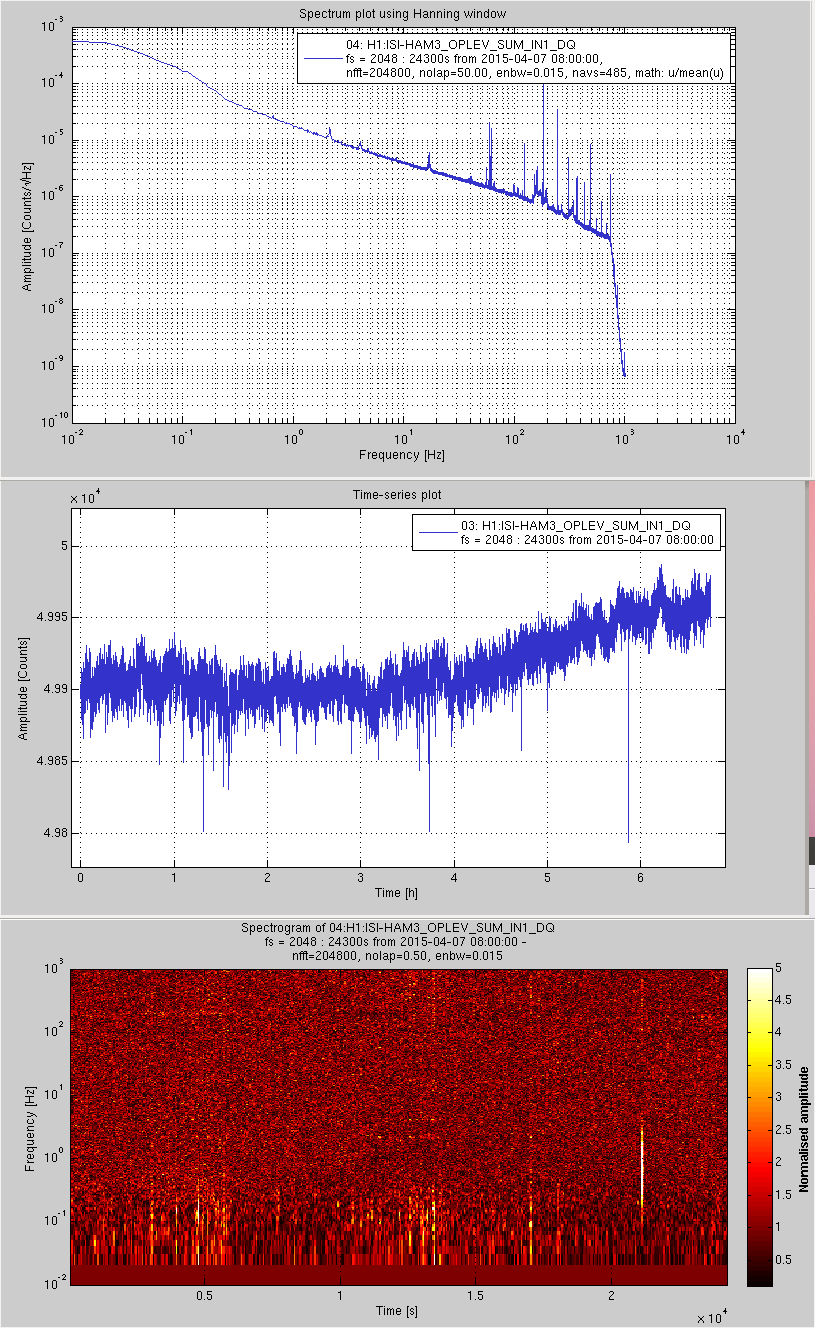
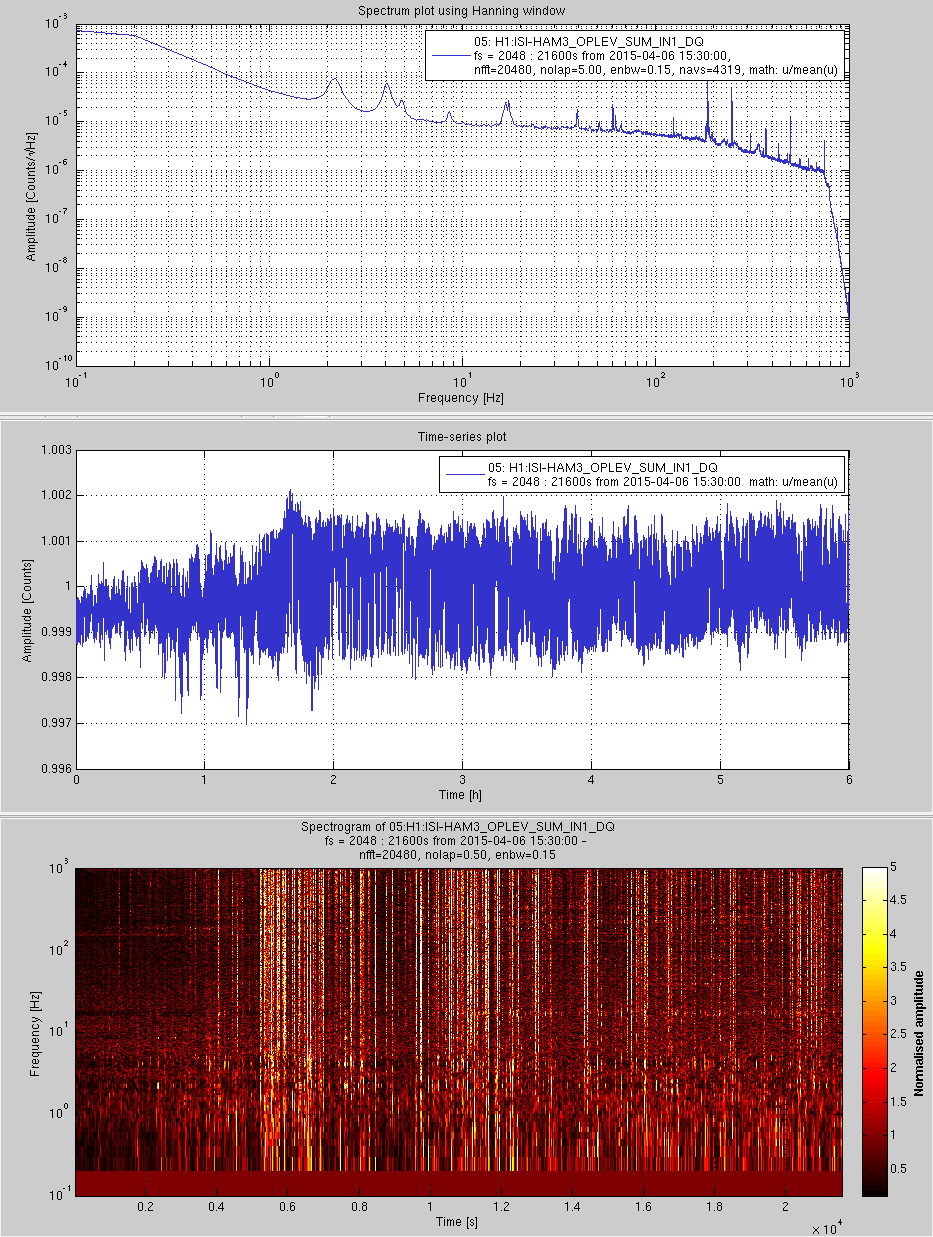
1) The first shows short term trends of the laser power as obtained from the HAM3_OPLEV_SUM_IN1_DQ channel. The first panel shows the RIN spectrum. Note the two orders of increase in when we go below 1Hz towards 0.1Hz. This indicates power instability at low frequencies (A signature of glitching). The second panel of this attachment shows hte time trend of this signal which shows gradual increase in glitch rate after the first hour or so. The laser is moving from a low glitch rate to a high glitch rate power level due to thermal changes. The third panel shows the same info in greater graphic detail with time evolution of the spectrum (spectrogram)
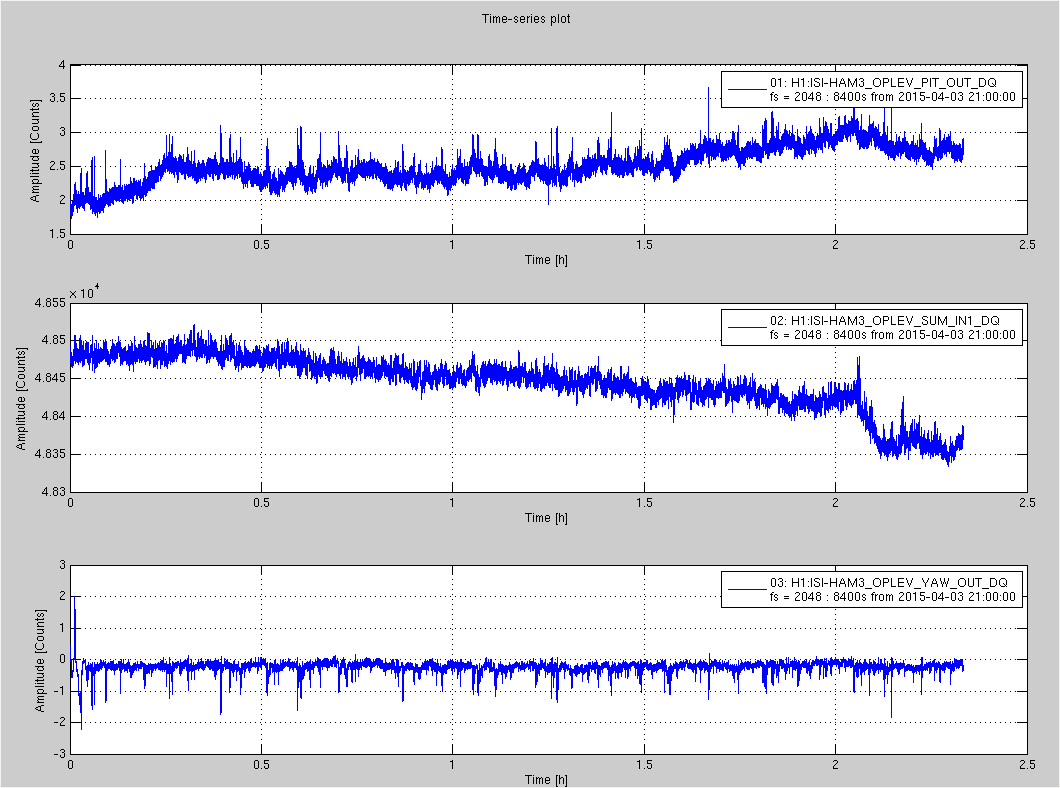
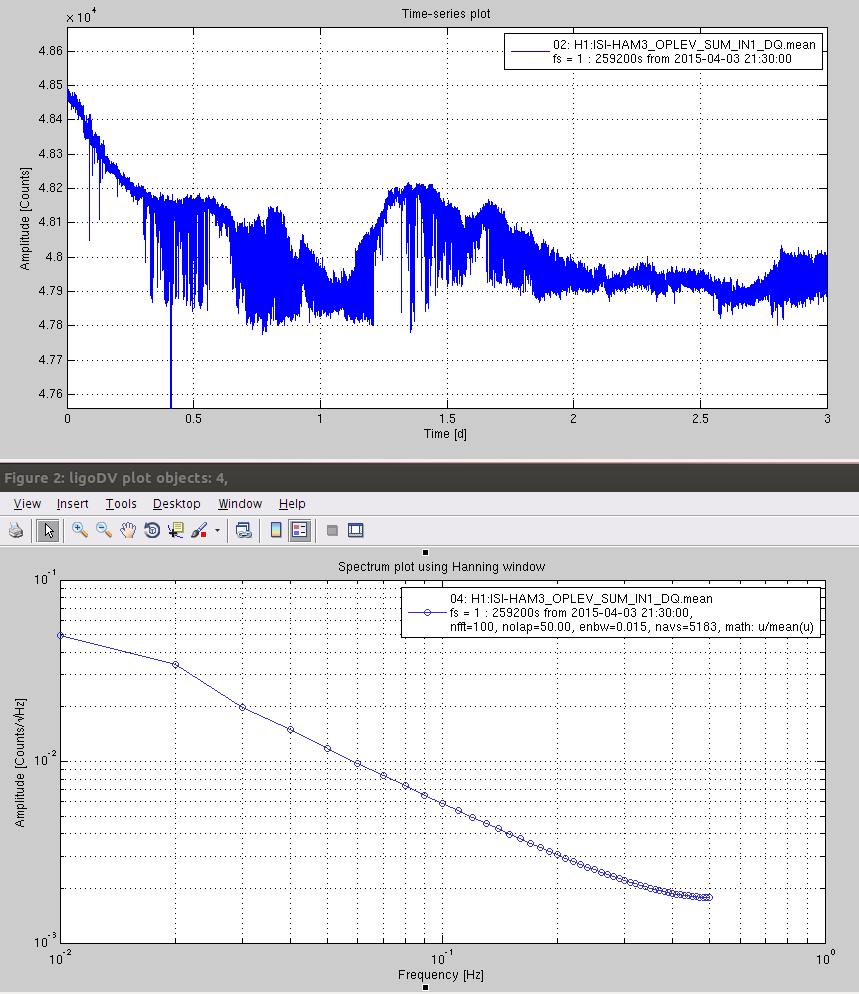
2) The second attachment is a long term 1s trend of the same SUM signal. It shows that the initial power setting was okay and had few glitches if any. However the power dropped over the following half a day and moved to an unstable zone. It stabilised there and continued to glitch because it has landed at the edge of a stable zone and is now mode hopping.
Cure: Increase power from 47900 SUM counts to 48500 counts. Further one day of observation to see if it has worked.
Oplev Laser Sl No. 197 has been shifted to ETMX oplev.
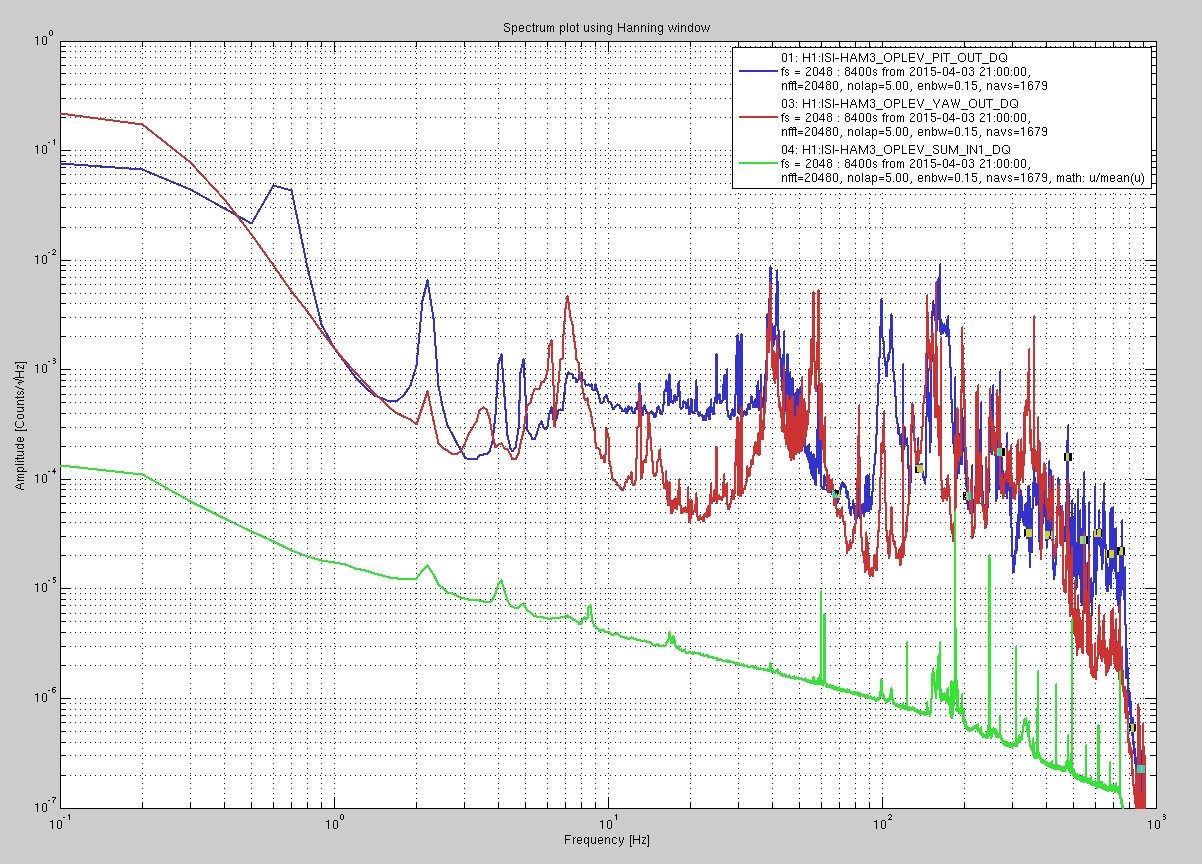
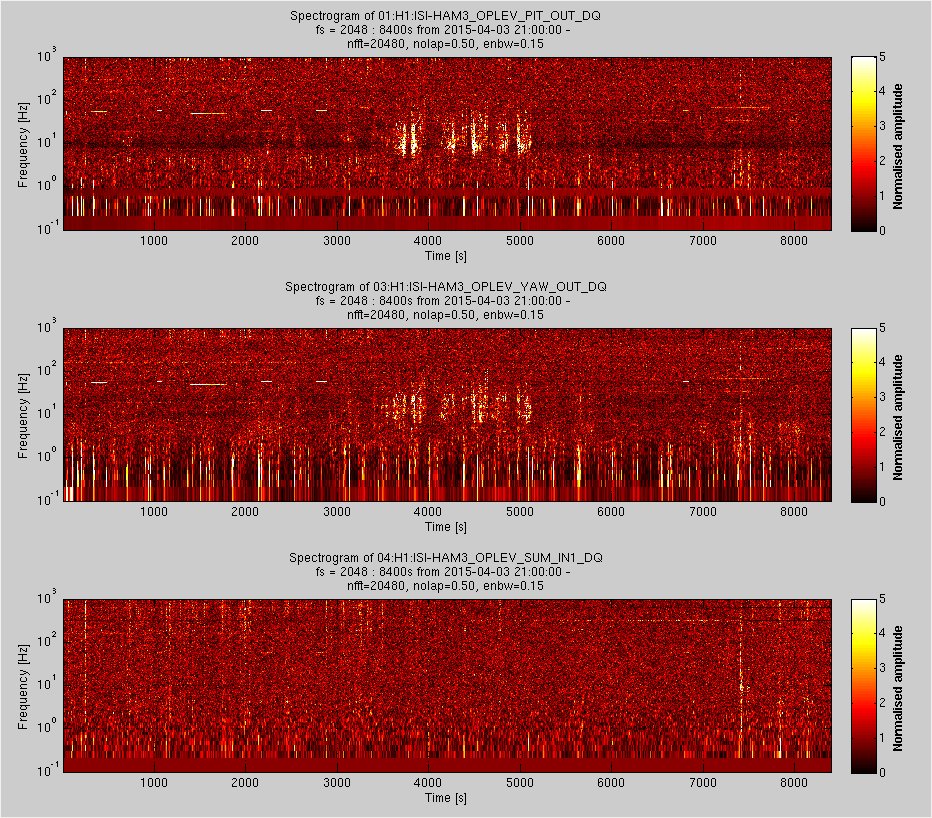
The diode laser Sl No. 197 which was under observation at HAM3 oplev has been performing well for the past six hours. There were a few minor glitches after Tuesday morning maintenance started. This could have been some heavy stuff moving around on the floor and disturbing the HAM3 Oplev Transciever. The behaviour over six hours has been summarised in the attached plots of amplitude spectrum, time series and spectrogram.