As noted by Evan et al, SRCL coupling to DARM is highly non stationary. I looked into three minutes of data with the SRCL noise injection described in the cited elog entry (GPS time 1113211711 + 180 s).
In brief, the coupling is modulated exactly as the residual motion of ASC-AS_A_RF45_I_YAW_OUT. If we compute the coherence between DARM and SRCL with a gain modulated by ASC-AS_A_RF45_I_YAW_OUT, we get values very close to one. Read the rest of this report if you want to know more.
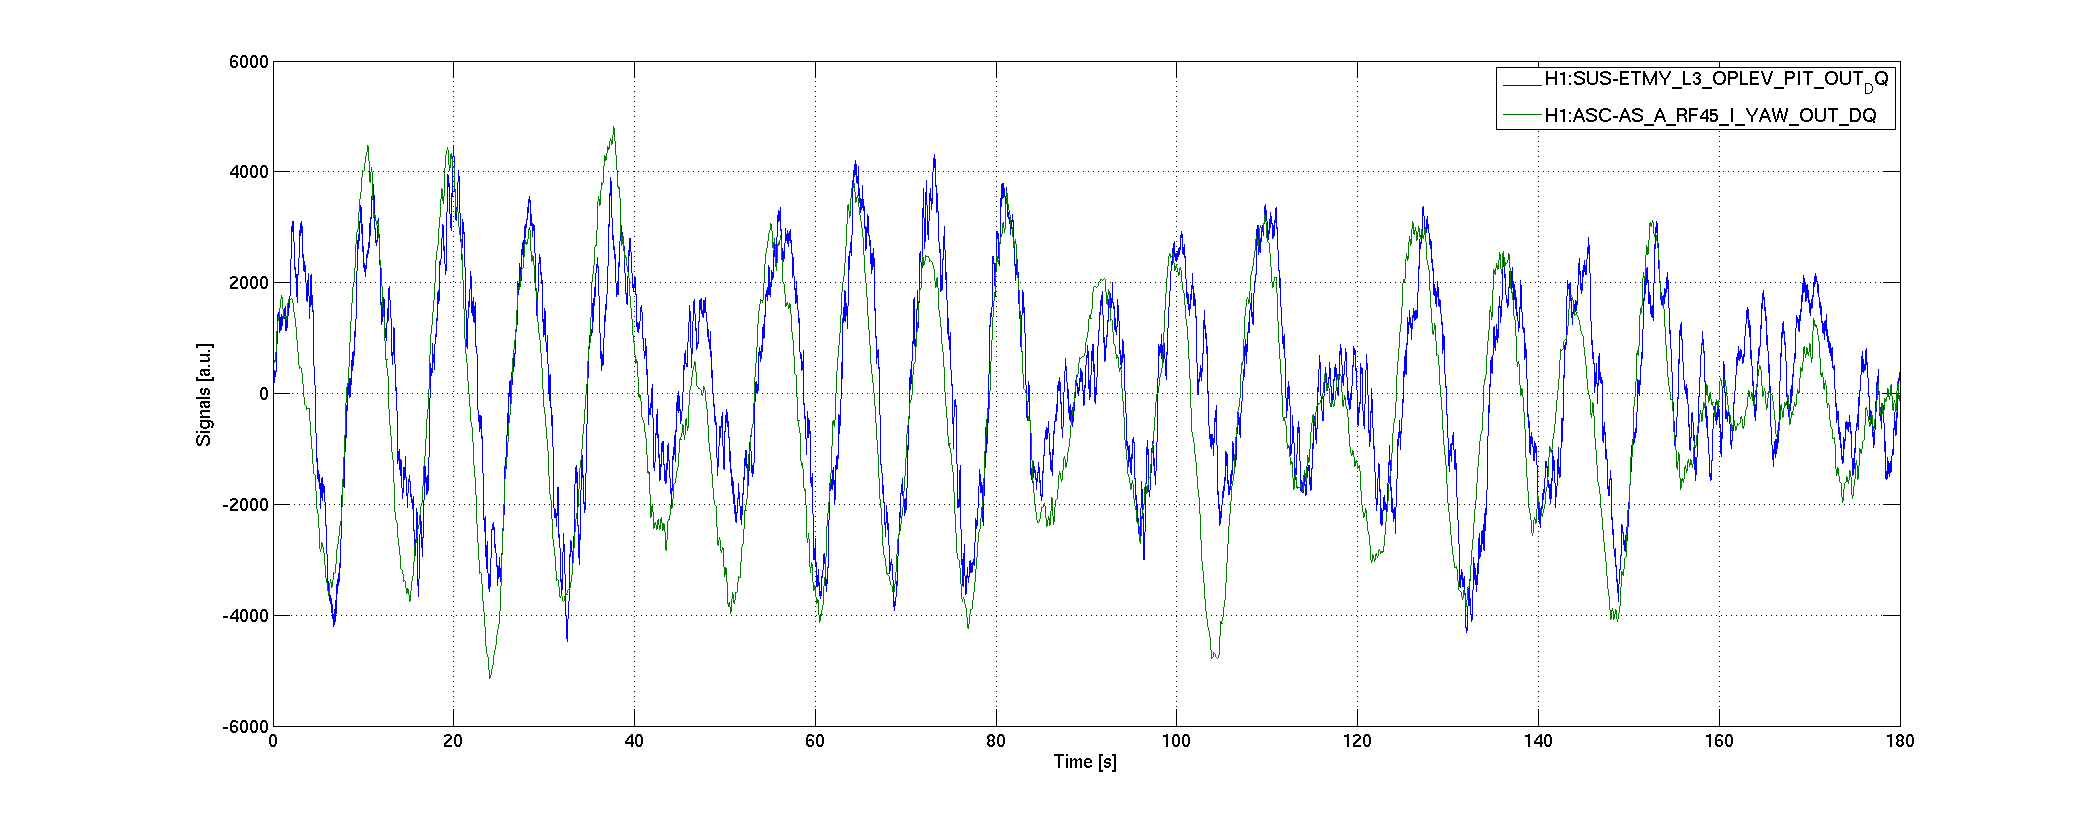
One strange thing is that it seems that the main contribution to this motion comes from ETMY PIT, even though the AS signal is YAW... See the last plot to see how AS_A_RF45_I_YAW moves in a very similar way to ETMY_L3_OPLEV_PIT...
Spectrogram, coherogram and tf-gram
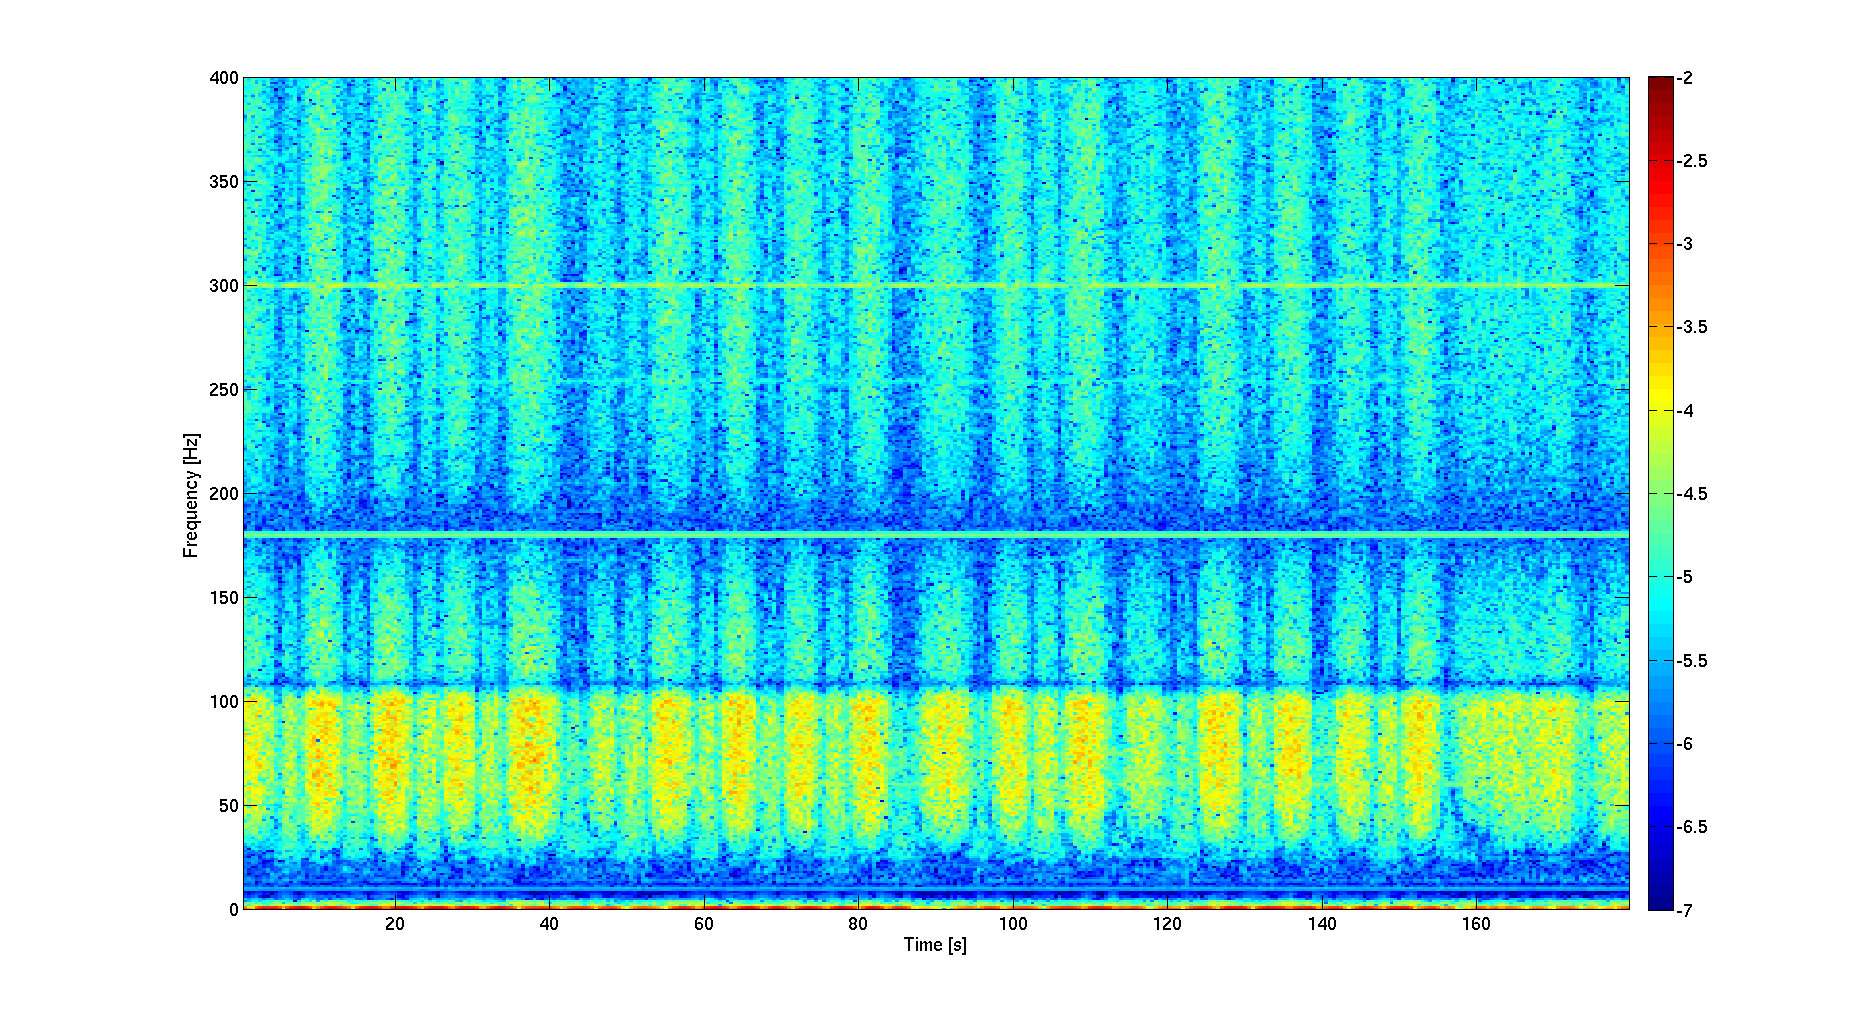
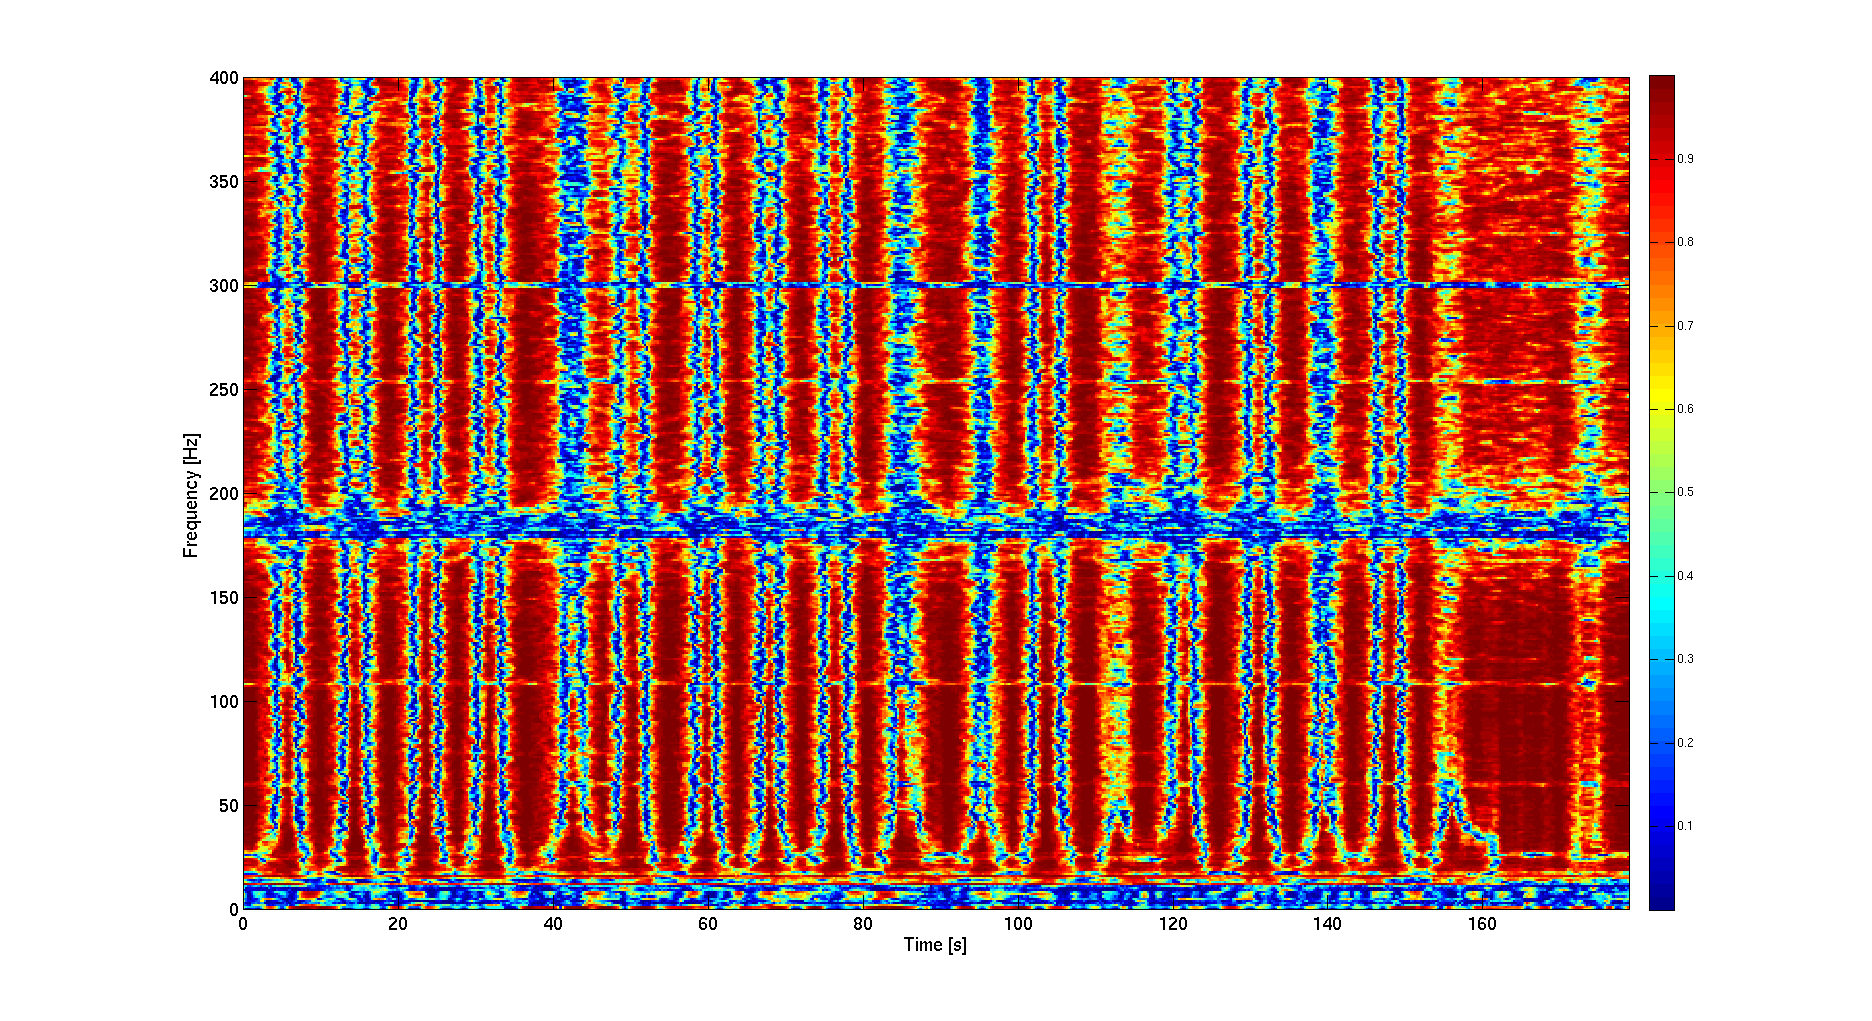
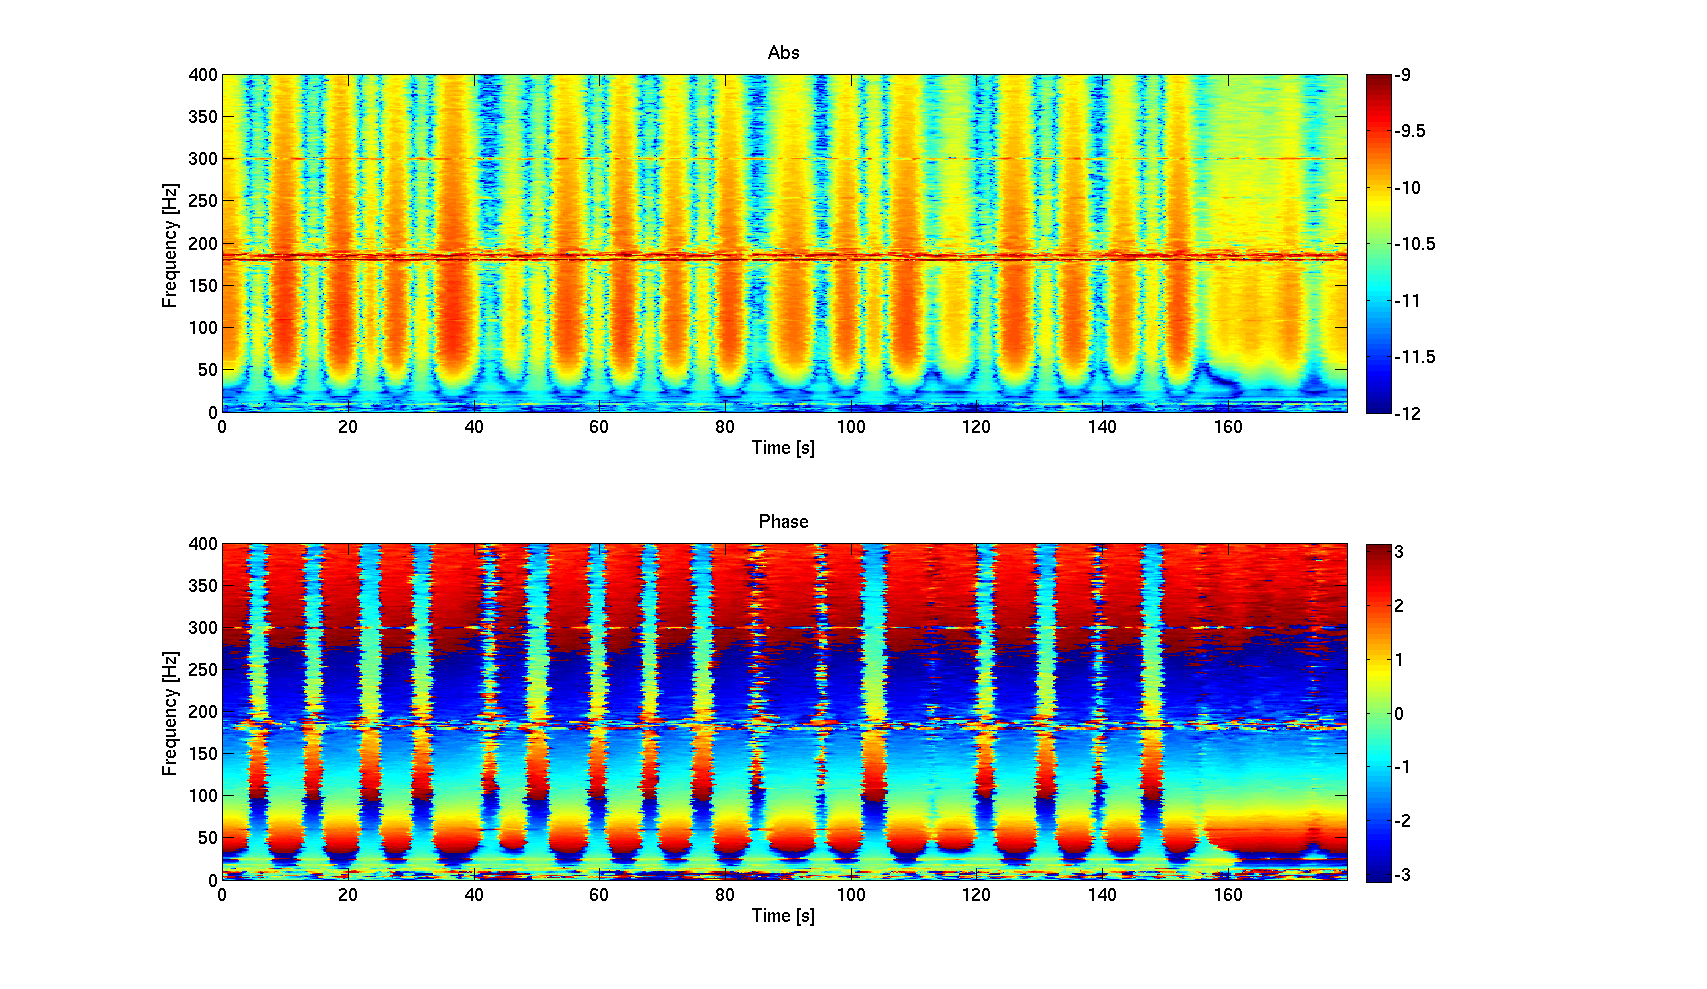
The first attachment shows a spectrogram of DARM during the SRCL noise injection. The non stationarity behavior of the noise is very evident. The second attachment shows a coherogram, which is basically the same thing as the spectrogram, but showing how coherence changes over time. Again, coherence can go up to values of one, but clearly if you average over the entire time, you lose a lot since the coupling is non stationary. The third attachment shows the transfer-function-gram, which again shows how the transfer function from SRCL to DARM changes over time. You can see from the phase plot that the sign of the coupling flips multiple times. The 4th attachment is an animation of the transfer function between SRCL and DARM over time, which makes even more clear how the coupling changes amplitude and sign.
Band limited RMS
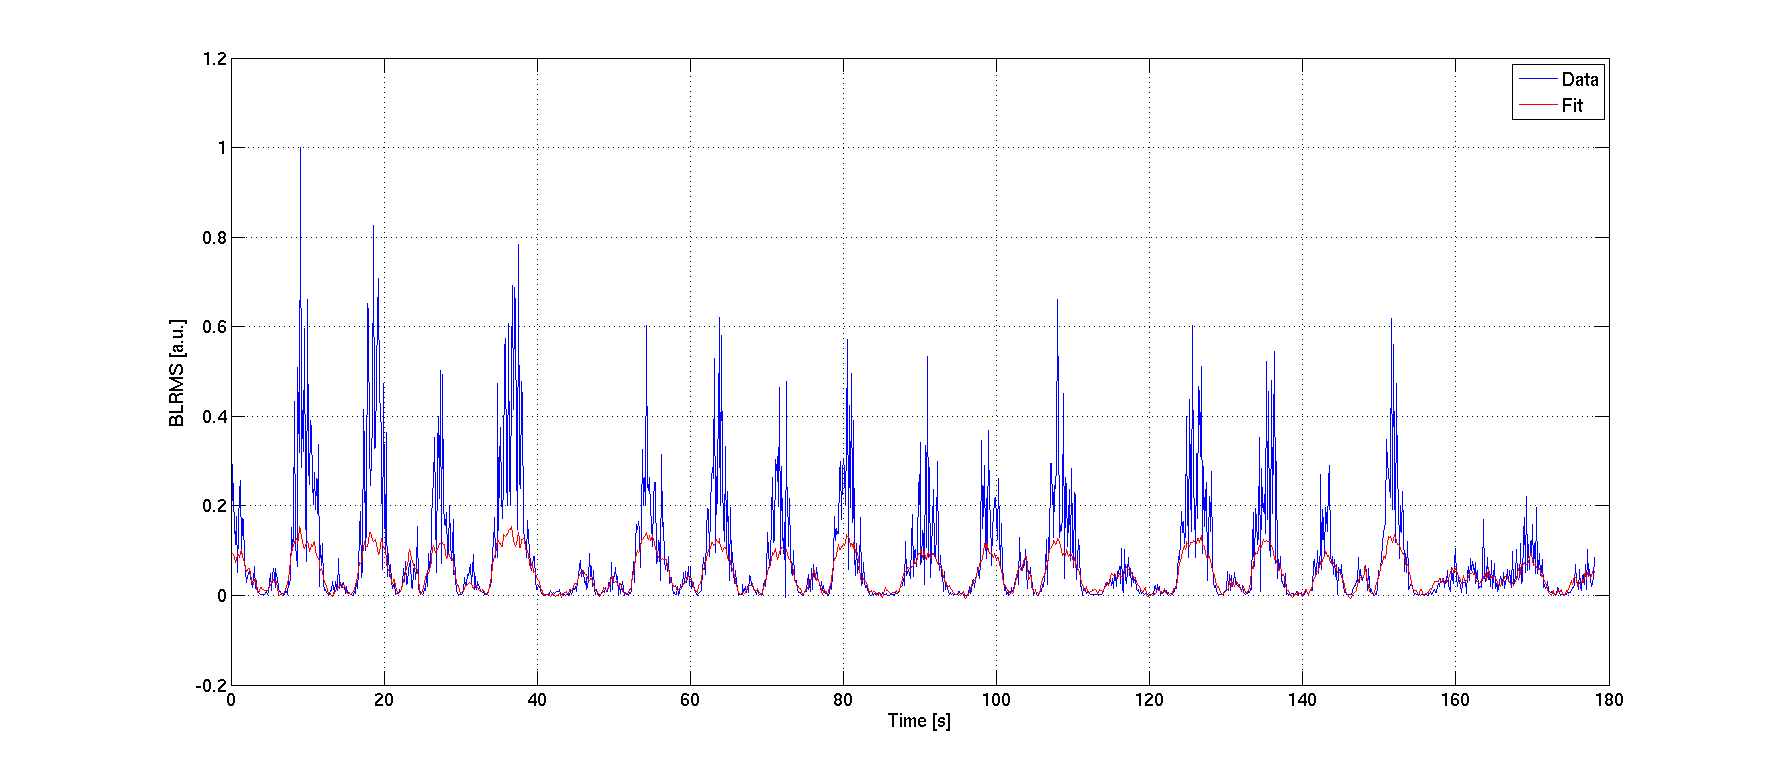
During the noise injection, I repeated the my standard BLRMS correlation with angular signals. I use the frequency band between 50 and 100 Hz. The correlation with angular signals (using all ASC error signals) is quite good, as shownm in the 5th attachment. I didn't continue further the analysis of which channels are more relevant, since the analysis described in the next section gives a better understanding.
Coupling variation over time
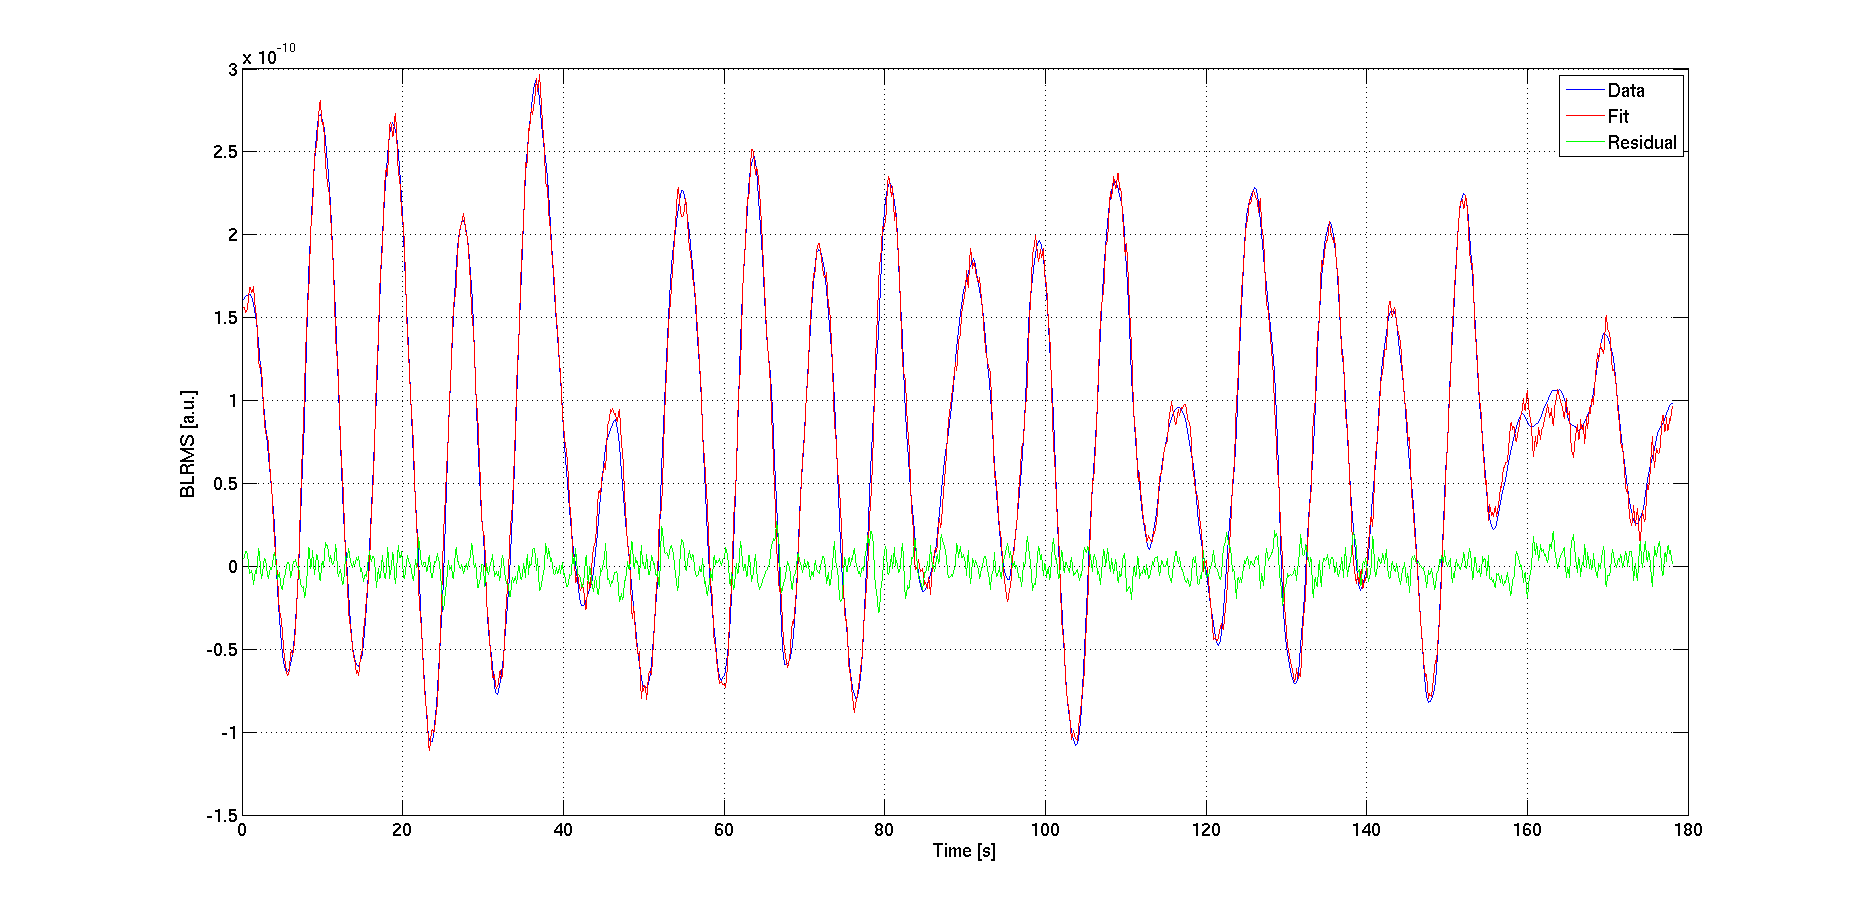
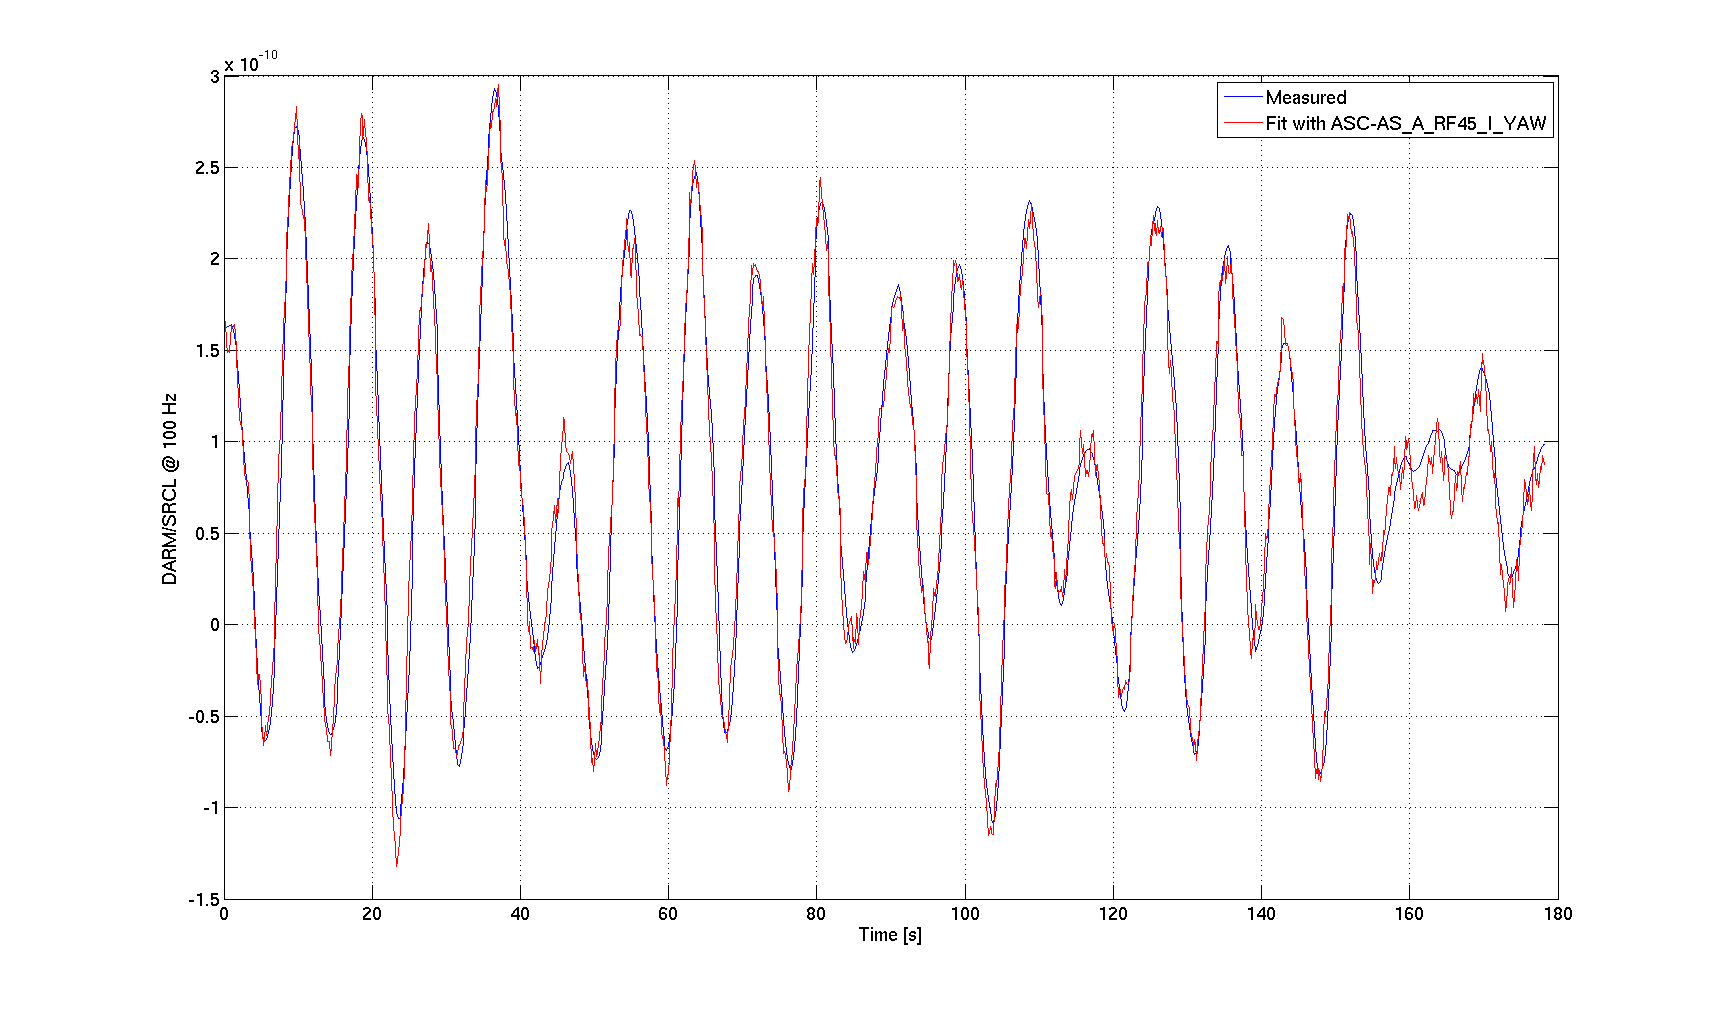
Looking at the transfer function over time (see for example the animation in the 4th attachment) it is clear that the shape remains mostly the same, and only gain and sign changes over time. I therefore computed the average of the TF around 93 Hz, which corresponds to a point where the phase is close to zero (this is just for convenience, in this way the real value of the TF is a good estimate of the gain variation over time). The TF gain varies a lot over time, and as expected changes sign many times. In the 6th attachment I show in the blue trace how this gain varies over time. The red trace is the best fit obtained using my algorithm and all ASC error signals. The green is the residual, which shows hoiw the reconstruction is very good. Using my channel ranking algoritmh I found out that the main contributor is H1:ASC-AS_A_RF45_I_YAW_OUT_DQ is anticipatedm above. The 7th plot shows indeed that the fit is very good even if I use only this signal: so the conclusion is that the SRCL coupling is modulated completely by angular fluctuations visible in the AS port.
Coherence maximization
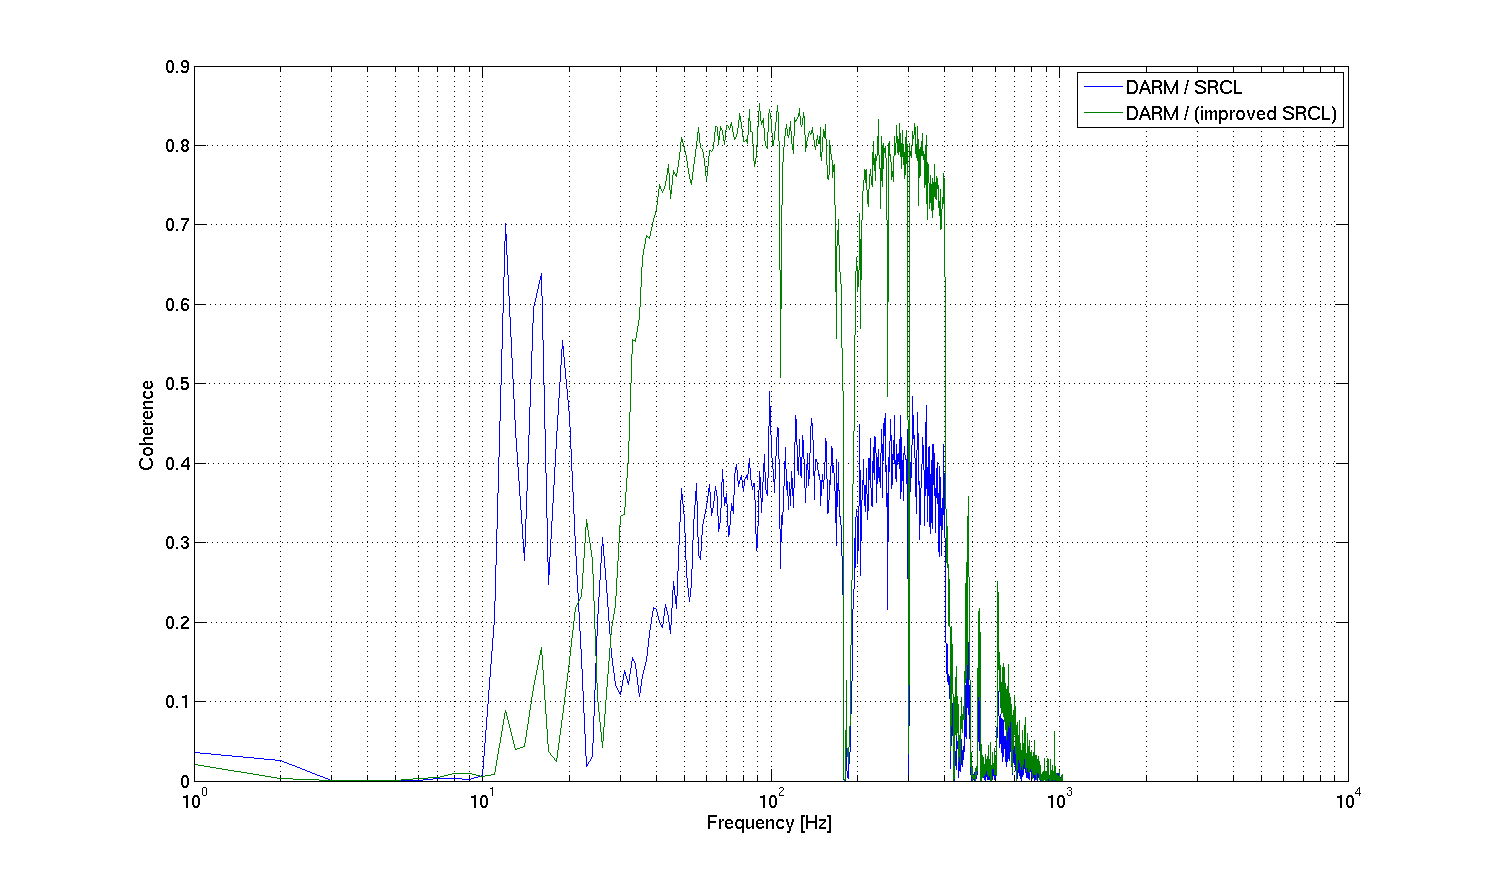
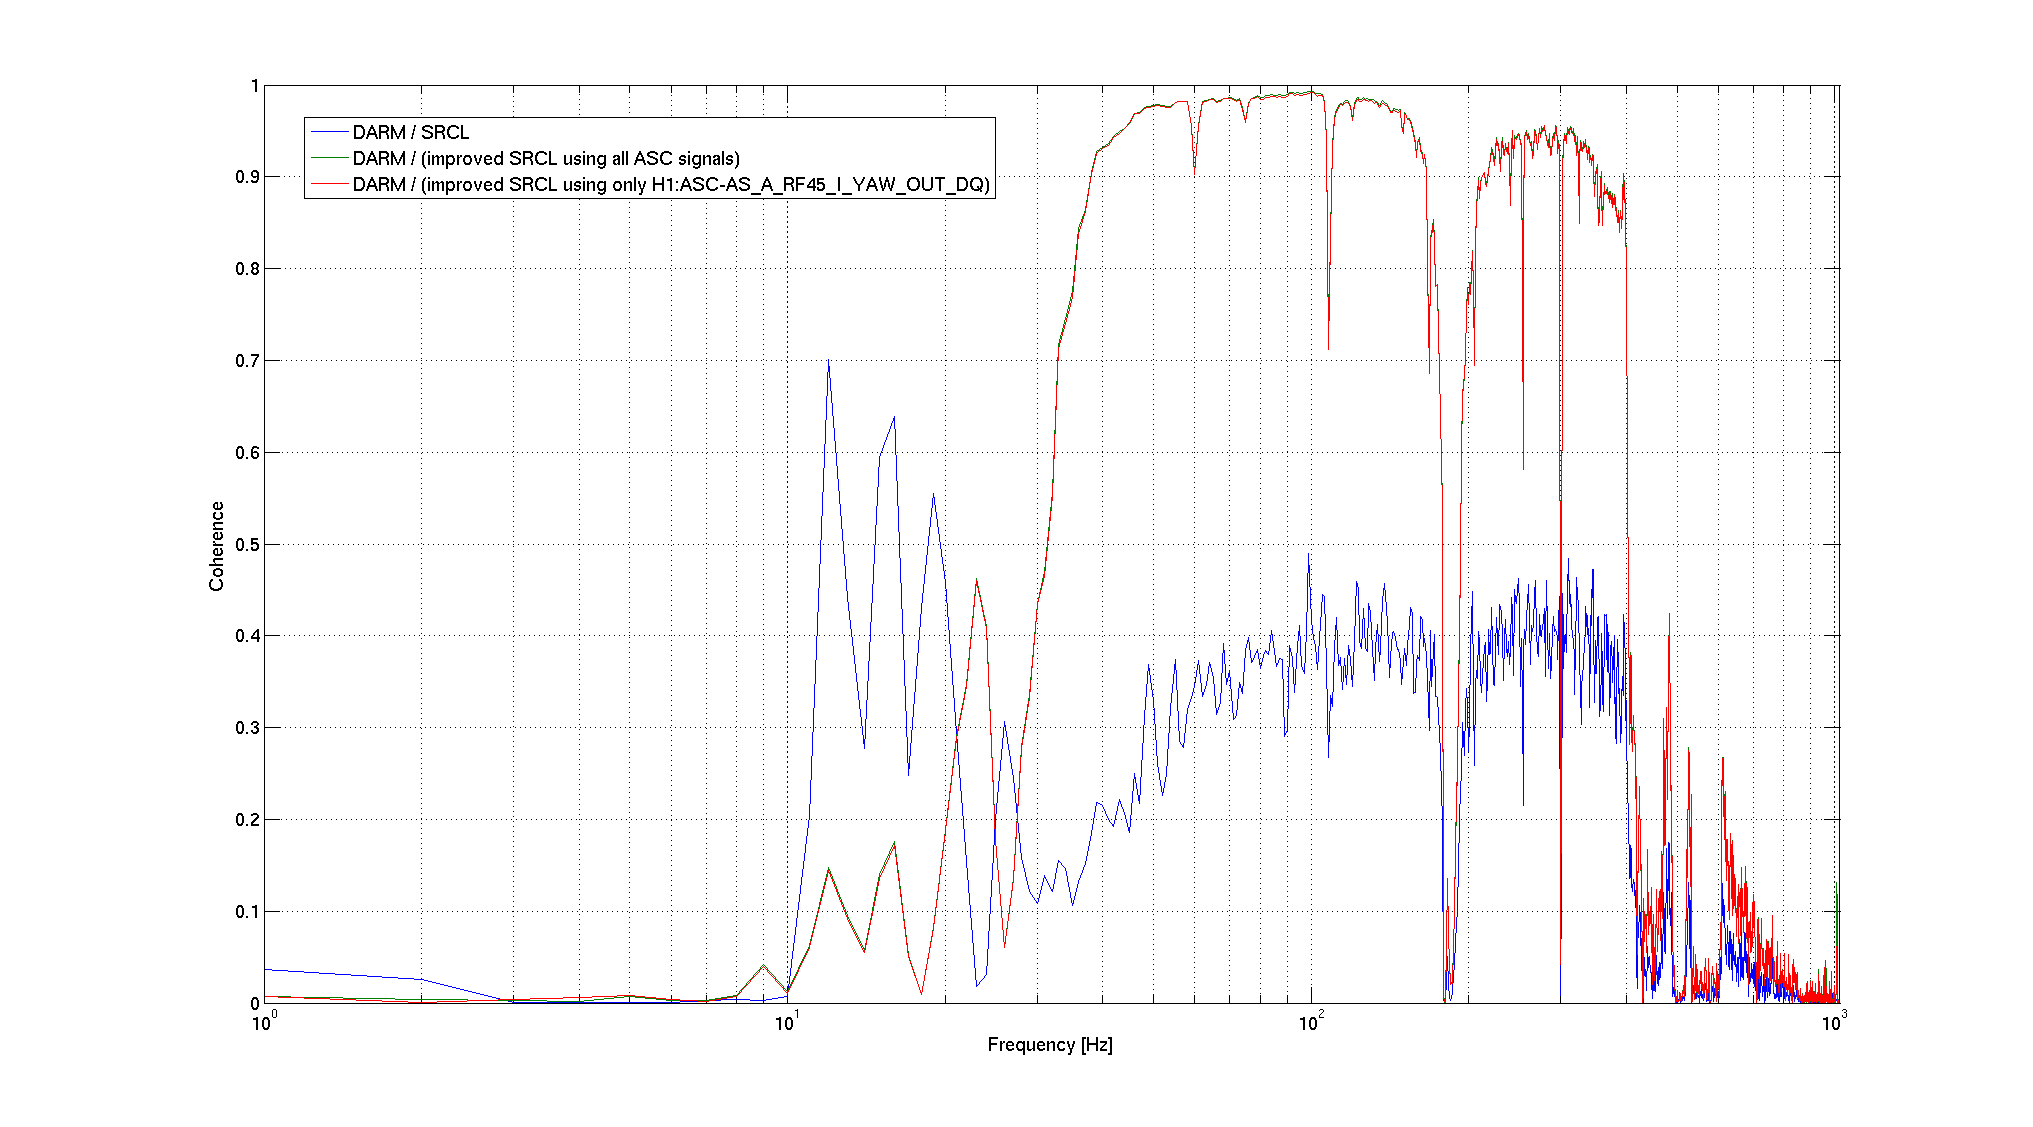
The 8th plot shows in blue the coherence between DARM and SRCL, if averaged over the entire 3 minutes of data. Clearly the coherence is kind of low, as explained above. The green trace is instead the coherence between DARM and an 'improved' SRCL signal, built as SRCL * (1 + gain * AS_A_RF45_I_YAW_OUT_DQ), with the gain obtained from the previous fit. The improvement is clear, showing that indeed I was able to recover most of the coupling gain and sign changes.
To get an even better estimation, I did an optimization based directly on the coherence. Basically, I considered the averaged coherence in the band 50-300 Hz, between DARM and a signal given by SRCL(1 + gain * AS_A_RF45_I_YAW_OUT_DQ). The optimal gain is similar to the one obtained with the previous analysis. However, the improved coherence is very close to one, as shown in the 9th plot. This is very efficient way to prove that indeed most of the SRCL coupling is modulated by the above angular signal.