OMC Length control loop was evaluated to estimate the out-of-loop stabilization displacement level.
The out-of-loop stability of the OMC is around 10-14~10-13m/rtHz level (Attachment 3 blue curve below 10Hz).
Between 10Hz to 300Hz, the contamination of the cavity length displacement is expected (Attachment 3 black curve).
This is due to the sensor noise injected to the cavity by the dither control loop itself.
The data was taken from the lock in the evening of Apr 15 at 15W lock.
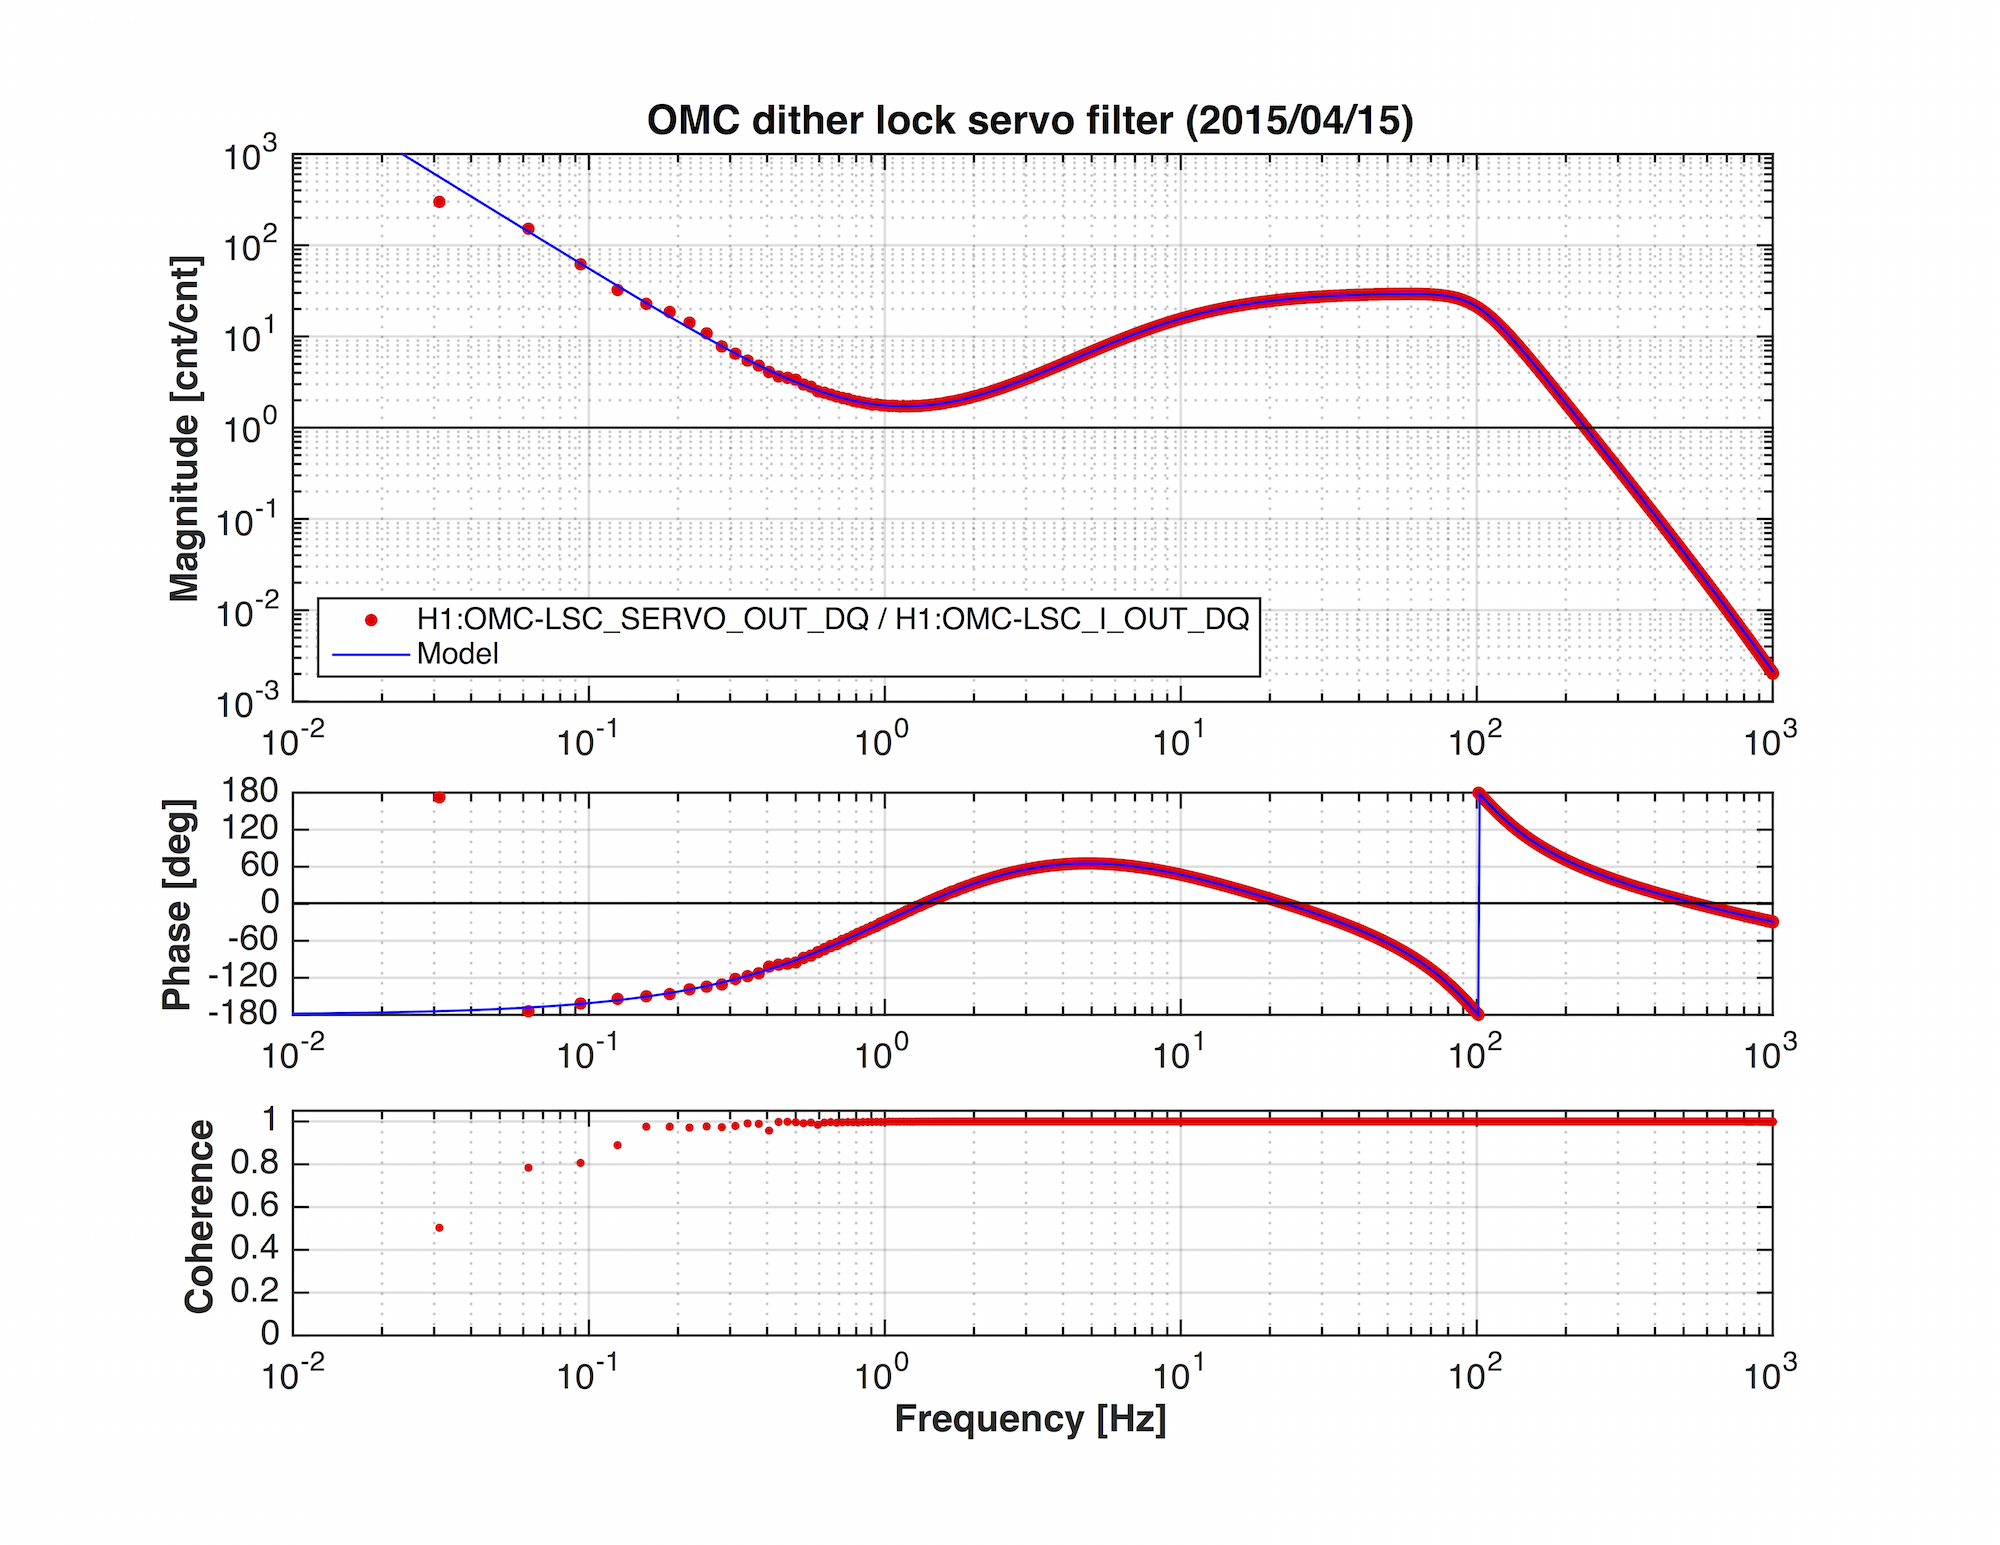
Servo filter modeling
The transfer function from H1:OMC-LSC_I_OUT_DQ to H1:OMC-LSC_SERVO_OUT_DQ was measured and modelled
based on the ZPK model of the filter. (Attachment 1)
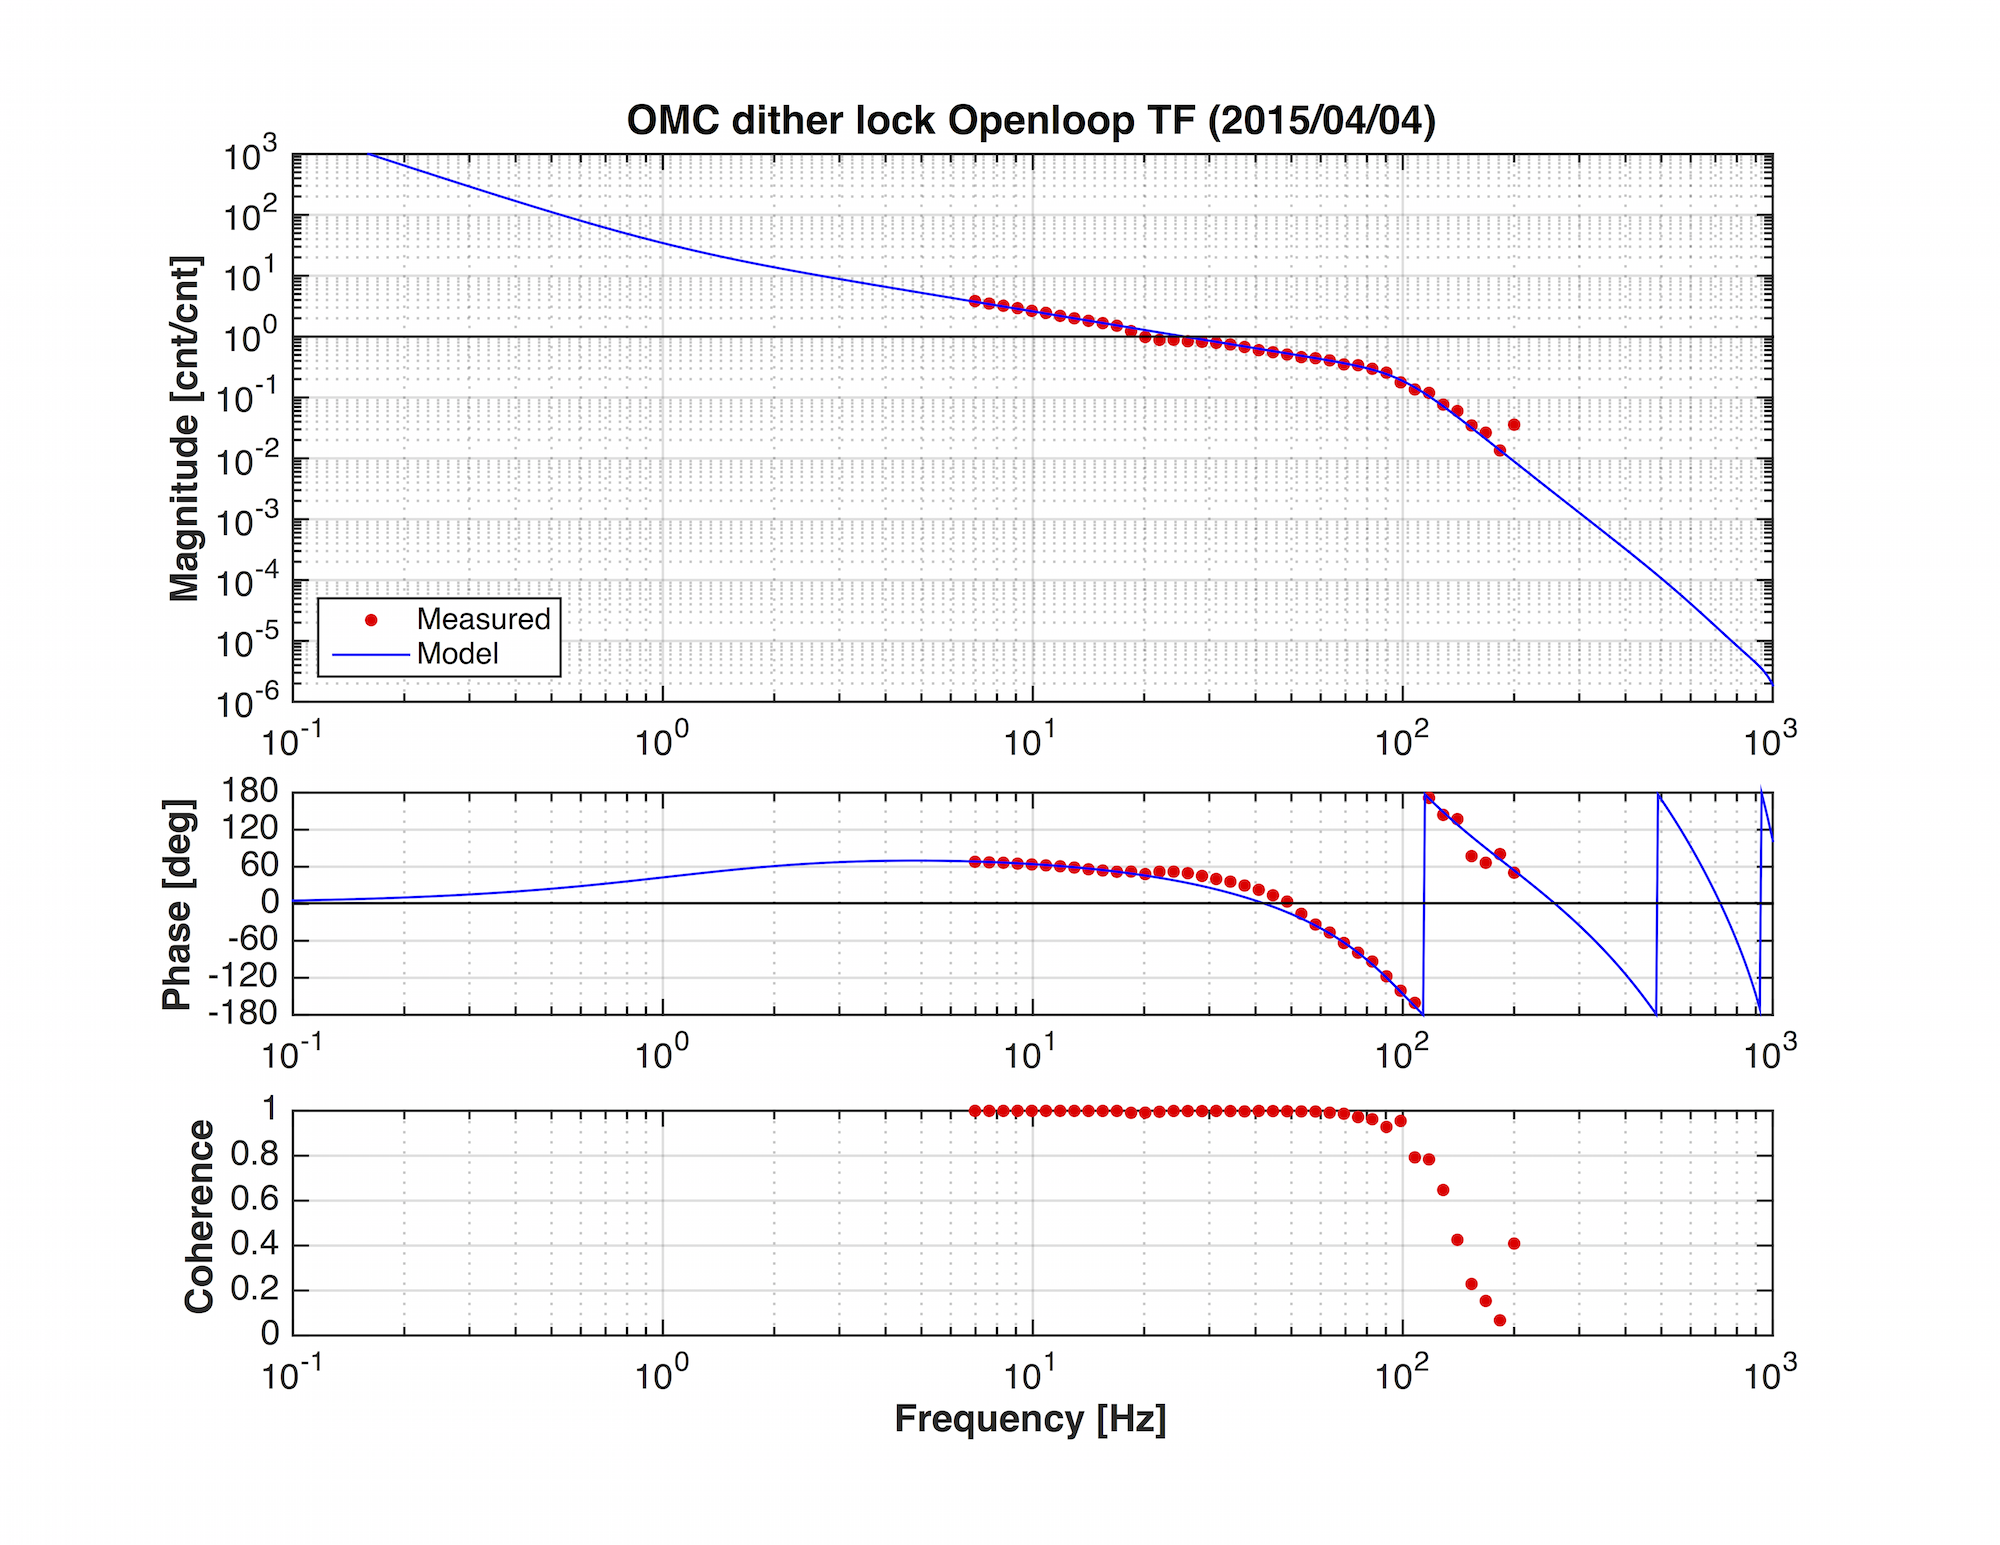
Openloop TF modeling
The OLTF model is based on a swept-sine loop TF measurement done on Apr 4 at DRMI with sideband locked OMC.
As the DCPD output is normalized with the DC value, the optical gain after the normalization is believed to be constant.
The actuator frequency response is indeed not simple, but we already evaluted it before (LHO ALOG 16089).
In the end, the openloop transfer function was successfully modelled. (Attachment 2)
Note that the actual open loop transfer function on Apr 15 was a factor of 3 lower than the one in this plot.
(The servo gain was 30 on Apr 4, and was 10 on Apr 15.)
This gives us the optical gain estimate of 6.0x10⁸ 1/m at H1:OMC-LSC_I_OUT_DQ.
...In fact this number is about 5 times smaller than the theoretical prediction from the dither amplitdue (0.87pm_pk@3300Hz)
and the cavity finesse of ~400. I still don't have good excuse for this discrepancy.
Free-running and stablized cavity length displacement
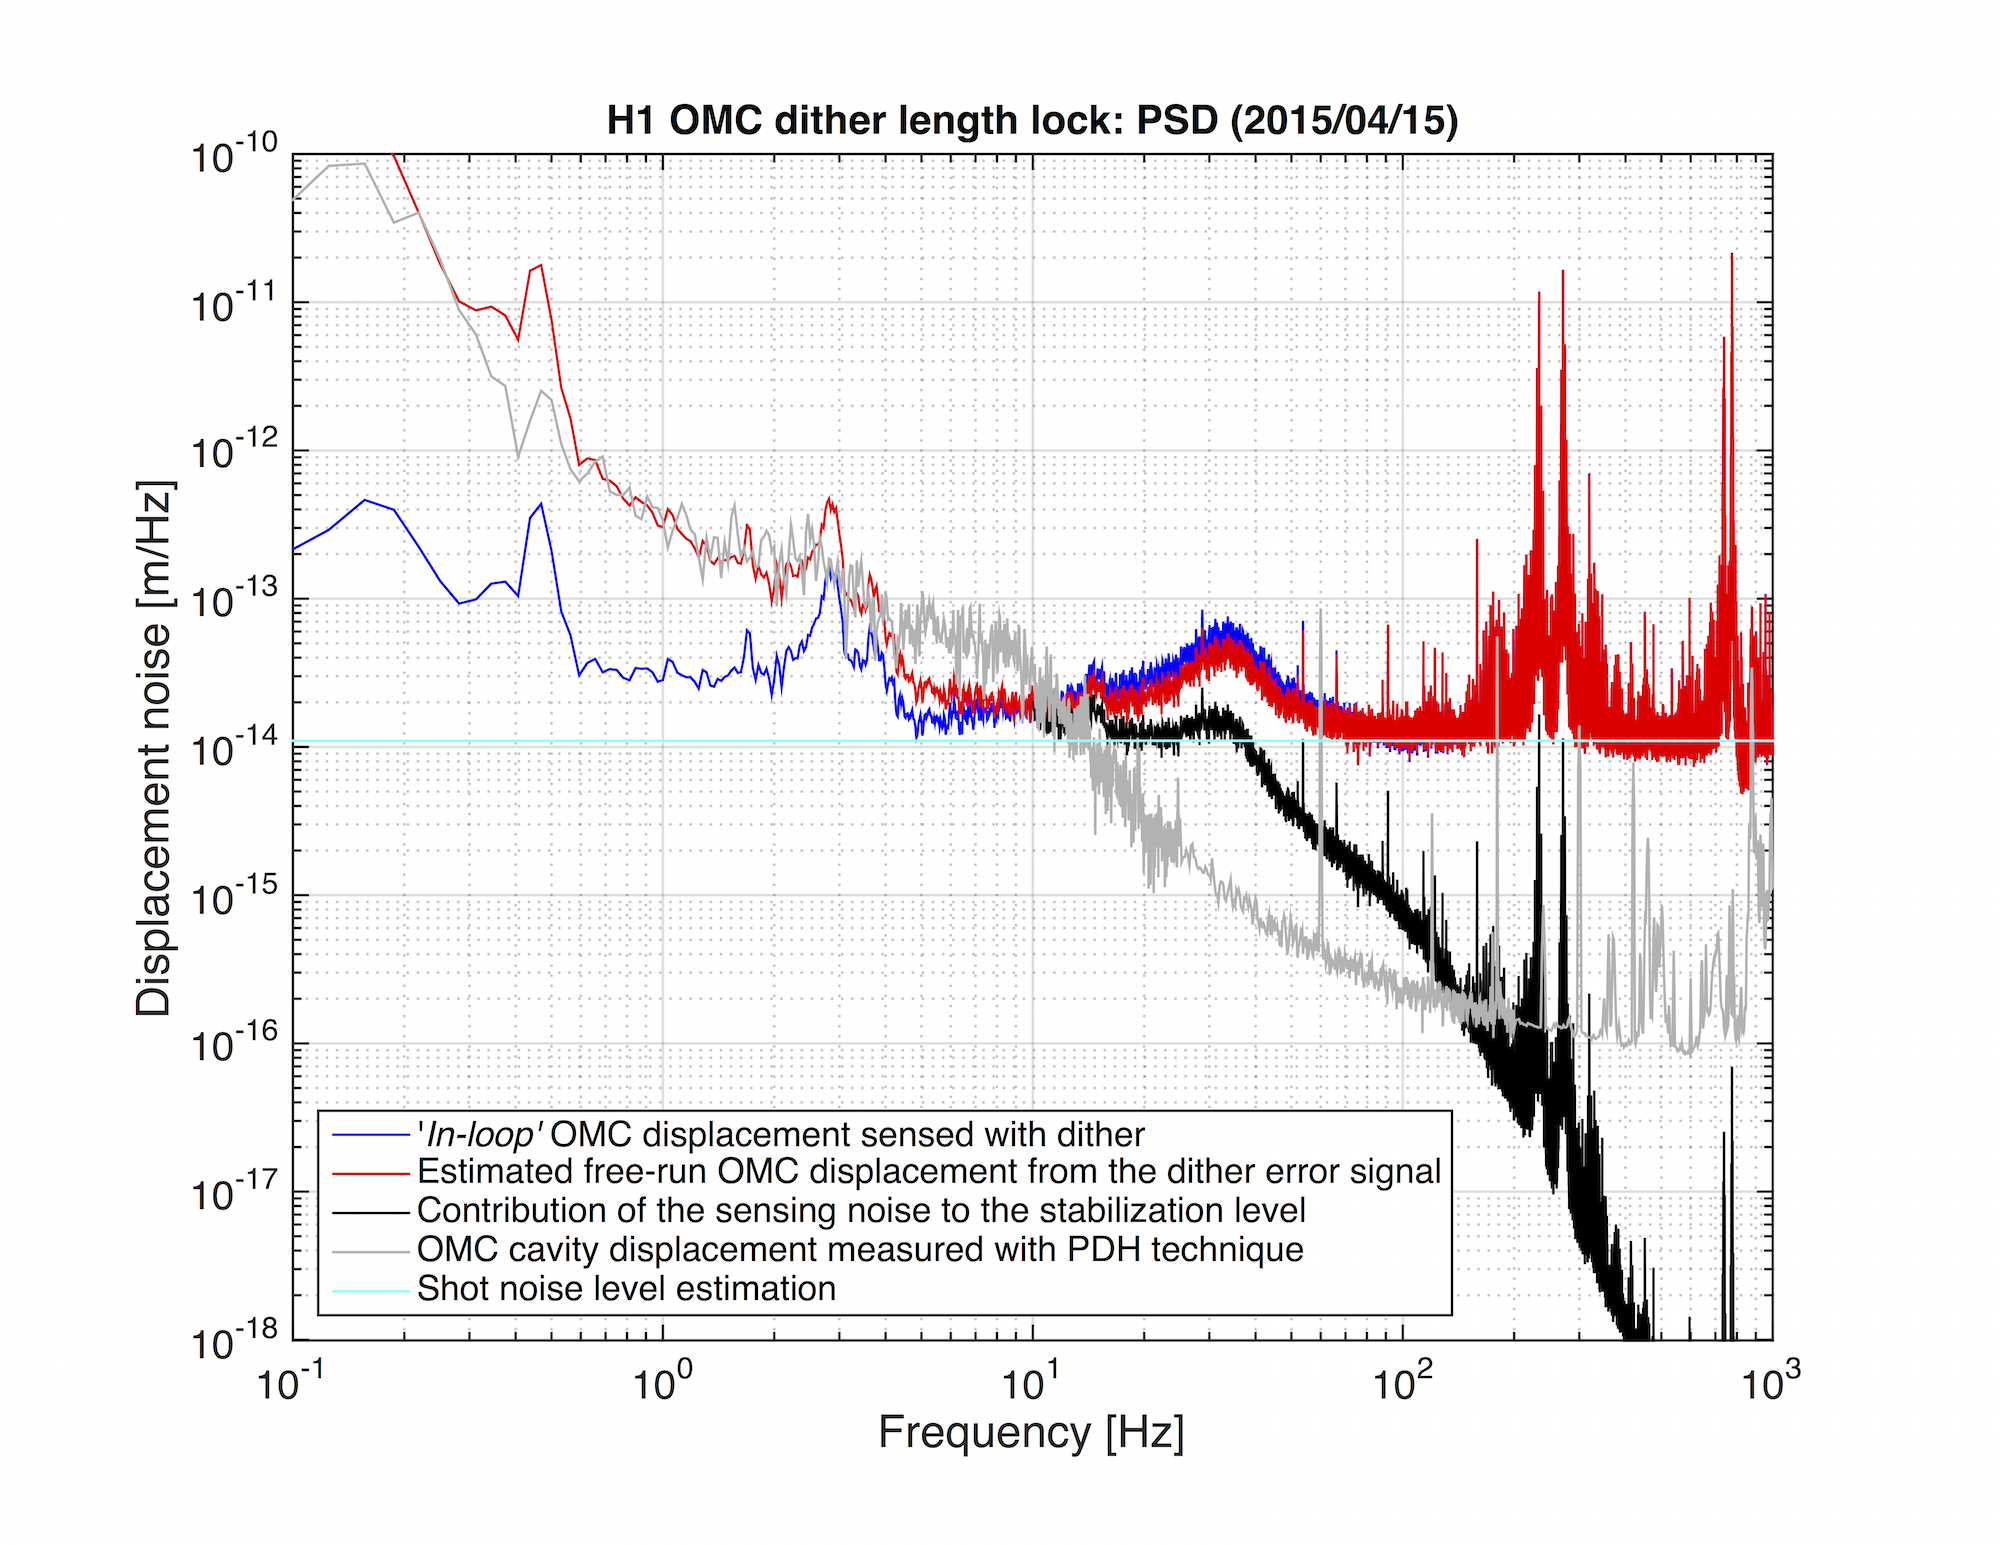
The free-running motion of the OMC cavity was estimated from the optical gain, actuator response, and openloop transfer functions.
It is shown as the red curve in Attachment 3. The blue curve is the calibrated in-loop displacement sensed by the dither length sensing.
The gray curve indicates the cavity length noise measured with PDH in January (LHO ALOG 16089).
Assuming the red curve is dominated by the sensor noise (and that is the guess), the black curve is the noise injection to the OMC cavity
due to the servo control. This means that the out-of-loop stability of the OMC is represented by the blue curve up to 10Hz,
the black curve up to 300Hz, and the gray curve above 300Hz.
The sky blue curve represents the shot noise level estimated from the shot noise level of the 33mA and optical gain 6.0x10⁸ 1/m.
(i.e. Sqrt(2 e / Idc) * 3000 / Sqrt(2) / 6.0x108 = 1.1 x 10⁻¹⁴ m/rtHz, 3000 is the LO amplitude for demodulation,
1/Sqrt(2) is the product of the demodulation (1/2) and double-sided to one-sided conversion (xSqrt(2)) )
The information we can obtain from this measurement is:
1) Below 4Hz, the dither error signal sees the cavity motion. (Compraison between red and gray)
2) At least above 10Hz, the sensing noise is dominating the error signal. (Comparison between red and gray)
3) The cavity noise have some mechanical peaks at 0.45Hz and 2.8Hz. (Comparison between red and gray)
Where are they coming from? Is this due to OMC SUS actuation for OMC ASC?
4) The cavity motion is contaminated by the control above 10Hz upto 300Hz. (Comparison between black and gray).
You may wonder:
a) if the bump at 30~40Hz comes from the sensor noise, or coming from the servo bump or something else.
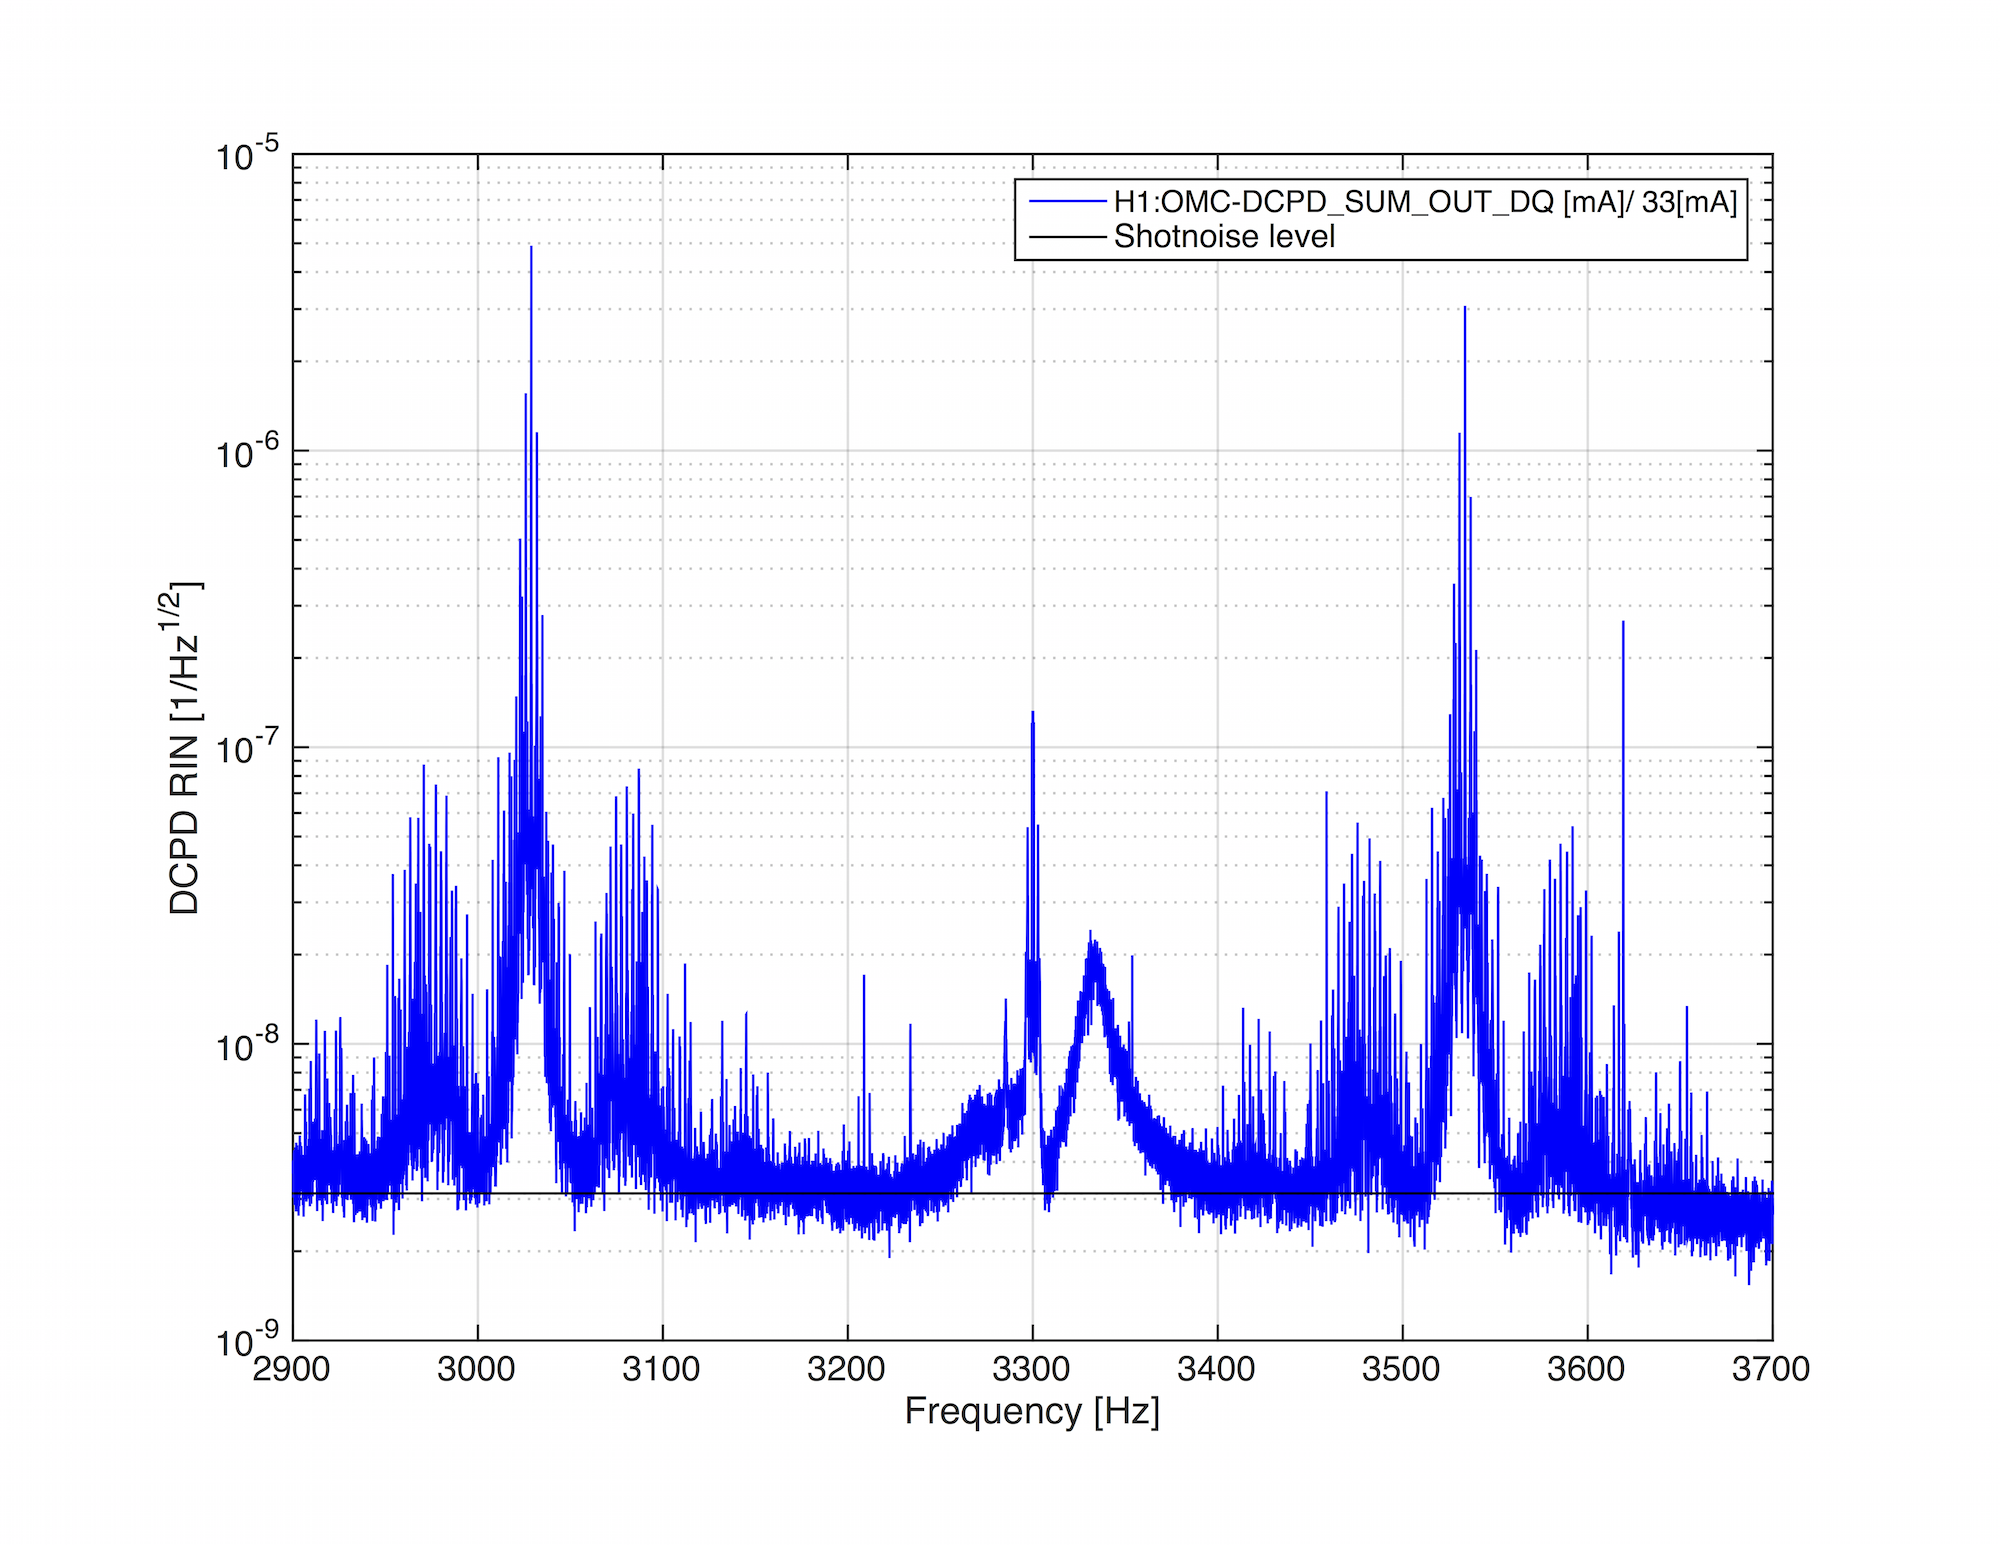
=> My guess is that this is the sensor noise. If you look at the DCPD spectrum (Attachment 4), the structure around the dither
frequency is asymmetric. This seems indicating that there is a bum ~3330Hz and a part of the bump is suppressed by the servo
while it is adding more noise to the lower side of the dither frequency.
=> I'd recomend to shift the dither frequency where there is no structure in the DCPD spectrum with in ~+/-100Hz of the dither freq.
b) what are the strong peaks above 100Hz. They are the down converted violin modes from ~3000 and ~3500Hz.
This is also visible in the DCPD spectrum (Attachment 4). Note that this strong harmonics of the violin modes are partly coming from
the saturation of the DCPD during this lock.
=> I'd recomend to use stronger roll-off or band-stop. Also the modulation frequency should probably be selected to push the violin
peaks in a small freq region in the dither error signal.
c) if it is ok to have the contamination if the cavity motion due to the dither locking.
=> We probably need to tune the servo filter to minimize the contamination to keep the requirement of 3x10-16 m/rtHz.
The design depends on how the noise bump at 35Hz is removed by shifting the modulaiton frequency.