andrew.lundgren@LIGO.ORG - posted 06:31, Sunday 03 May 2015 - last comment - 15:36, Sunday 03 May 2015(18193)
Range-wind correlation for some locks during mini-run
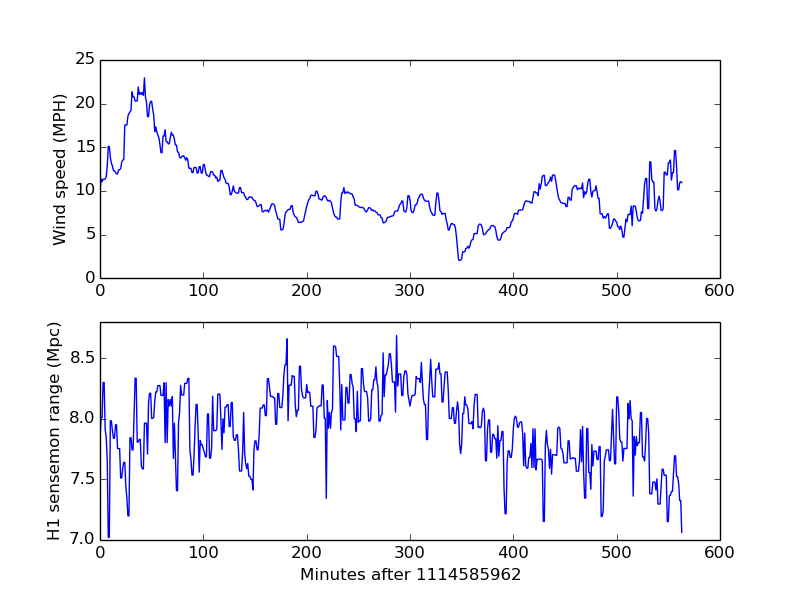
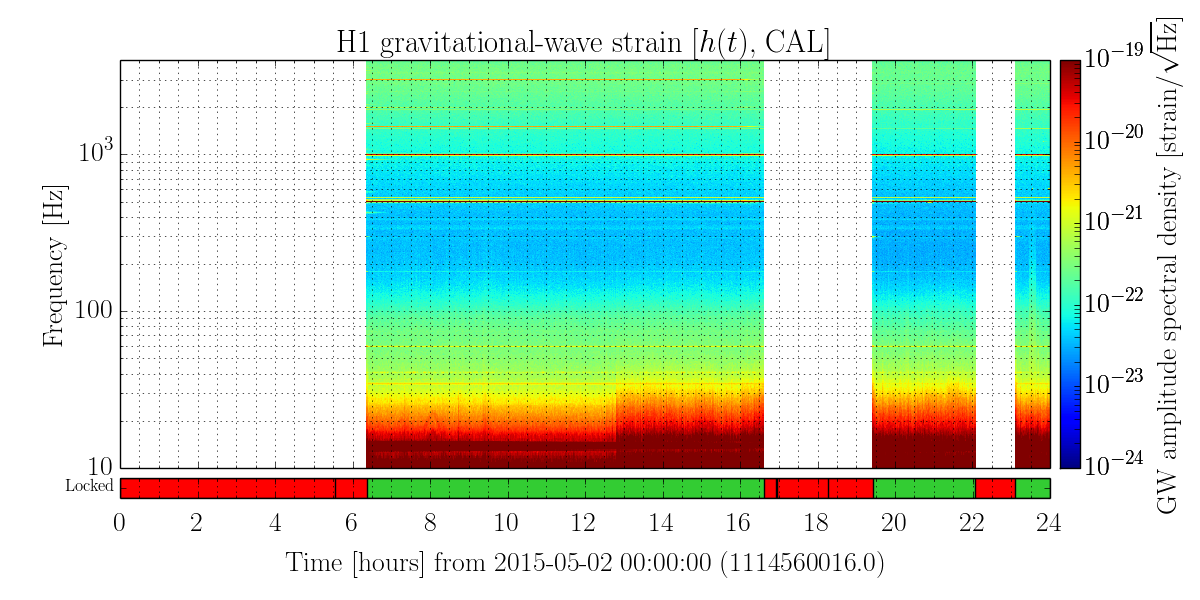
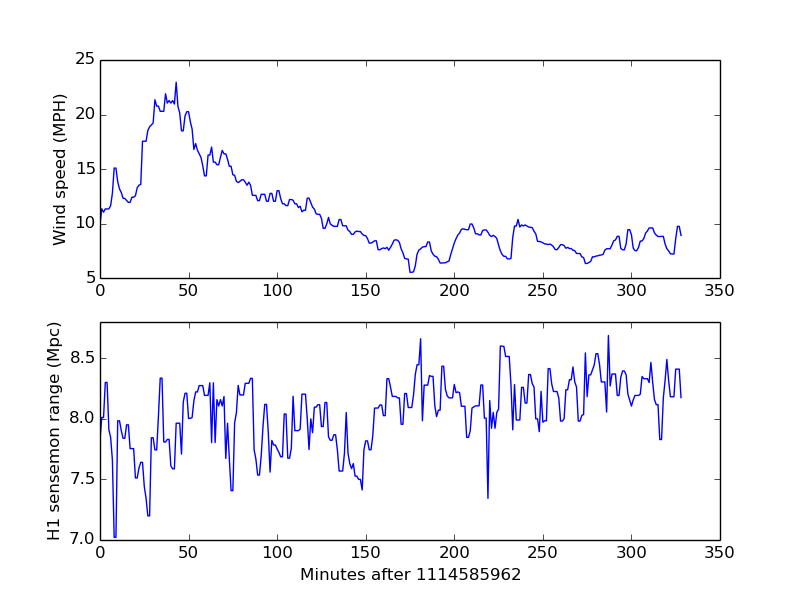
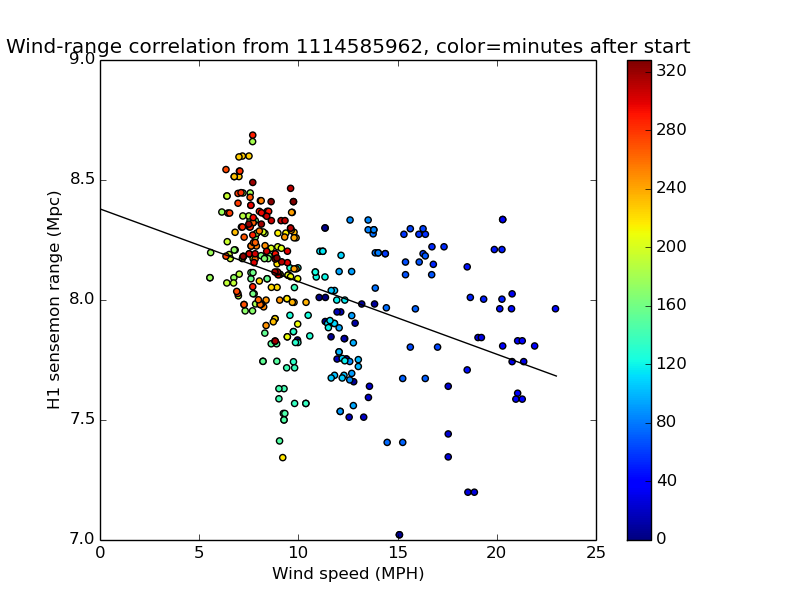
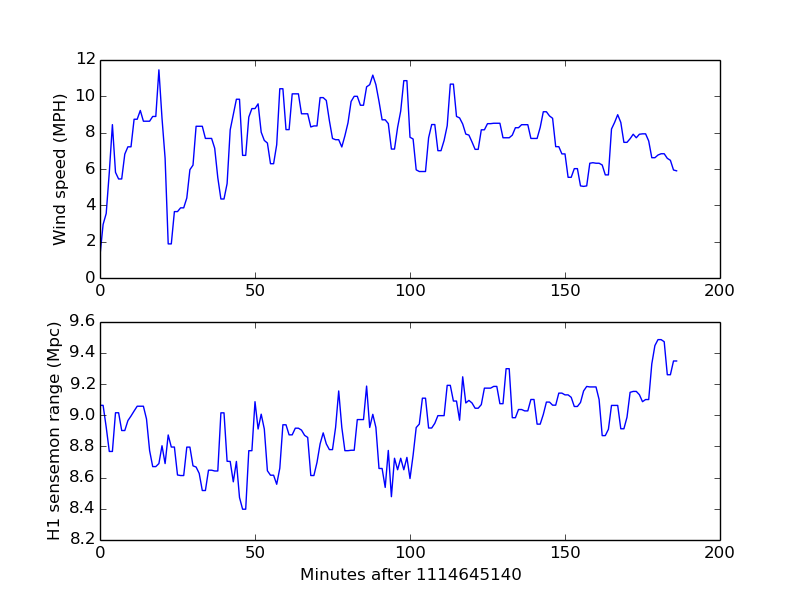
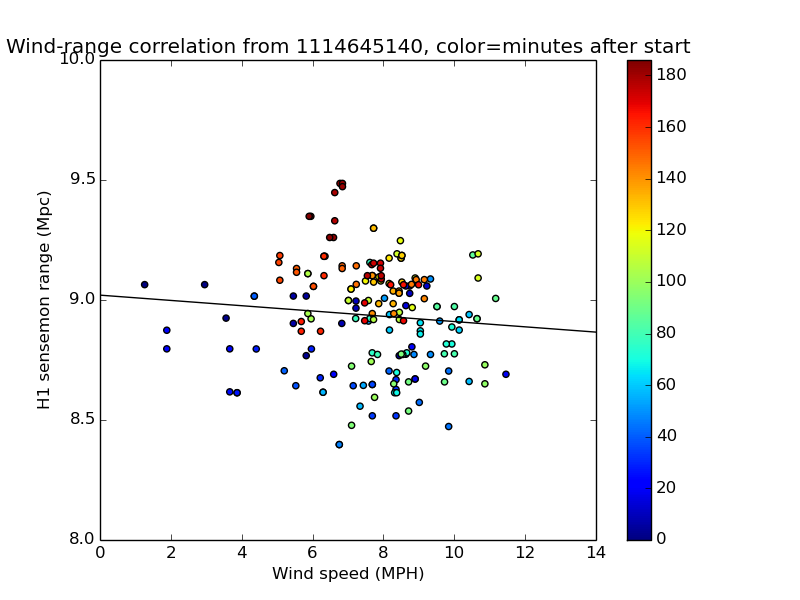
To answer Jeff's question about the wind, I looked at the ten hour lock, and the three hour lock starting about 23:30 UTC (ignoring the stochastic injection). I wrote a custom script to make the plots, since I couldn't get sensemon range from NDS. I've done a 3-minute median filter on the wind and range minute trends to smooth them out a bit.

The first plot shows the wind and range for the first lock. Around 12:30 UTC, the spectrogram (second plot) shows a big increase in the noise, and there's a corresponding decrease in the range. I think this is unrelated to the wind, and will be investigated elsewhere, so I've cut this lock off about 320 minutes in (third plot). The fourth plot is the scatter of the wind versus the range. A simple fit gives a value of 8.4 Mpc at zero with an 0.03 Mpc decrease per MPH of wind. The fifth and sixth plots are this repeated for the other lock, starting after the stochastic injection ends. The fit is 9.0 Mpc at zero with an 0.01 Mpc decrease per Mpc of wind.

I've attched the script I used. It needs a cache file for data of type H-SenseMonitor_CAL_H1_M called snsw.lcf. There's some values hard-coded, but it should be obvious what to change.
Images attached to this report
Non-image files attached to this report

Comments related to this report
Sweet set of plots, thanks! Can you (and/or @DetChar, collectively) make a similar assessment of wind vs. omicron glitchiness?