keita.kawabe@LIGO.ORG - posted 11:24, Monday 04 May 2015 (18204)
TMSY IR QPD still clipped
(Update: See Peter's alog.)
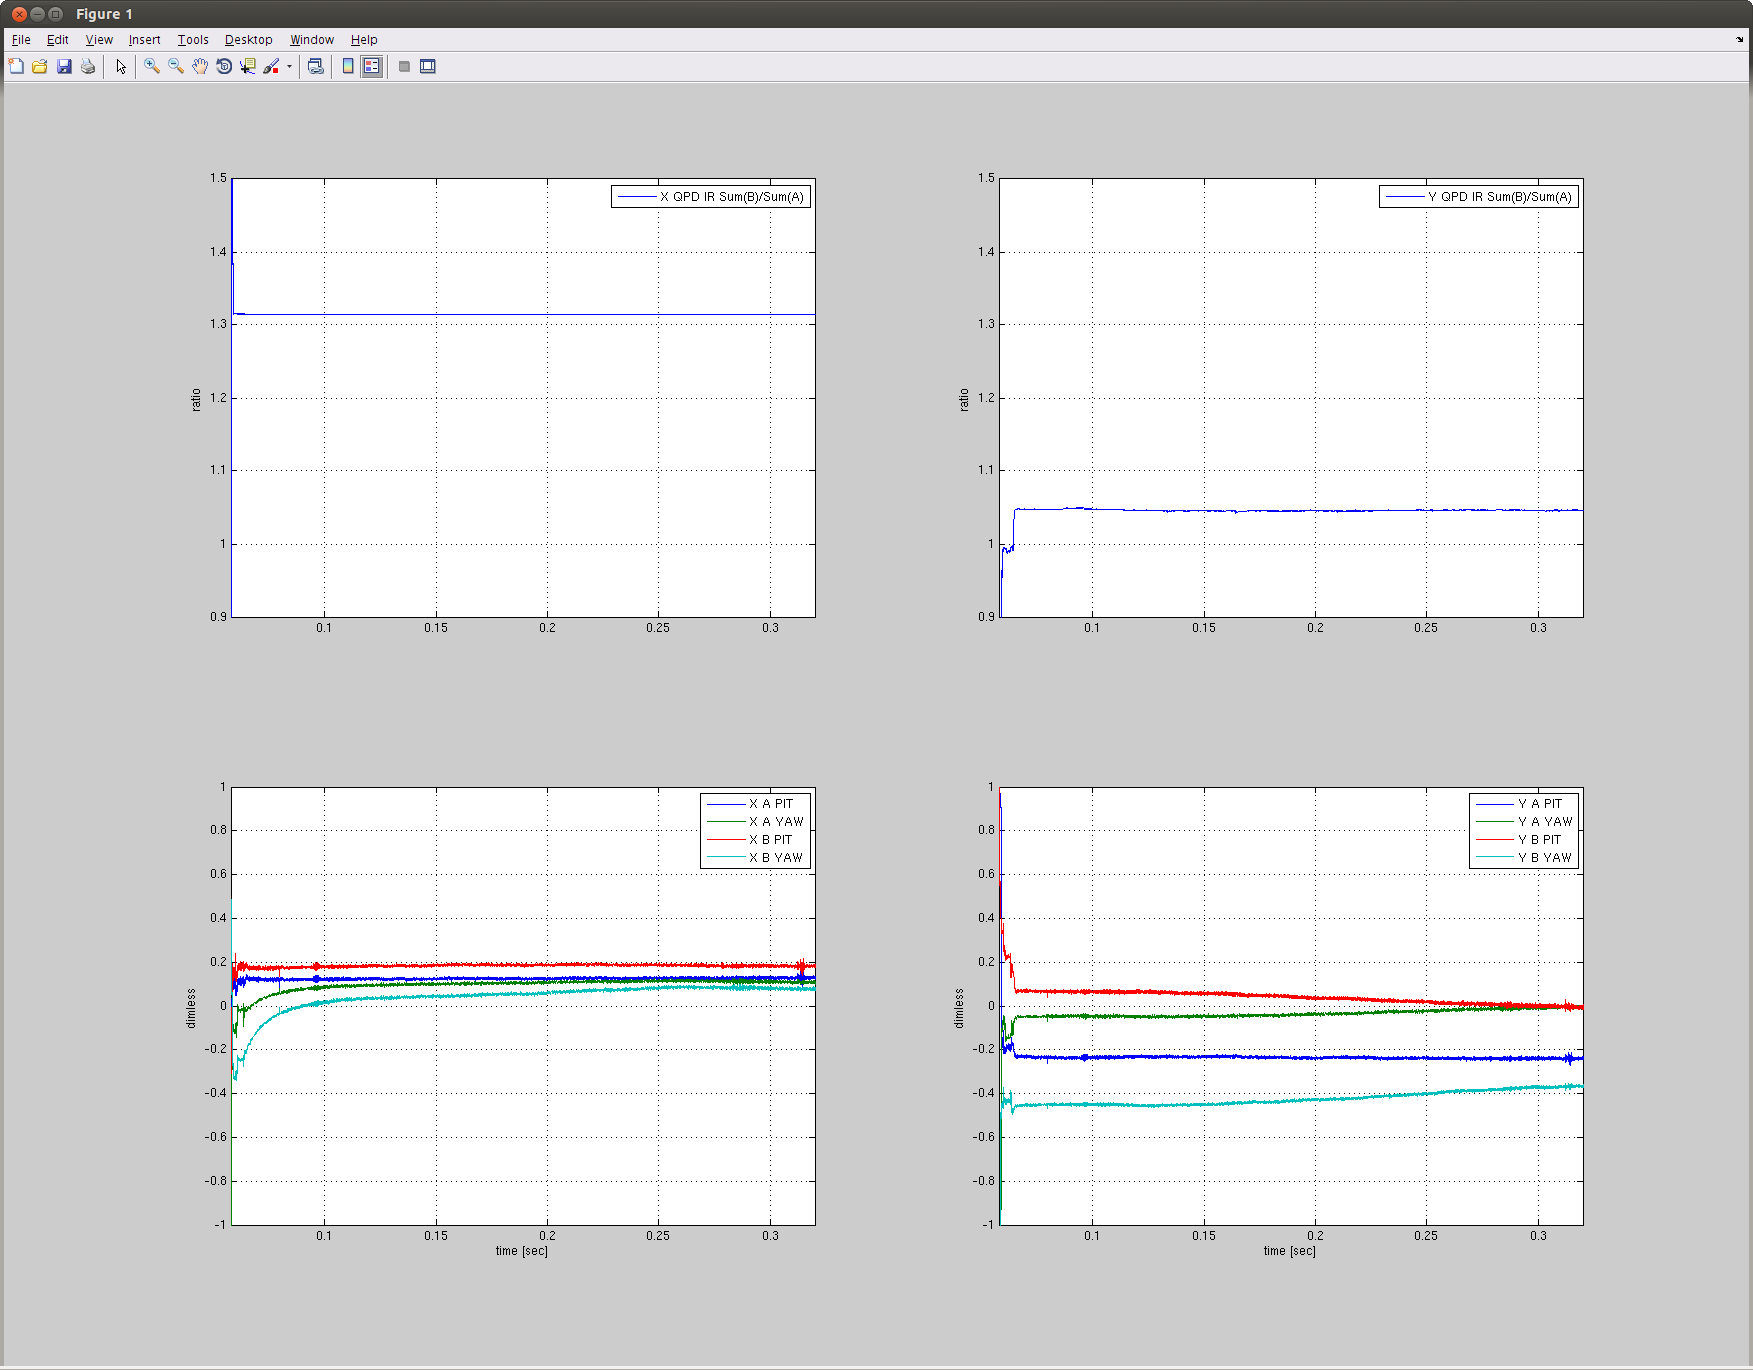
I looked at the lock stretch from last night and the IR QPDs on TMSY still show the sign of clipping though the saturation was fixed.
On the left column you have X QPD SUM(B)/SUM(A) data (top), which is basically just a solid flat line after the IR resonates in the arm over a large change in the IR alignment.
The top right plot for Y QPD SUM ratio has the same scale as the top left, it goes up and down in low power lock and then steps up when the power was increased. Even during the 10W lock, the ratio was not as stable as X.
It's not like Y beam is particularly moving larger than X.
Images attached to this report