Peter F, Kiwamu,
We looked into the DARM cavity pole tracker signals from the 13 hrs lock stretch from this weekend (alog 18489). Here are summary points:
- The DARM cavity pole showed a long-term drift (on a time scale of 13 hours). The frequency degraded from 350-ish Hz to 328-ish Hz.
-
We did not find a high coherence between the cavity pole tracker signals and the following channels:
- SUS_SRM_M1_LOCK_P(Y)
- SUS_SRM_M3_WIT_PIT(YAW)
- SUS_SR2_M1_LOCK_P(Y)
- SUS_SR2_M3_WIT_PIT(YAW)
- SUS_BS_M1_LOCK_P(Y)
- TCS-ITMX_HWS_PROBE_SPHERICAL_POWER
- OMCR
- TRX and TRY
- No idea what caused the change in the DARM cavity pole.
[DARM cavity pole tracker signals]
The plots below are the results from the cavity pole tracker:
![]()
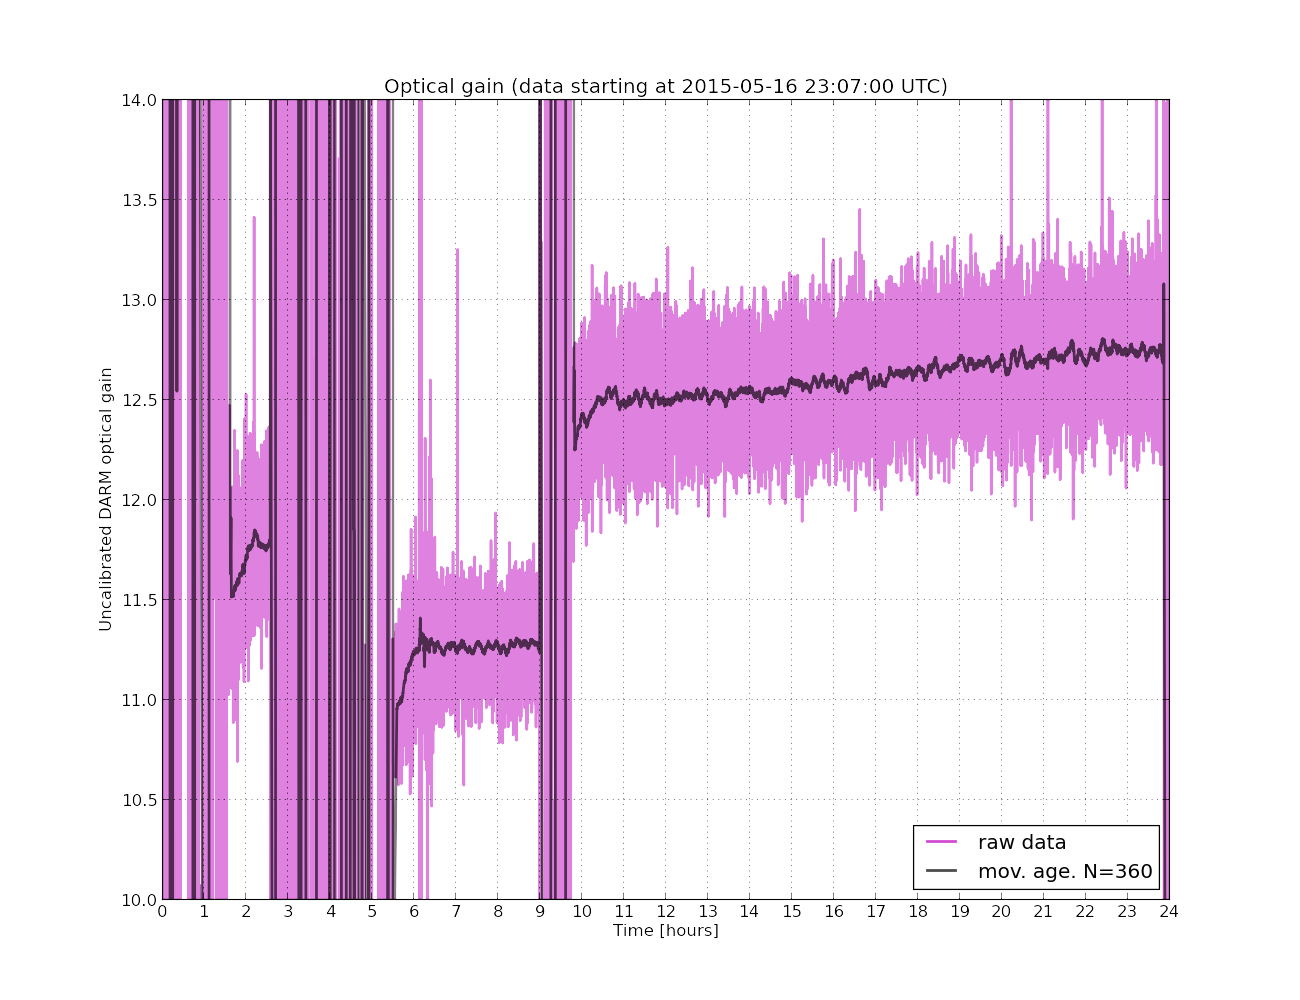
In both plots, the long stretch started at t = 9.5 hours or so and died at the very end of the plots. The first plot shows the cavity pole location as a function of the time. In addition to the raw data, I also plot a moving-averaged version of the cavity pole location. The movng average currently avarages with 360 data points or for 6 minutes to smooth them out. The same moving-average was applied to the optical gain as well for visiualization purpose.
As shown in the first plot, the DARM cavity pole tends to start from a frequency as high as 350 Hz at the beginning of every lock stretch and then sink down to about 340 Hz after an hour or so. This probably is thermal transient of ITM substrates on the local beam area. Also there clearly is slow drift in the cavity pole which resulted in a low DARM cavity pole frequency of about 328 Hz at the very end of the long lock stretch. According to Elli, the test masses reach the equilibrium point on a time scael of 6 hours, where the heat absorbed from the laser light equilibrate with the entire thermal bath including the chambers and etc. But, since the cavity pole kept drifting for more than 6 hours, it is not clear if we can conclude that this is the thermal lensing. On the other hand, the DARM optical gain increased in the longest lock stretch on the same time scale as the stretch itself. It increased by 1 or 2 %. Since the arm power also slowly increased by roughly 1 %, this may be just an indication of the change in the arm power (and perhaps also degradation in the signal-recycling gain).
[Searching for coherence]
One test we came up with was to take coherence between the cavity pole tracker signals (LOCKIN_I and LOCKIN_Q output signals) and various channgles in order to identify what channels contributed to the cavity pole frequency most. Since we knew that the alignment of SRC was important (alog 18436), we looked into the ASC feedback signals of SRM, SR2 and BS on their top stages, witness sensors or oplev of SRM, SR2 and SR3 and OMCR as listed in the very top of this alog entry. In addition, since the ITMX Hardtman wavefront sensor was active during this period, we searched for the coherence with it as well.
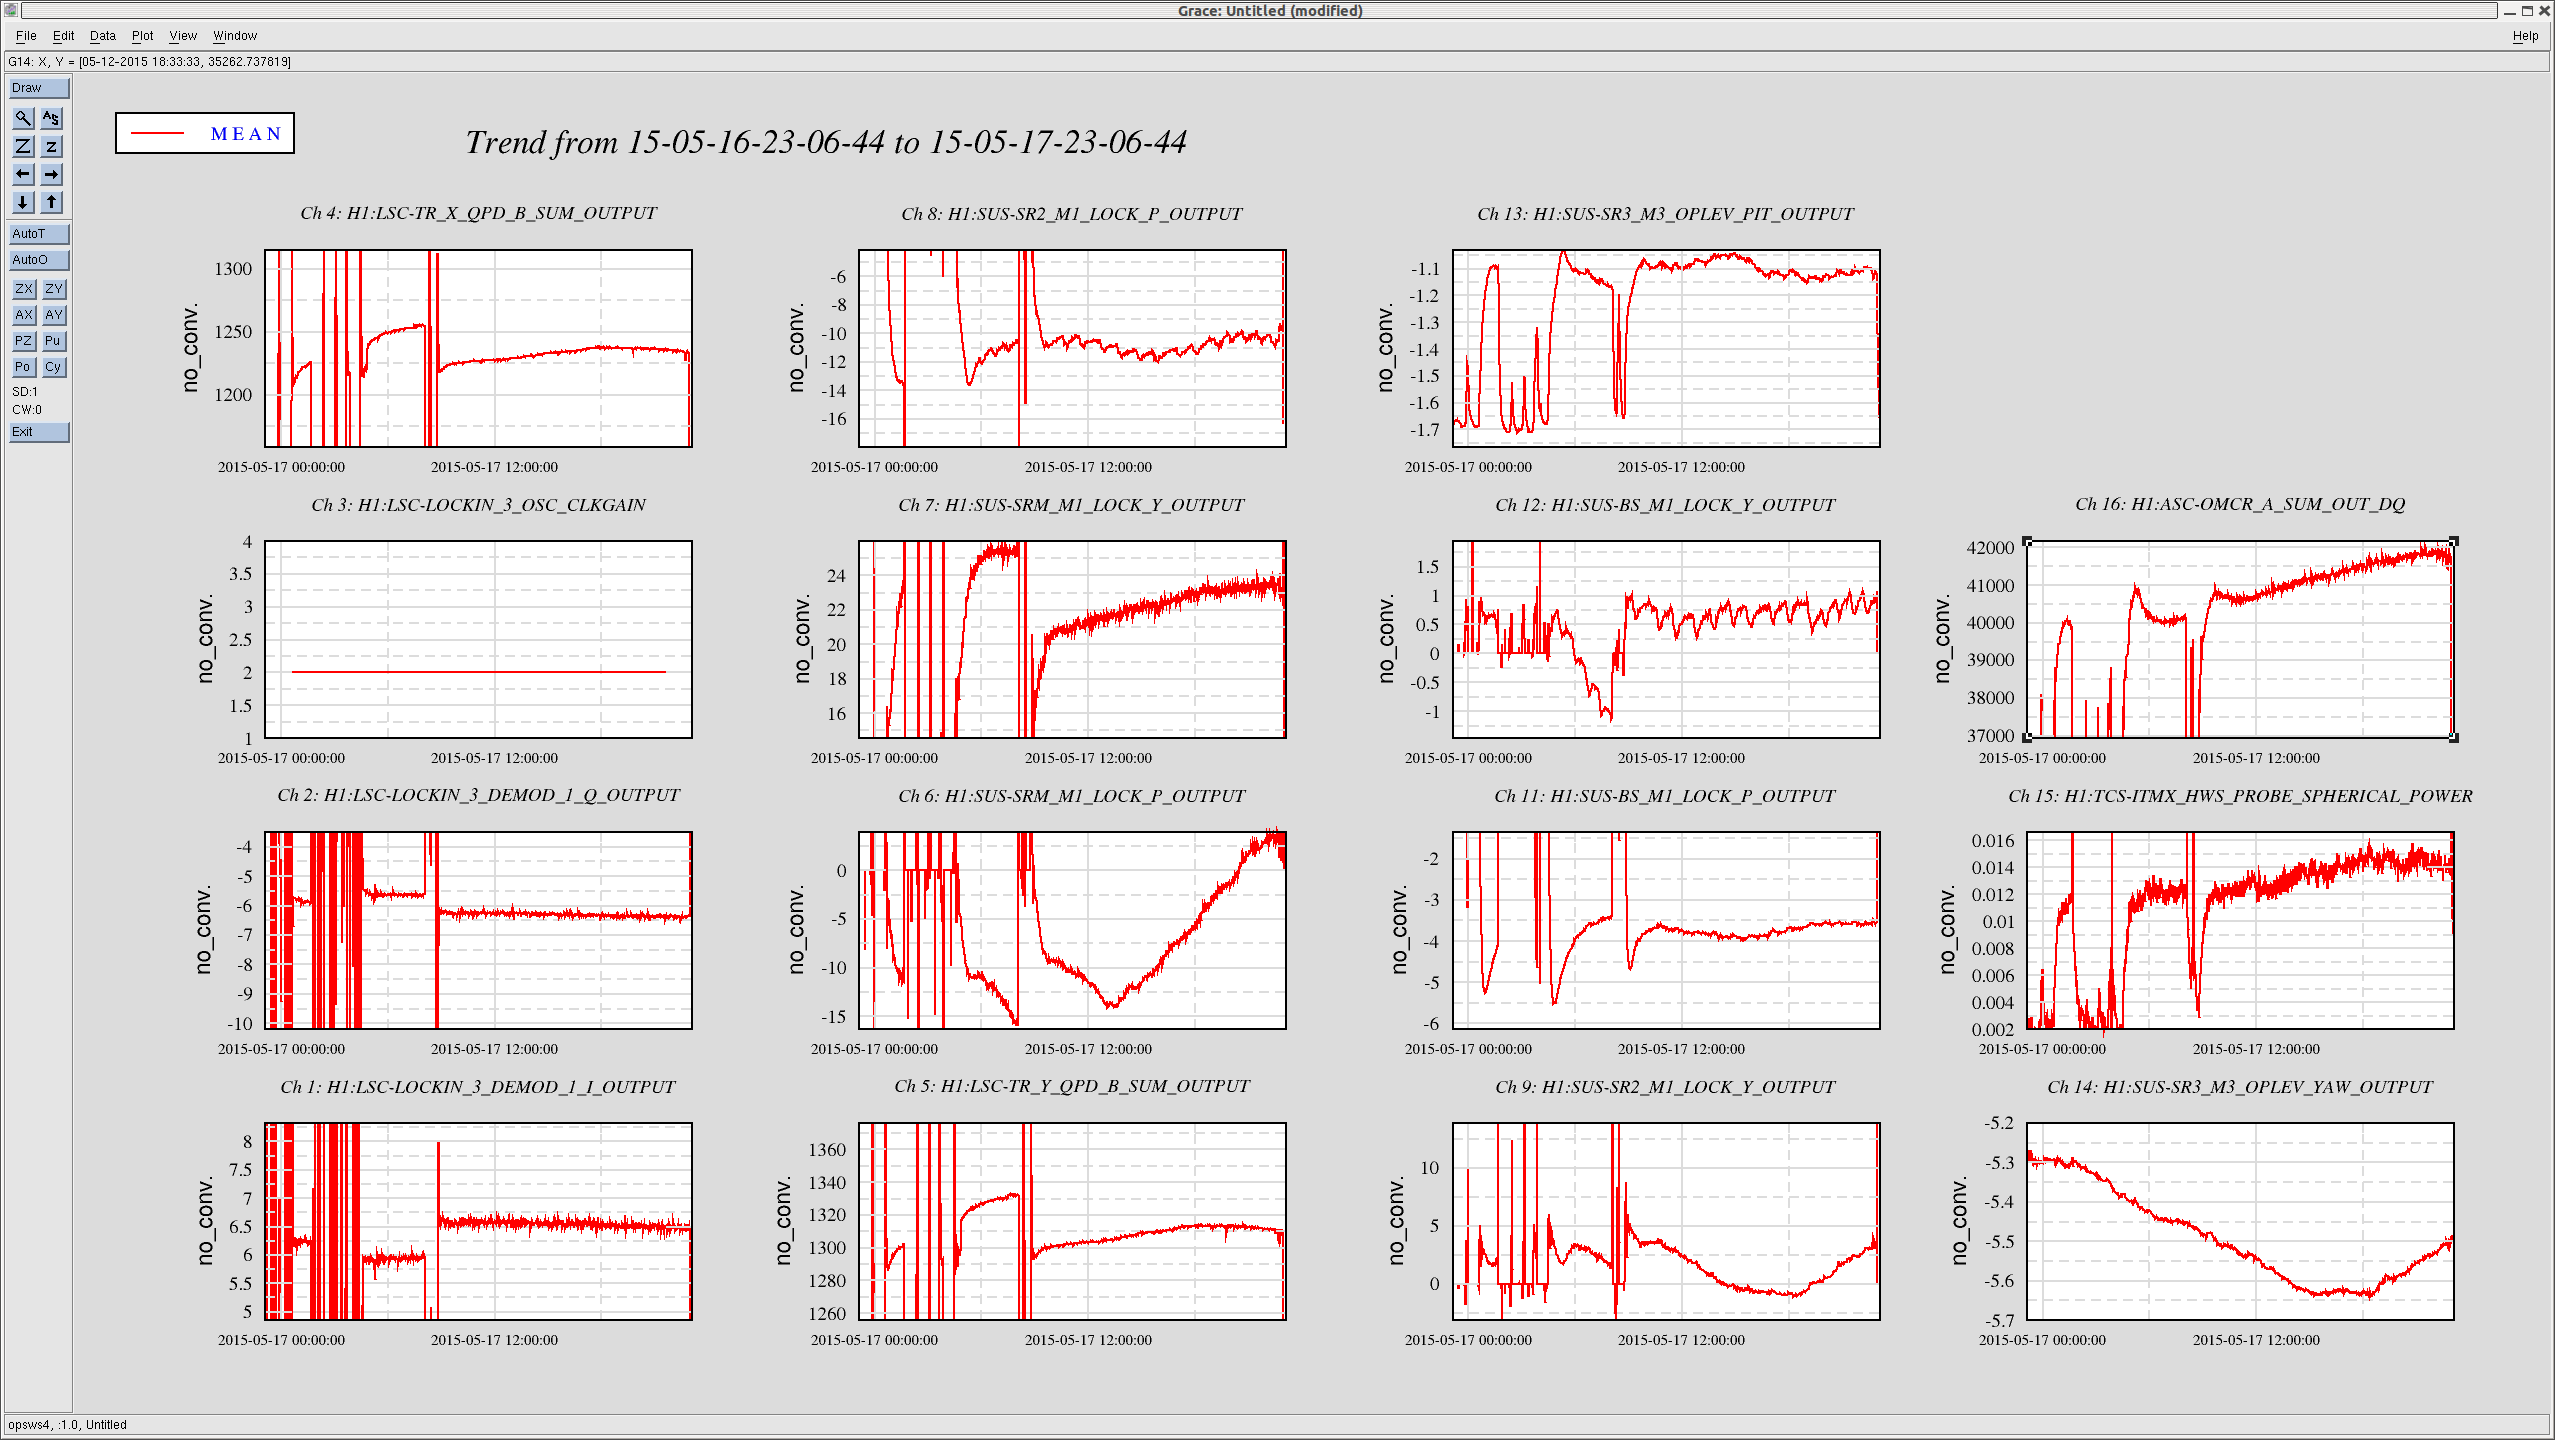
However, we did not find a high coherence from any of these channels. We used diaggui and picked a time which was roughly in the middle of the stretch. We did a Fourier analysis down to 1 mHz with a number of average of 20. I attach second trends of some relevant channels. Notably we clearly see slow drift in the ITMX HWS by roughly 6x10⁻⁶ [1/m] (there was a secret calibration fact of 0.00326 [1/m/counts]), but this was not coherent with the tracker signals. We also found a slow drift in OMCR which increased by roughly 2%, but no coherence either.