keith.riles@LIGO.ORG - posted 21:22, Thursday 04 June 2015 - last comment - 08:39, Thursday 09 July 2015(18879)
Narrow lines in early ER7 data
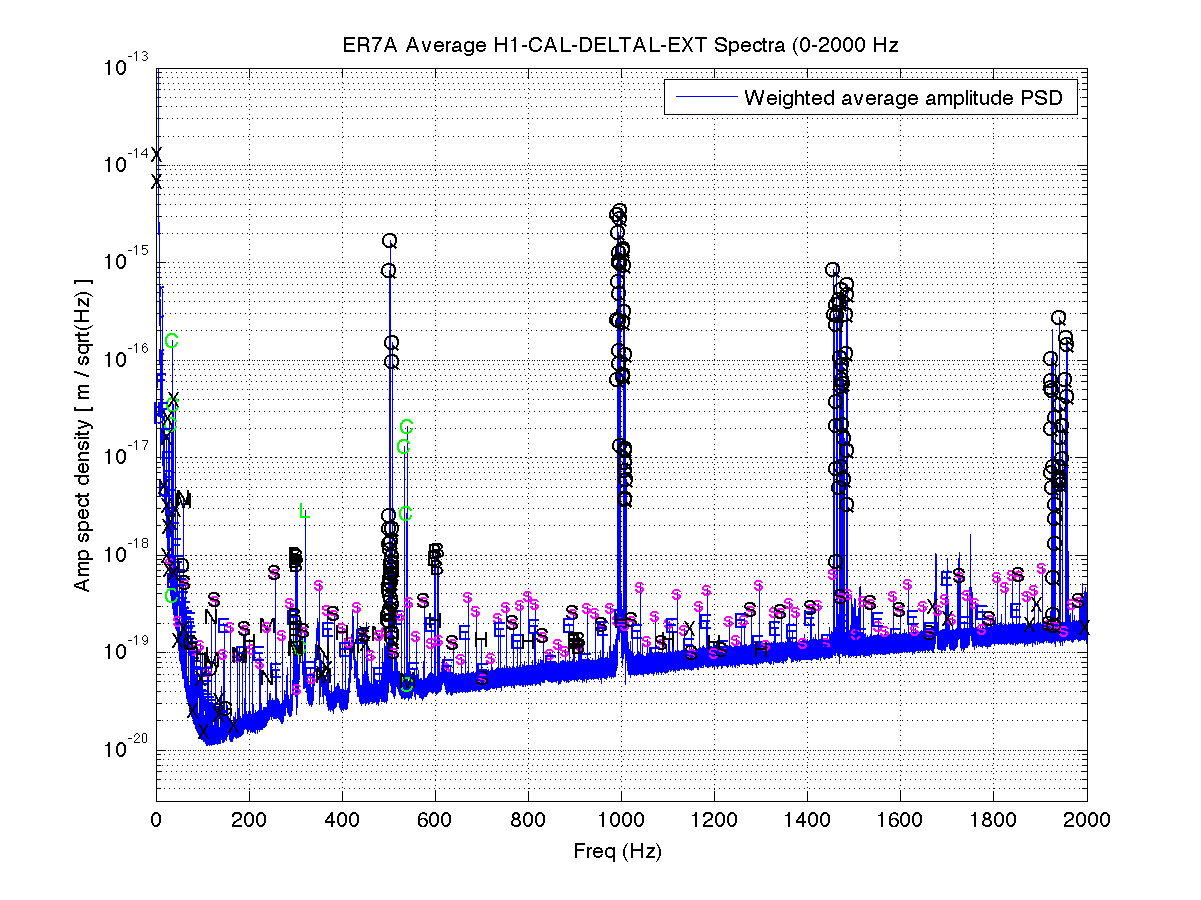
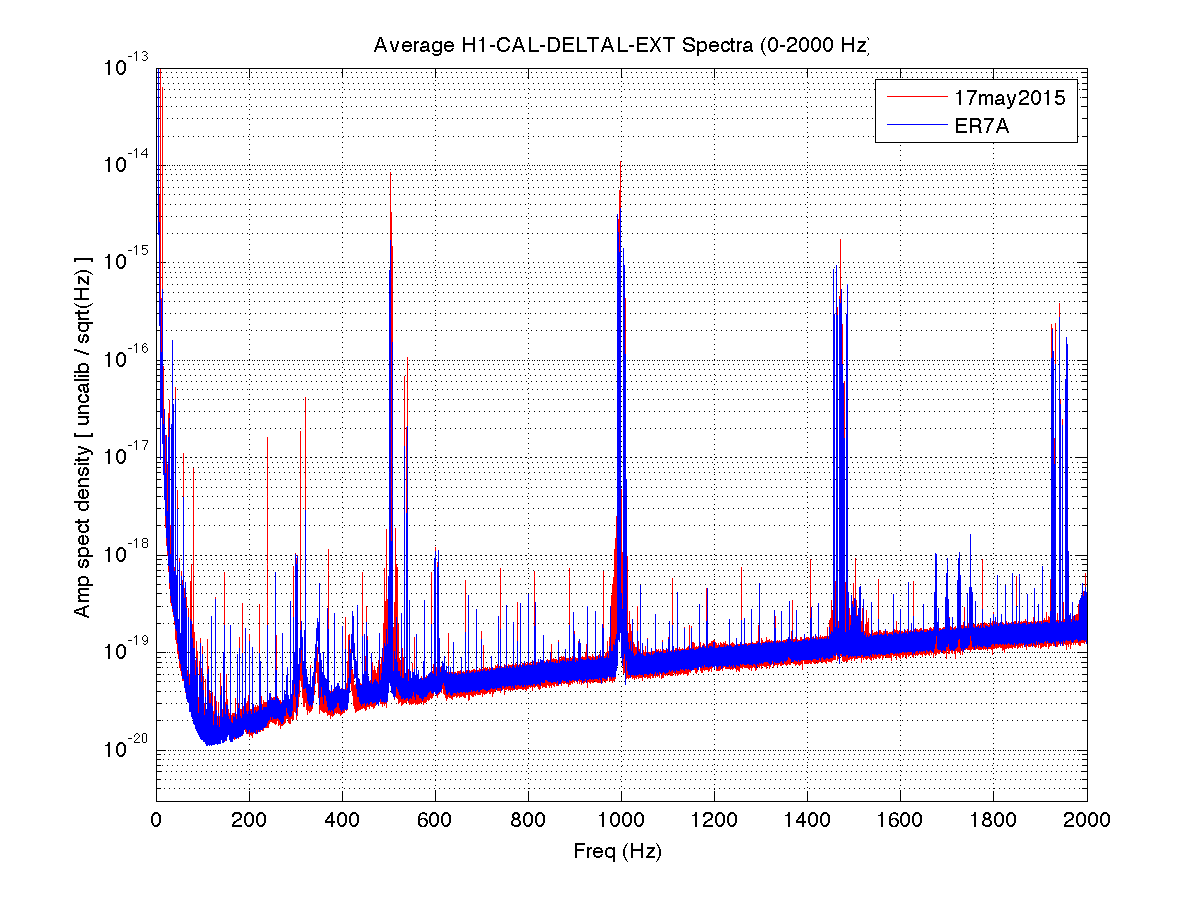
Following up this earlier report on pre-ER7 narrow lines in H1 DARM, attached is a corresponding
list of early ER7 lines and some spectra for 30.5 hours of data from May 31 through June 4 at 13:00 UTC, based
on FScans SFTs generated as of Thursday morning.

Figure 1 shows the 0-2000 Hz spectrum for the early ER7 data with line labels according to the same scheme as before.

Figure 2 shows the mid-May and early ER7 spectra overlain without line label clutter.

Attachment 1 is the early ER7 line list (nearly identical in line frequencies but not strengths to that of mid-May)

Attachment 2 is a zipped tar file of 27 sub-band spectra for early ER7 with lines labeled.

Attachment 3 is a zipped tar file of 27 sub-band spectra comparing mid-May to early ER7 without labels.

I haven't yet digested all of the changes from mid-May to the early ER7A data (what I call ER7A here), but here are things that are immediately apparent::
- Bounce and roll modes are greatly reduced in this ER7 sample
- Quad violin modes are less excited in this ER7 sample
- The previous comb with a fundamental of 36.9733 Hz (54 harmonics visible) has shifted slightly to a fundamental of 36.9725 Hz (50 harmonics visible).
- The broad structures seen in the 280-440 Hz band are worse in early ER7 than in mid-May (due to PSL jitter, if I understood Robert correctly)
- The nefarious OMC alignment dithers and their upconversion have reappeared in what the CW group considers to be an astrophysically interesting band (anything below 2 kHz) at frequencies of 1675.1, 1700.1, 1725.1 and 1750.1 Hz
- Whatever dithers there were previously at 81.0000 and 310.0000 Hz have disappeared.
Images attached to this report
Non-image files attached to this report


Comments related to this report
We used the coherence tool to try and see if there was a coherence between h(t) and other channels for this 36.9725 Hz noise line and its harmonics.

There is a coherence between the h(t) channel and ...
H1:PEM-CS_MAG_EBAY_SUSRACK_Z_DQ
at
36.9725 Hz * 2 =  73.9450 Hz (definitely)
36.9725 Hz * 3 = 110.9175 Hz (barely above background)
36.9725 Hz * 4 = 147.89 Hz (definitely)
36.9725 Hz * 5 =  184.8625 Hz (above background)
36.9725 Hz * 6 = 221.8350 Hz (definitely)
...
For whatever reason the even harmonics are stronger.
The mat file for the coherence is here:
https://ldas-jobs.ligo-wa.caltech.edu/~eric.coughlin/ER7/LineSearch/H1_COH_1116633616_1118275216_SHORT_1_webpage/data/H1:PEM-CS_MAG_EBAY_SUSRACK_Z_DQ_data.mat

For H1:PEM-CS_MAG_EBAY_SUSRACK_X_DQ there is a coherence with h(t) at
36.9725 Hz * 4 = 147.89 Hz (barely about background)
See
https://ldas-jobs.ligo-wa.caltech.edu/~eric.coughlin/ER7/LineSearch/H1_COH_1116633616_1118275216_SHORT_1_webpage/data/H1:PEM-CS_MAG_EBAY_SUSRACK_X_DQ_data.mat

For For H1:PEM-CS_MAG_EBAY_SUSRACK_Y_DQ there is a coherence with h(t) at
36.9725 Hz * 2 = 73.9450 Hz (barely above background)
36.9725 Hz * 4 = 147.89 Hz (above background)
36.9725 Hz * 5 =  184.8625 Hz (barely above background)
36.9725 Hz * 6 = 221.8350 Hz (above background)
...
See
https://ldas-jobs.ligo-wa.caltech.edu/~eric.coughlin/ER7/LineSearch/H1_COH_1116633616_1118275216_SHORT_1_webpage/data/H1:PEM-CS_MAG_EBAY_SUSRACK_Y_DQ_data.mat

Nothing in the other magnetometers.

Nelson, Eric Coughlin, Michael Coughlin