Dan, Travis
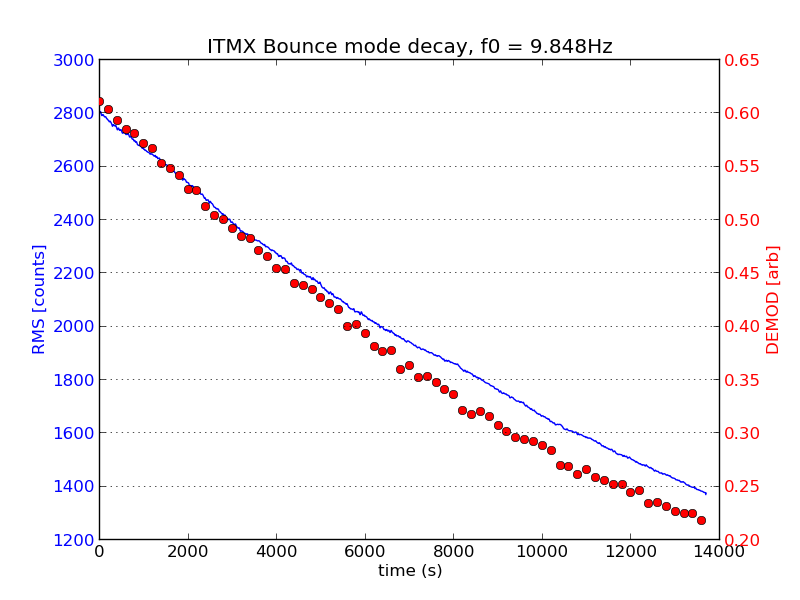
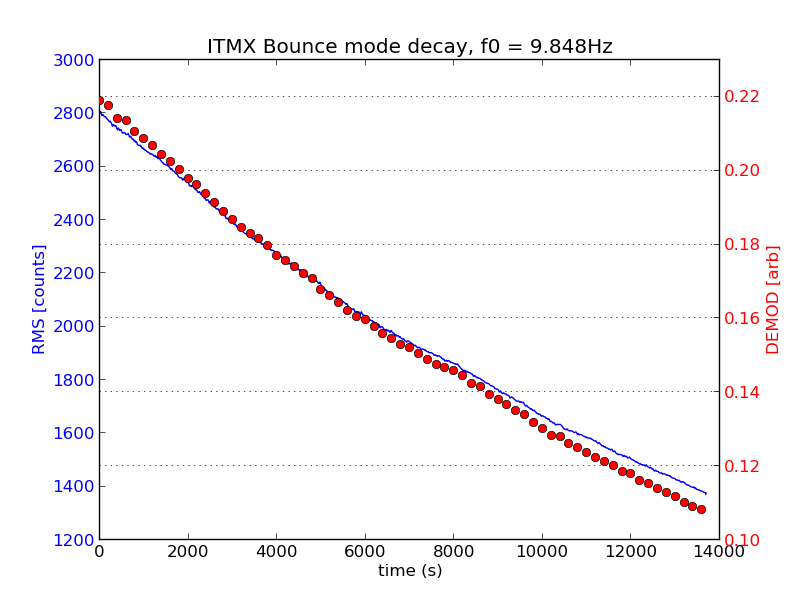
Tonight during our long lock we measured the decay time constant of the ITMX bounce mode. At 10:10 UTC we set the intent bit to "I solemnly swear I am up to no good" and flipped the sign on the ITMX_M0_DARM_DAMP_V filter bank and let the bounce mode ring up until it was about 3e-14 m/rt[Hz] in the DARM spectrum. Then, we zeroed the damping gain and let the mode slowly decay over the next few hours.
We measured the mode's Q by fitting the decay curve in two different datasets. The first dataset is the 16Hz-sampled output of Sheila's new RMS monitors; the ITMX bandpass filter is a 4th-order butterworth with corner frequencies of 9.83 and 9.87Hz (the mode frequency is 9.848Hz, +/- 0.001 Hz). This data was lowpassed at 1Hz and fit with an exponential curve.
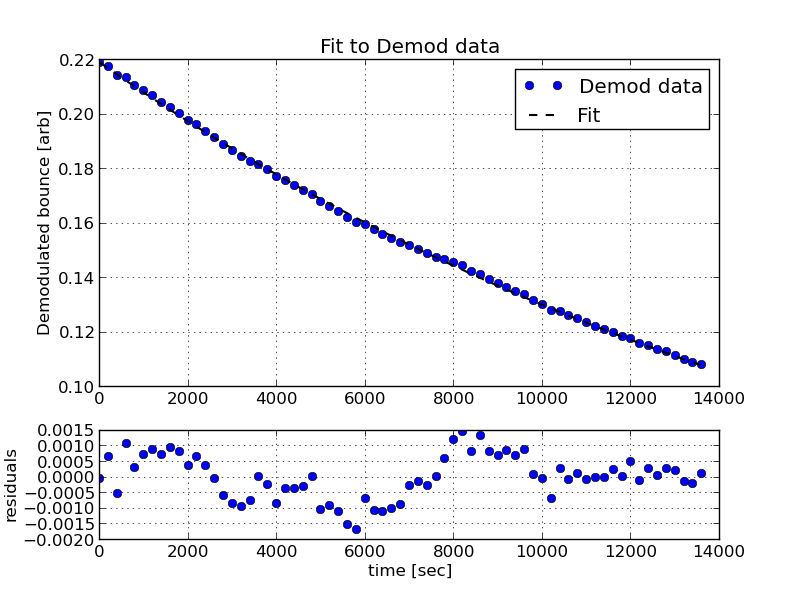
For the second dataset I followed Koji's demodulation recipe from the OMC 'beacon' measurement. I collected 20 seconds of DELTAL_EXTERNAL_DQ data, every 200 seconds; bandpassed at 9 and 12Hz, demodulated at 9.484Hz, and lowpassed at 2Hz; and collected the median value of the sum of the squares of the demod products. Some data were neglected on the edges of the 20-sec segment to avoid filter transients. These every-200-sec datapoints were fit with an exponential curve.
Results attached; the two methods give different results for Q:
RMS channel: 594,000
Demodulated DARM_ERR: 402,000
I fiddled with the data collection parameters and filtering parameters for both fits, but the results were robust. When varying parameters for each method the results for Q were repeatable within +/- 2,000, this gives some sense of the lower limit on uncertainty of the measurement. (The discrepancy between the two methods gives a sense of the upper limit...) Given a choice between the two I think I trust the RMS channel more, the demod path has more moving parts and there could be a subtlety in the filtering that I am overlooking. The code is attached.
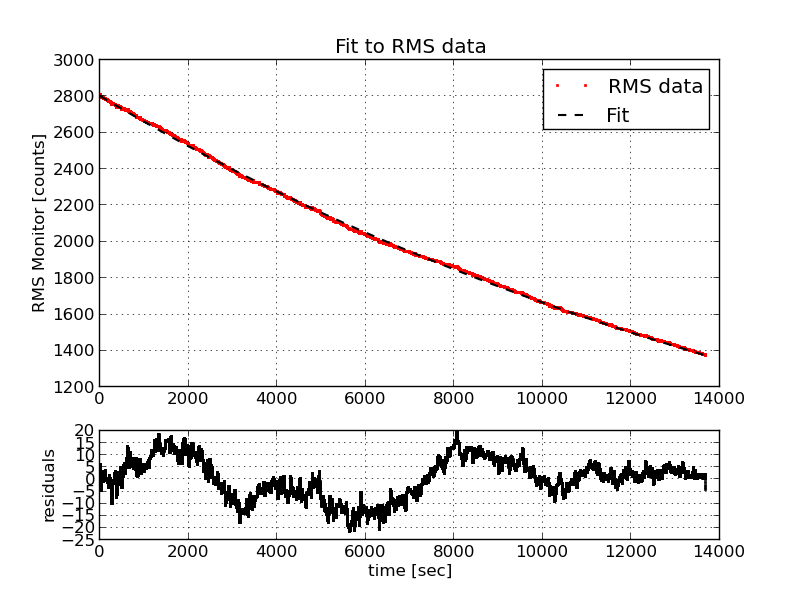
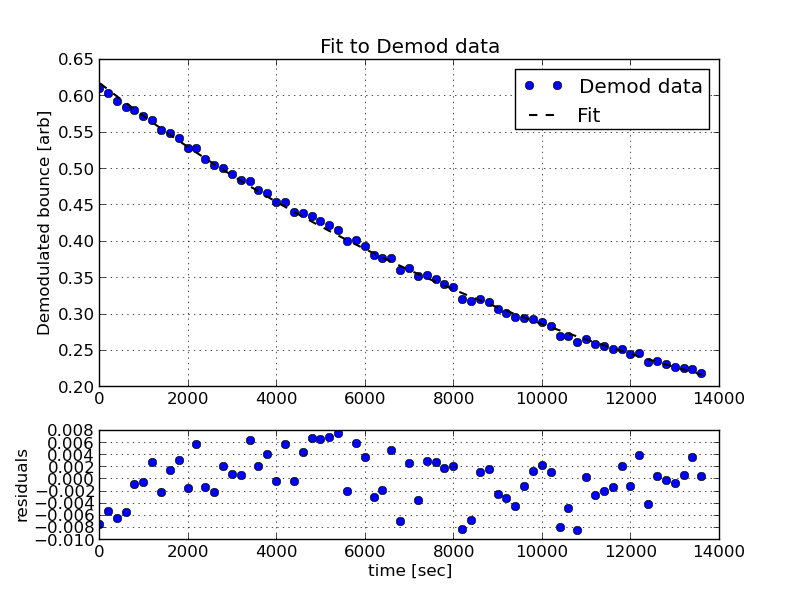

I figured out what was going wrong with the demod measurement - not enough low-passing before the decimation step, the violin modes at ~510Hz were beating against the 256Hz sample rate. With another layer of anti-aliasing the demod results are in very good agreement with the RMS channel:
RMS channel: 594,400
Demodulated DARM_ERR: 593,800

To see what we might expect, I took the current GWINC model of suspension thermal noise and did the following.
1) Removed the horizontal thermal noise so I was only plotting vertical.
2) Updated the maraging steel phi to reflect recent  measurement (LLO alog 16740) of Q of UIM blade internal mode of 4 x 10^4. (It is phi of 10^-4, Q 10^4 in the current GWINC). I did this to give better estimate of the vertical noise from higher up the chain.
3) Plotted only around the thermal noise peak and used 1 million points to be sure I resolved it.

Resulting curve is attached. Q looks approx 100K, which is less than what was reported in this log. That is encouraging to me. I know the GWINC model is not quite right - it doesn't reflect tapered shape and FEA results.  However to see a Q in excess of what we predicted in that model is definitely in the right direction.
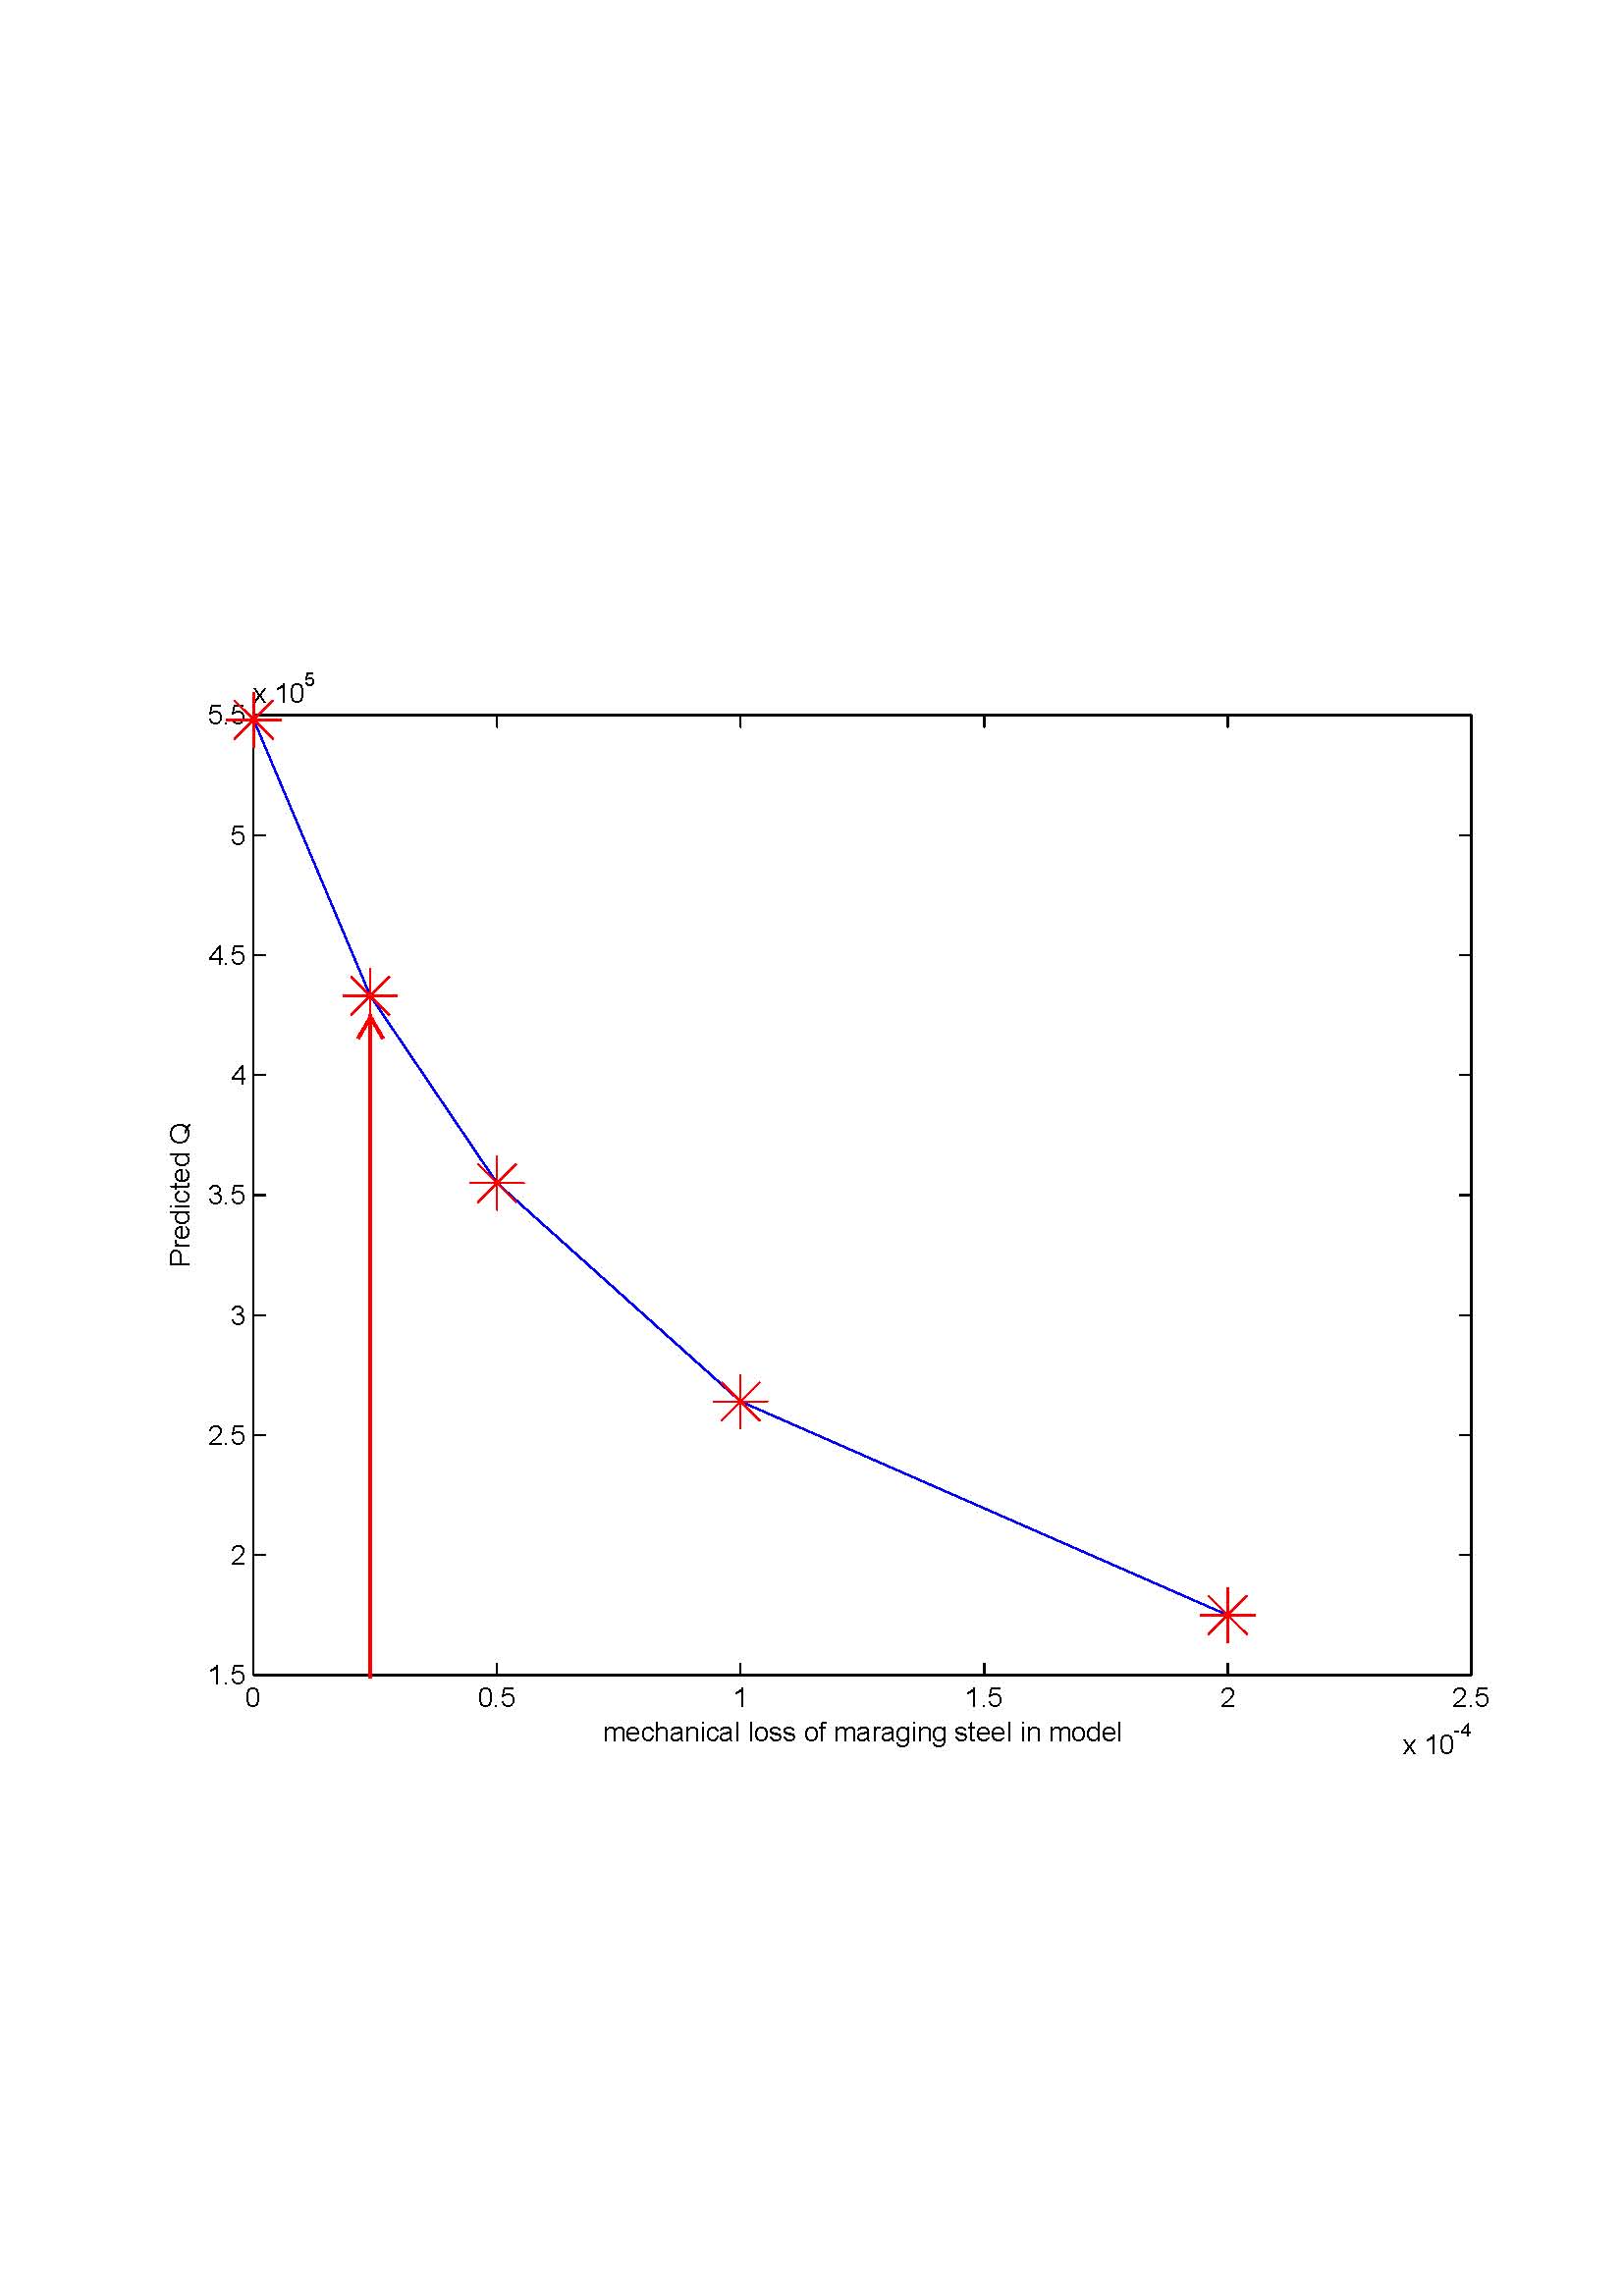
Here we take the Mathematica model with the parameter set 20150211TMproduction and we look at varying some of the loss parameters to see how the model compares with these measurements. The thermal noise amplitude in the vertical for the vertical bounce mode is tabularised around the resonance and we take the full width at 1/√2 height to calculate the Q (equivalent to ½ height for power spectrum). With the recently measured mechanical loss value for maranging steel blade springs of 2.4 e-5, the Mathematica model predicts a Q of 430,000. This is a little bit lower Q than the measurement here, but at this level the loss of the wires and the silica is starting to have an effect, and so small differences between the model and reality could show up. Turning off the loss in the blade springs altogether only takes the Q to 550,000, so other losses are sharing equally in this regime. The attached Matlab figures shows mechanical loss factor of maraging steel versus predicted bounce mode Q and against total loss plus the resonance as a function of loss.
Angus Giles Ken & Borja

Since there has been some modeling afoot, I wanted to post the statistical error from the fits above, to give a sense of the [statistical] precision on these measurements. The best-fit Q value and the 67% confidence interval on the two measurements for the bounce mode are:
RMS channel: 594,410 +/- 26
Demodulated DARM_ERR: 594,375 +/- 1590
The data for the measurements are attached. Note that this is just the statistical error of the fit -- I am not sure what systematics are present that could bias the measurement in one direction or another. For example, we did not disable the top-stage local damping on ITMX during this measurement, only the DARM_CTRL --> M0 damping that is bandpassed around the bounce mode. There is also optical lever feedback to L2 in pitch, and ASC feedback to L2 in pitch and yaw from the TRX QPDs (although this is very low bandwidth). In principle this feedback could act to increase or decrease the observed Q of the mode, although the drive at the bounce mode frequency is probably very small.
