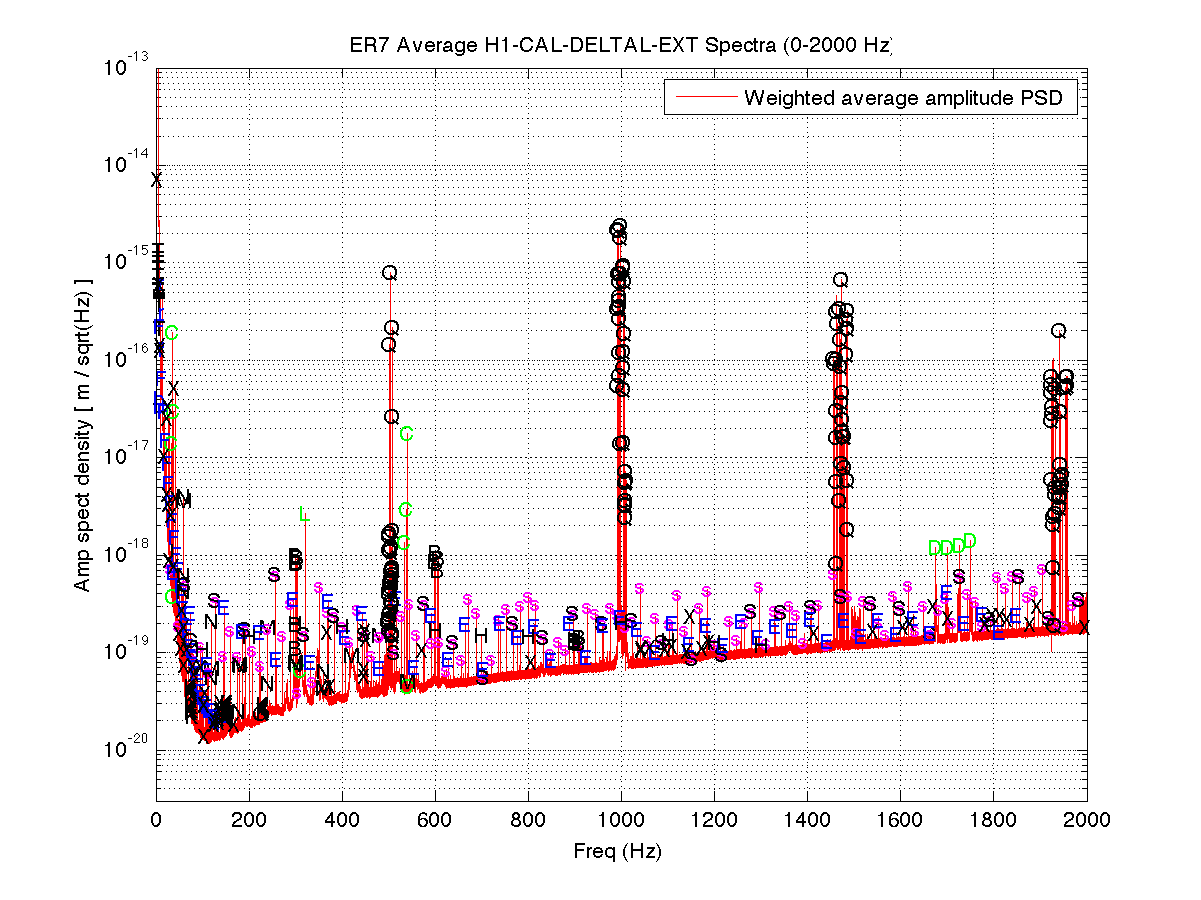
Following up an earlier report on narrow lines in early ER7 data ("ER7A"), attached are spectra and a longer list of lines found in the 5-2000 Hz band
from examining an inverse-noise-weighted average spectrum over 149 hours of full-ER7 DC-readout data, using 30-minute Hann-windowed FScan SFTs.

The overall spectrum is similar to before, but the additional data reveals more structure. Here are highlights and lowlight of apparent changes:
- The bounce modes are better suppressed in the latter part of the run.
- A comb with 0.1698-Hz spacing is now visible in its 41st through 59th harmonics
- There is a newly apparent comb-on-comb structure with a fine spacing of 0.0884 Hz attached to a comb of 76.9426-Hz lines. Only the clusters up to the 3rd harmonic of 76.94 Hz are labeled on the spectra, but one can still see indications of the comb-on-comb up to at least the 12th harmonic at 923 Hz.
- Something I overlooked before is that the OMC dither lines at 1675.1, 1700.1, 1725.1 and 1750.1 Hz are prominent on top of their induced up-conversion. This is in contrast to what I usually see in L1 data, where the dither lines themselves are servoed to near zero and are barely visible in the up-conversion they create.
- In addition to the previously noted combs of 16 Hz and 64 Hz harmonics, one can now see a very sporadic set of 8-Hz lines. The more prominent ones are marked on the spectra and include 376, 552, 808, 1064, 1096, 1112, 1144, 1176, 1192, 1416, 1544, 1608, 1624, 1672, 1704, 1784, 1800, 1816, 1832, 1880 and 1896 Hz.


Thanks Keith!
Regarding the OMC dither lines, we had been running with the dithering enabled, but for nearly all of ER7 the error signals for the OMC-ASC loops were derived from the QPD signals. So, the dither lines were injected, but not suppressed. This choice was made because the dither signals acquire a large pitch offset when we run at high power, enough that using those error signals can saturate the OMC-SUS as the alignment loops try to correct. (The reason for the offset is not understood, maybe due to some junk light on the other QPDs used in HAM6 alignment that is not significant at low power.) Our preferred solution is to use something other than the OMC-SUS to center the beam, and switch to the dither loops for alignment. I wanted to keep the dither lines present to monitor the alignment drift during the run, this is something I haven't had a chance to follow up.
Before ER8 we will either switch to the dither signals for OMC alignment and move the frequencies above 2kHz, or decide to run on the QPD signals and turn off the dithering. Either way these nefarious lines won't be in the band. :)