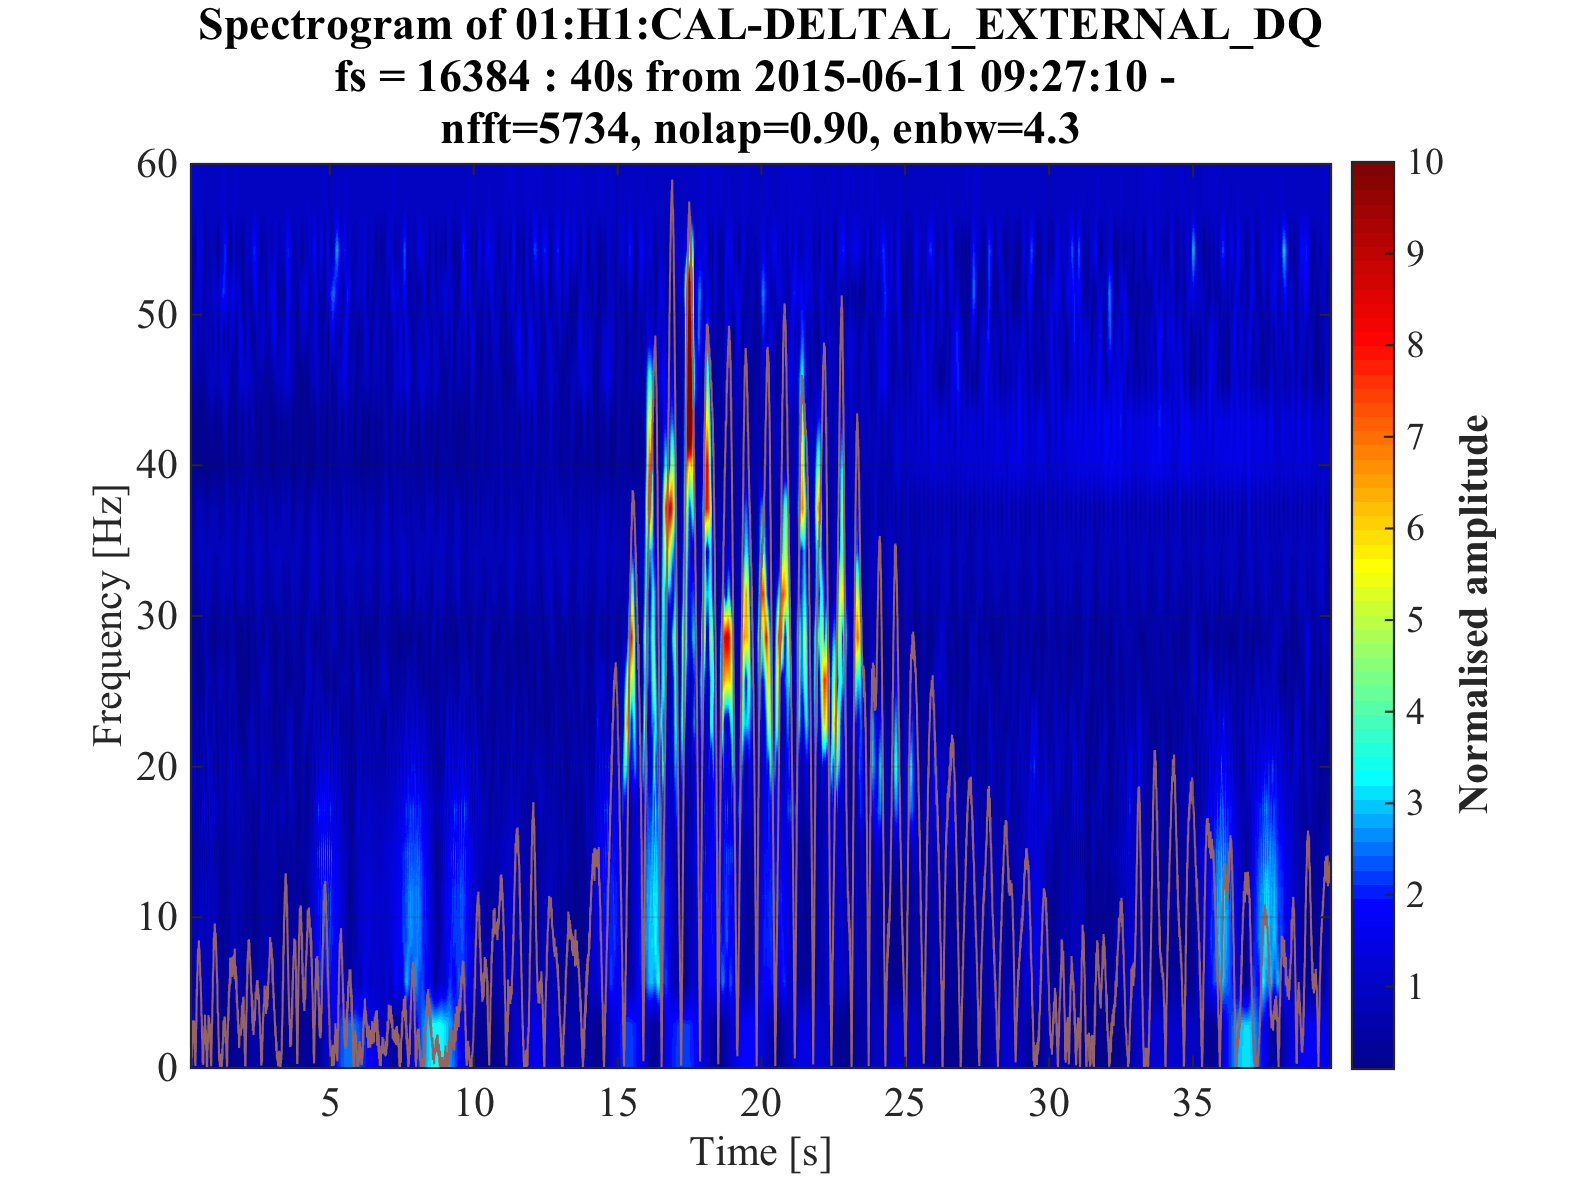
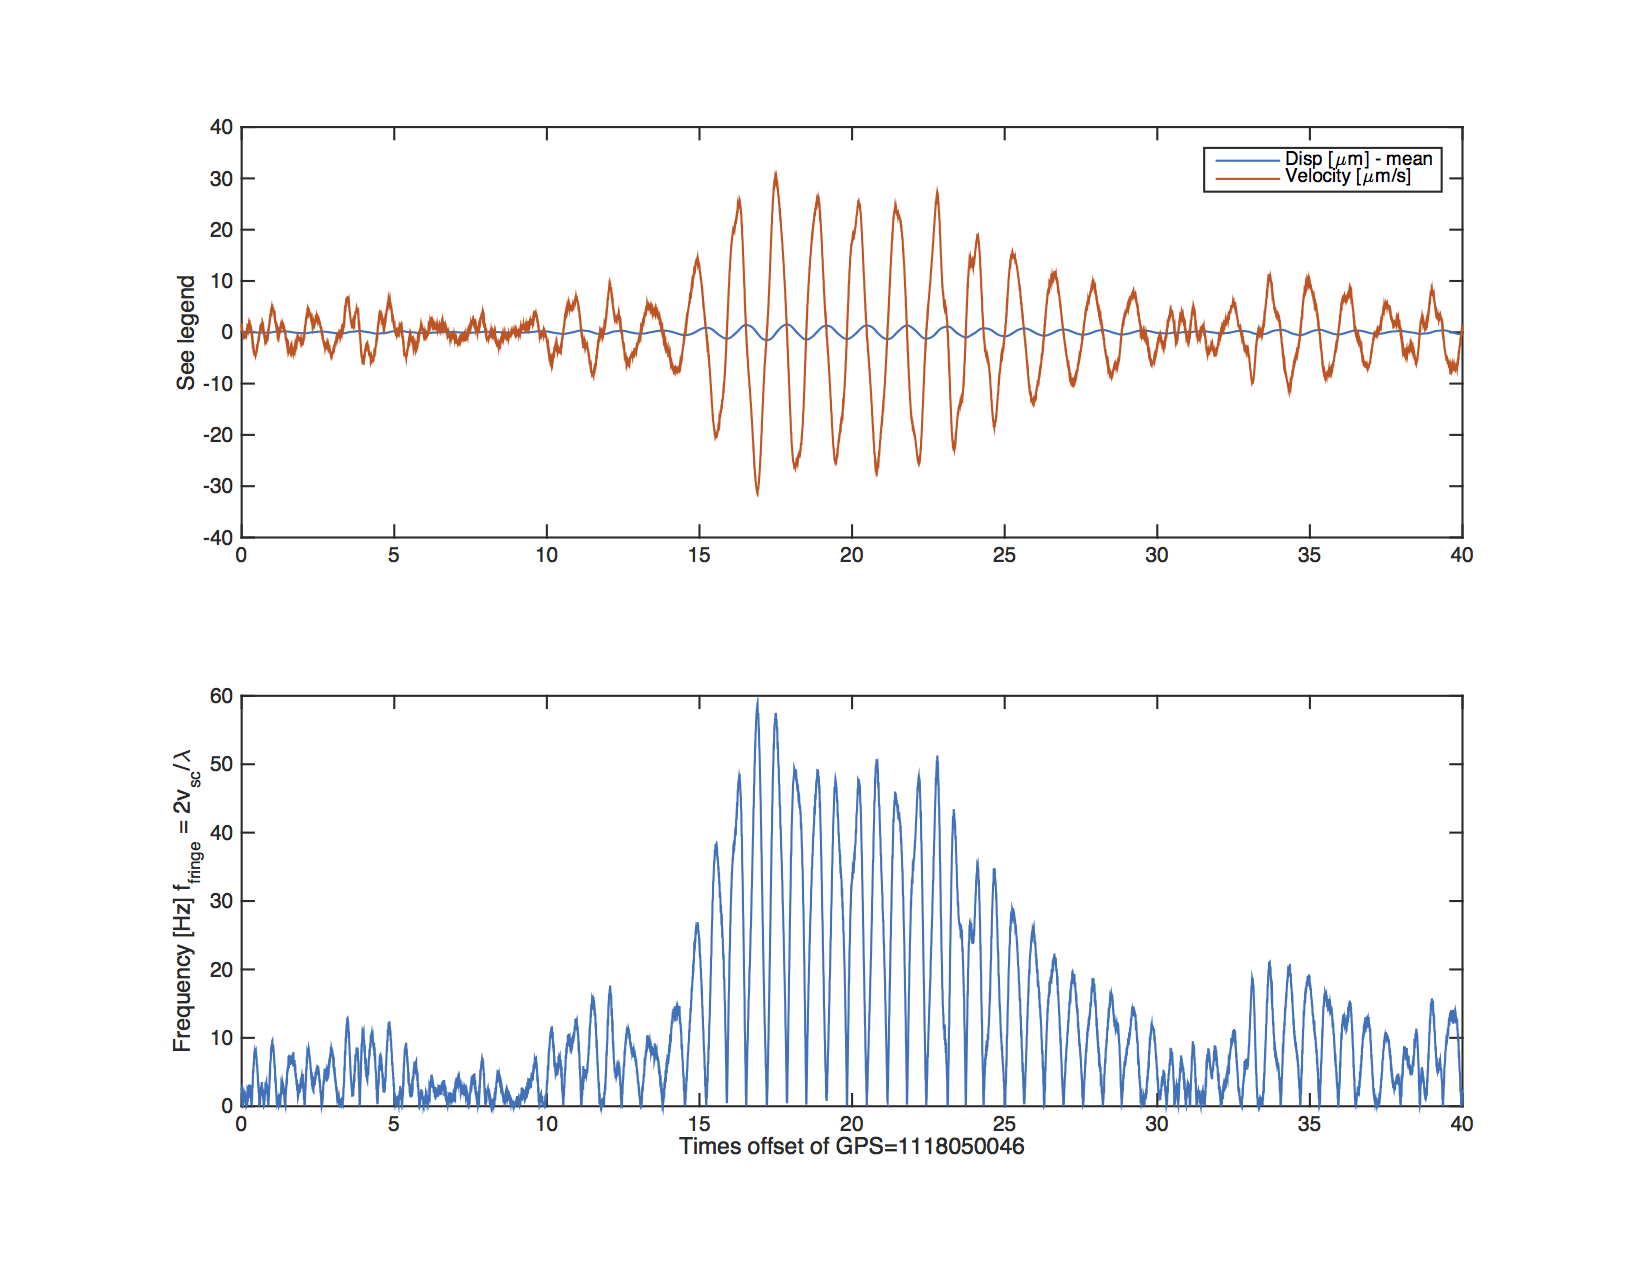
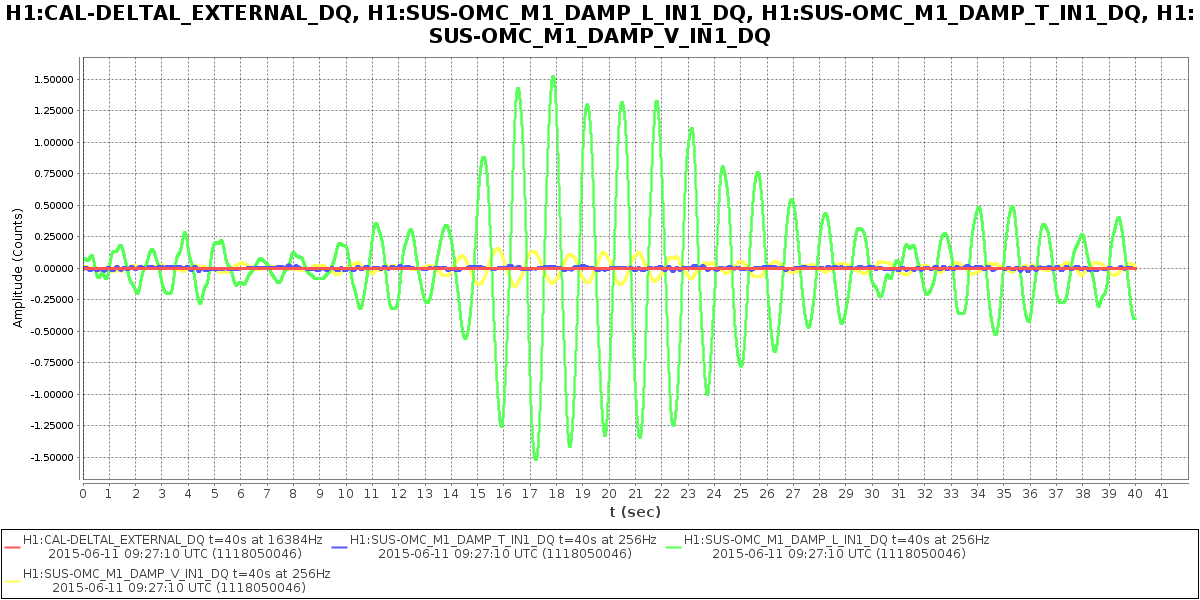
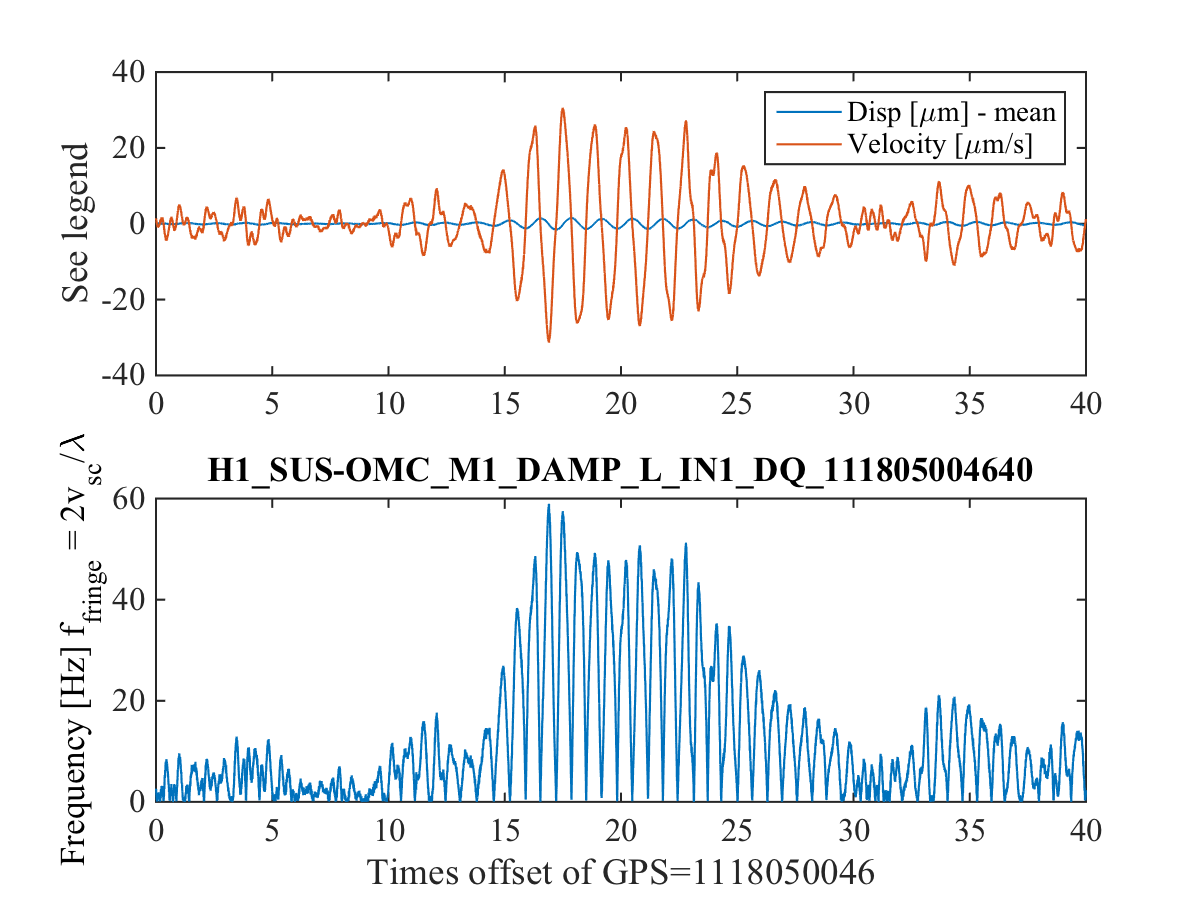
Dan Hoak gave us a clue on page 19067 and then Bas Swinkels ran Excavator and found that the channel H1:SUS-OMC_M1_DAMP_L_IN1_DQ had the highest correlation with the fringes. Andy Lundgren pointed me to equation 3 from “Noise from scattered light in Virgo's second science run data” which predicts the fringe frequency from a moving scatterer as f_fringe = 2*v_sc/lambda. Using the time from Dan and the channel from excavator and the fringe prediction, I wrote the attached m-file. Fig 1 shows the motion, velocity, and predicted frequency from OMC M1 longitudinal. Figure 2 shows the predicted frequency overlayed with the fringes in DELTAL. Math works.
PS. Thanks to Jeff and the SUS team for calibrating these channels and letting me know they are in um. Thanks to Gabriele for pointing out an error in an earlier draft of the derivative calculation.

Remember -- HAM6 is a mess of coordinate systems from 7 teams of people all using their own naming conventions. Check out G1300086 for a translation between them.

The message: this OMC Suspension's channel, which are the LF and RT OSEMs on the top mass (M1) of the double suspension (where the OMC breadboard is the bottom mass), converted to "L" (for longitudinal, or "along the beam direction", where the origin is defined at the horizontal and vertical centers of mass of M1), is parallel with the beam axis (the Z axis in the cavity waist basis) as it goes into the OMC breadboard.
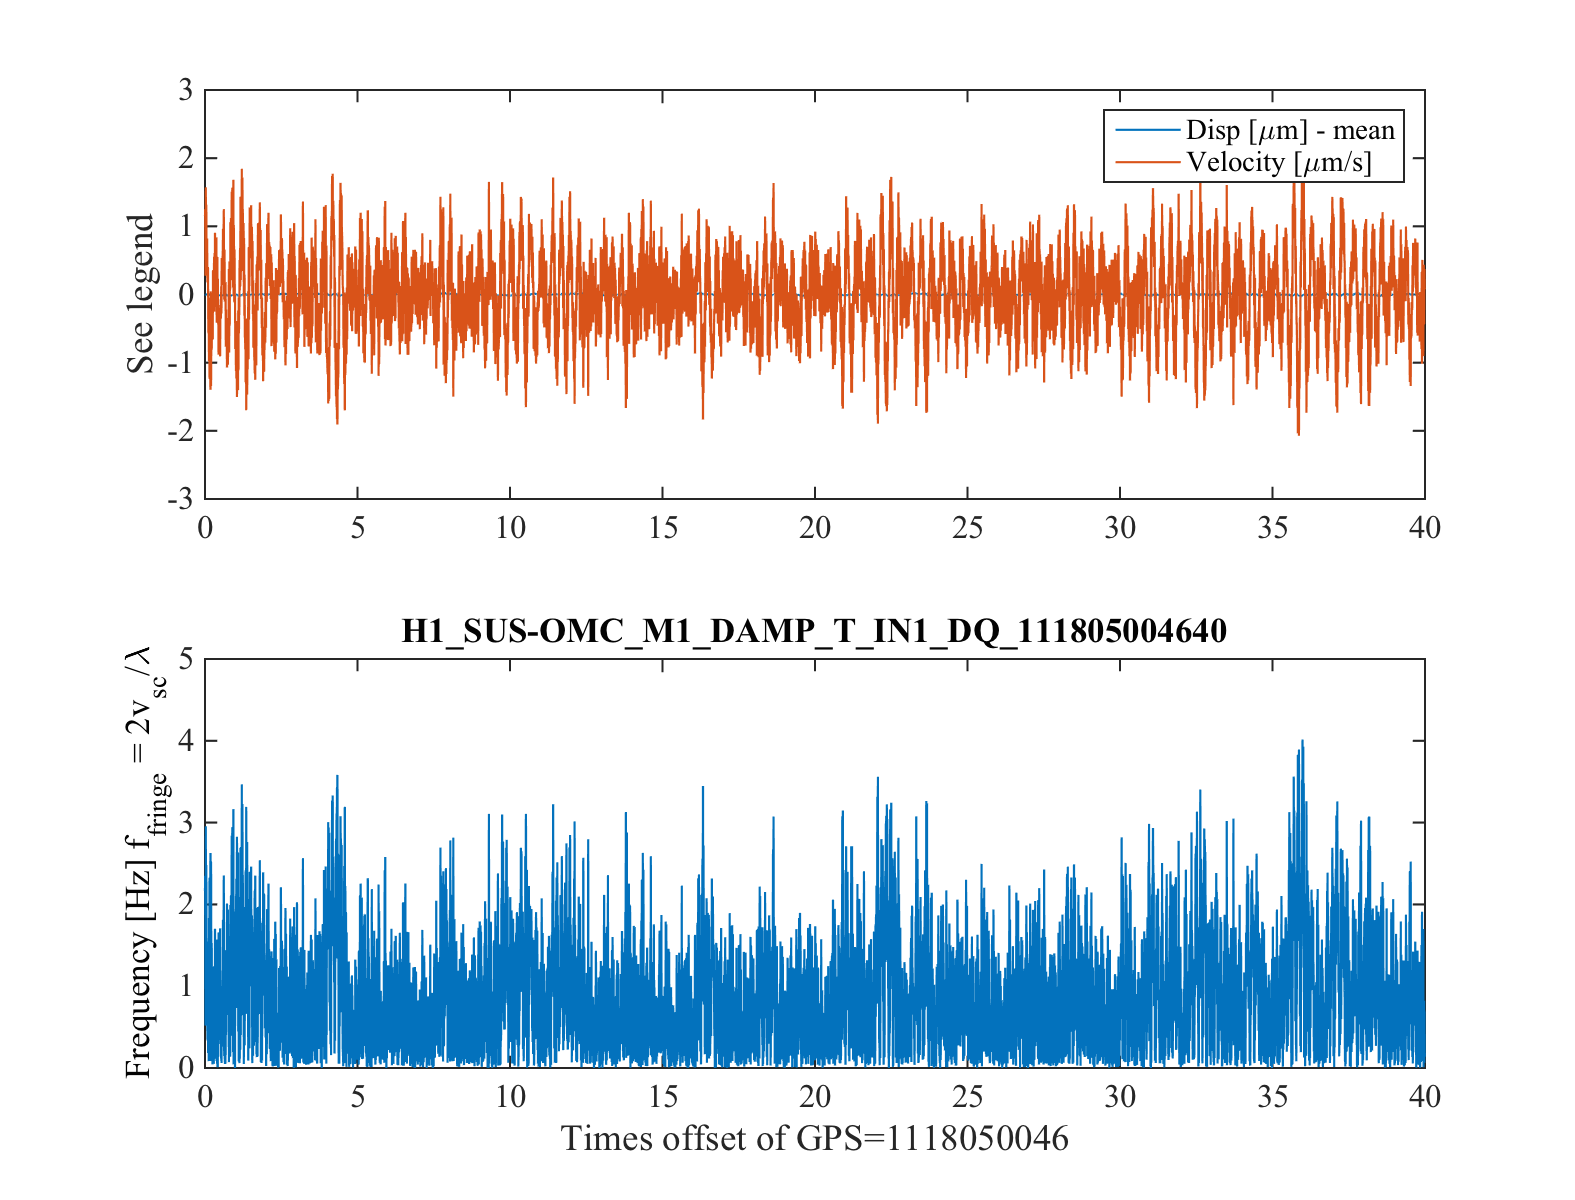
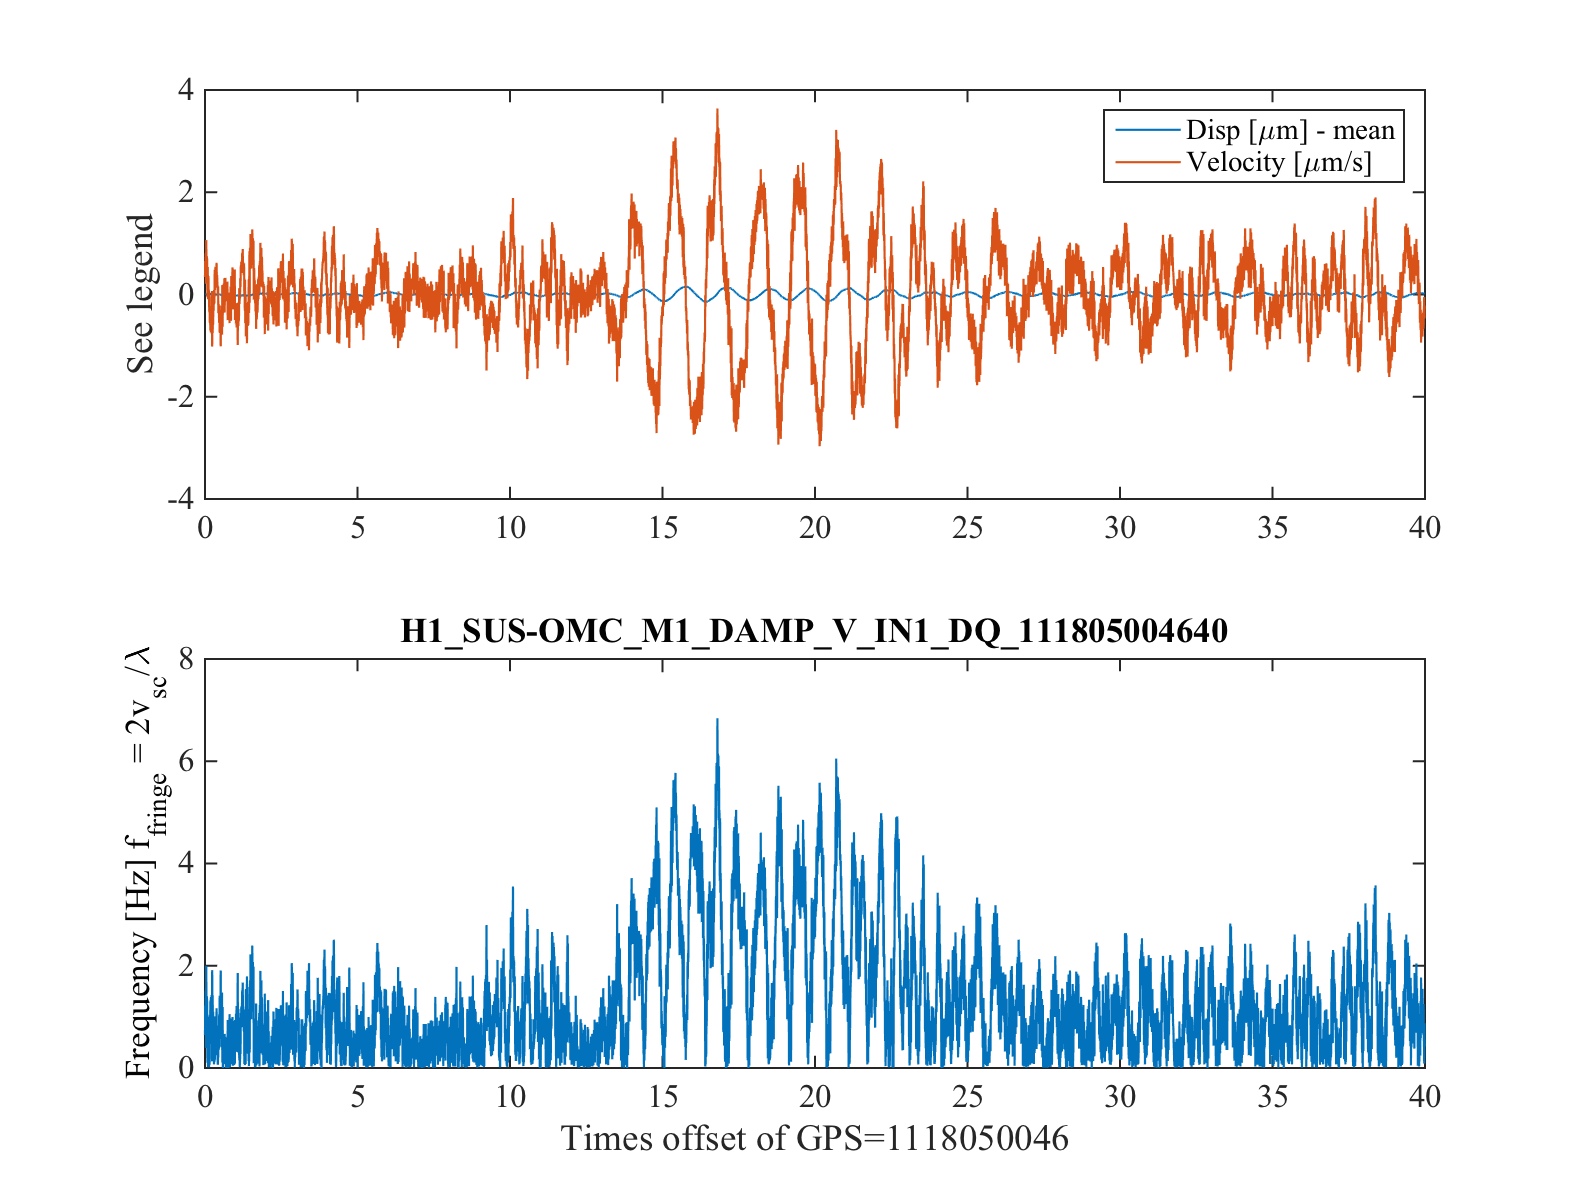
Jeff, thanks very much for that orientation; that diagram is extremely useful. The data leads me to think the scattering is dominated by the L degree of freedom though. Here's why - In raw motion, T and V only get a quarter of a micron or so peak-peak, while L is passing through 2 microns peak-peak during this time (see figure 1, y axis is microns). Figures 2, 3, and 4 are predicted fringes from L, T, and V. L is moving enough microns per second to get up to ~50Hz, whereas T and V only reach a few Hz. I'd be happy to follow up further.
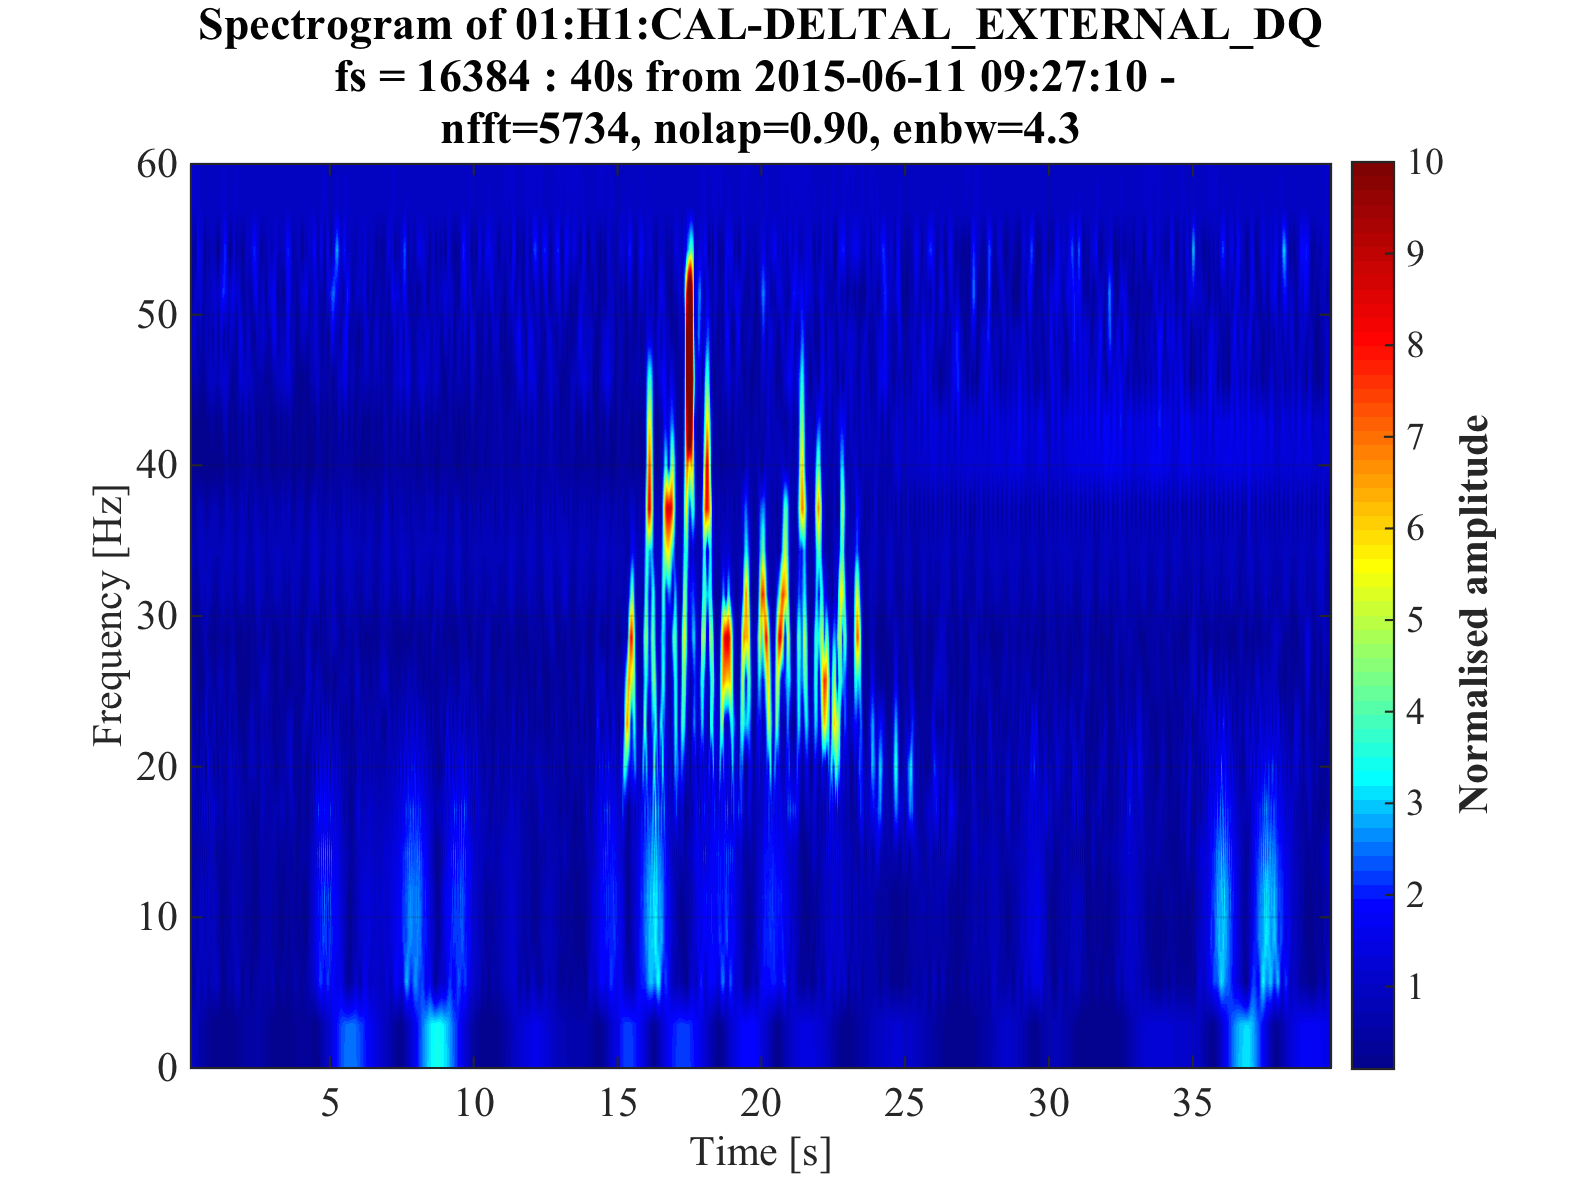
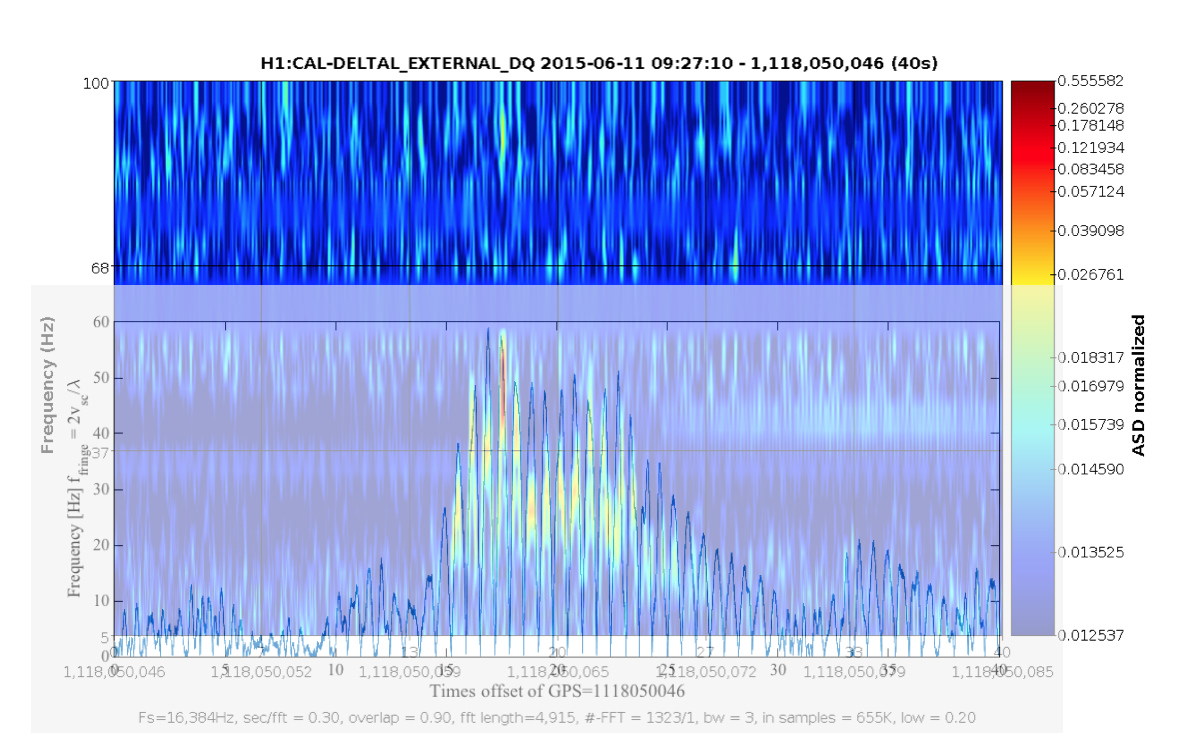
Peter F asked for a better overlay of the spectrogram and predicted fringe Frequency. Attached 1) raw normalized spectrogram (ligoDV), 2) with fringe frequency overlay from original post above, 3) same but b/w high contrast and zoomed.
Also, I wanted to link a few earlier results on OMC backscattering: 17919, 17264, 17910, 17904, 17273. DetChar is now looking into some sort of monitor for this, so we can say how often it happens. Also, Dan has asked us if we can also measure reflectivity from the scattering fringes. We'll try.