There were eight separate locks during this shift, with typical inspiral ranges of 60 - 70 Mpc. Total observation time was 28.2 hours, with the longest continuous stretch 06:15 - 20:00 UTC on June 11. Lock losses were typically deliberate or due to maintenance activities.
The following features were investigated:
1 – Very loud (SNR > 200) glitches
Omicron picks up roughly 5-10 of these per day, coinciding with drops in range to 10 - 30 Mpc. They were not caught by Hveto and appear to all have a common origin due to their characteristic OmegaScan appearance and PCAT classification. Peak frequencies vary typically between 100 - 300 Hz (some up to 1 kHz), but two lines at 183.5 and 225.34 Hz are particularly strong. These glitches were previously thought to be due to beam tube cleaning, and this is supported by the coincidence of cleaning activities and glitches on June 11 at 16:30 UTC. However, they are also occurring in the middle of the night, when there should be no beam cleaning going on. Tentative conclusion: they all have a common origin that is somehow exacerbated by the cleaning team's activities.
2 – Quasi-periodic 60 Hz glitch every 75 min
Omicron picks up an SNR ~ 20 - 30 glitch at 60Hz which seems to happen periodically every 70 - 80 min. Hveto finds that SUS-ETMY_L2_WIT_L_DQ is an extremely efficient (use percentage 80-100%) veto, and that SUS-ETMY_L2_WIT_P_DQ and PEM-EY-MAG-EBAY-SEIRACK-X_DQ are also correlated. This effect is discussed in an alog post from June 6 (link): "the end-Y magnetometers witness EM glitches once every 75 minutes VERY strongly and that these couple into DARM". Due to their regular appearance, it should be possible to predict a good time to visit EY to search for a cause. Robert Schofield is investigating.
3 – Non-stationary noise at 20 - 30Hz
This is visible as a cluster of SNR 10 - 30 glitches at 20 - 30 Hz, which became denser on June 11 and started showing up as short vertical lines in the spectrograms as well. The glitches are not caught by Hveto. Interestingly, they were absent completely from the first lock stretch on June 10, from 00:00 – 05:00 UTC. Daniel Hoak has concluded that this is scattering noise, likely from alignment drives sent to OMC suspension, and plans to reduce the OMC alignment gain by a factor of two to stop this (link to alog).
4 – Broadband spectrogram lines at 310 and 340 Hz
A pair of lines at 310 and 340 Hz are visible in the normalized spectrograms, strongest at the beginning of a lock and decaying over a timescale of ~1 hr as the locked interferometer settles into the nominal alignment state. According to Robert Schofield, these are resonances of the optic support on the PSL periscope. The coupling to DARM changes as the alignment drifts in time (peaks decay beacuse the alignment was tuned to minimize the peaks when the IFO is settled.) Alogs about this: link, link, link.
There are lines of Omicron triggers at these frequencies too, which interestingly are weakest when the spectrogram lines are strongest (probably due to a 'whitening' effect that washes them out when the surrounding noise rises). Robert suspects that the glitches are produced by variations in alignment of the interferometer (changes in coupling to the interferometer making the peaks suddenly bigger or smaller).
5 – Wandering 430 Hz line
Visible in the spectrograms as a thin and noisy line, seen to wander slightly in Fscan. It weakened over the course of the long (14h) lock on June 11. Origin unknown.
6 – h(t) calibration
Especially noisy throughout the shift, with the ASD ratio showing unusually high variance. May be related to odd broadband behavior visible in the spectrogram. Jeff Kissel and calibration group report that nothing changed in the GDS calibration at this time. Cause unknown.
Attached PDF shows some relevant plots.
More details can be found at the DQ shift wiki page.

I believe the 430 Hz wandering line is the same line Marissa found at 415 Hz (alog18796). Which turns out, as Gabriele observed, to show coherence with SRCL/PRCL.
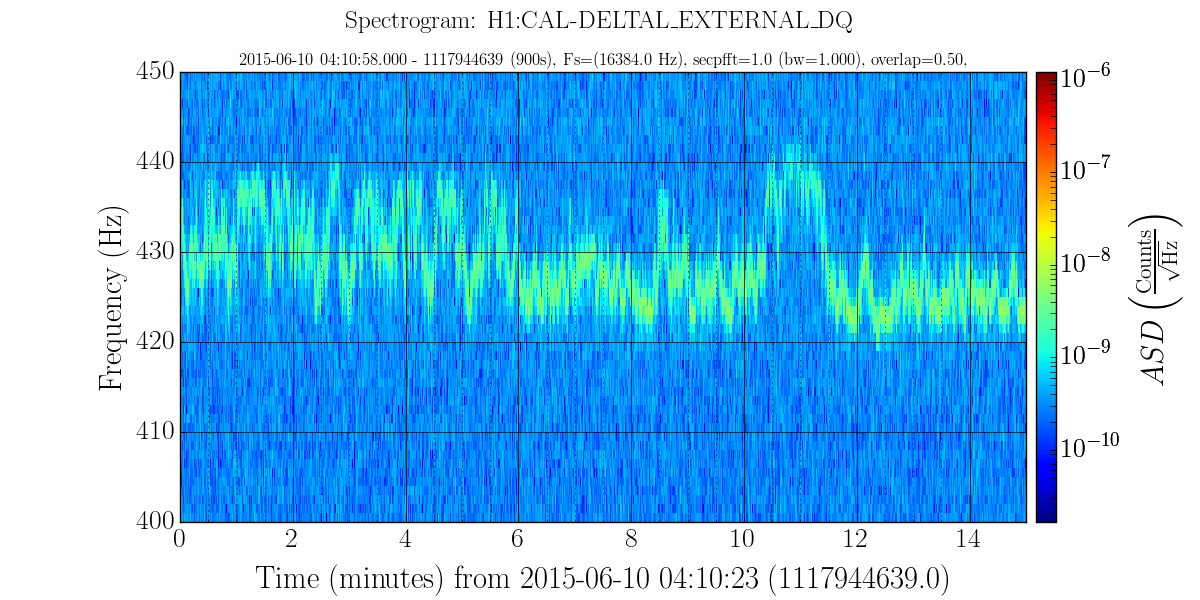
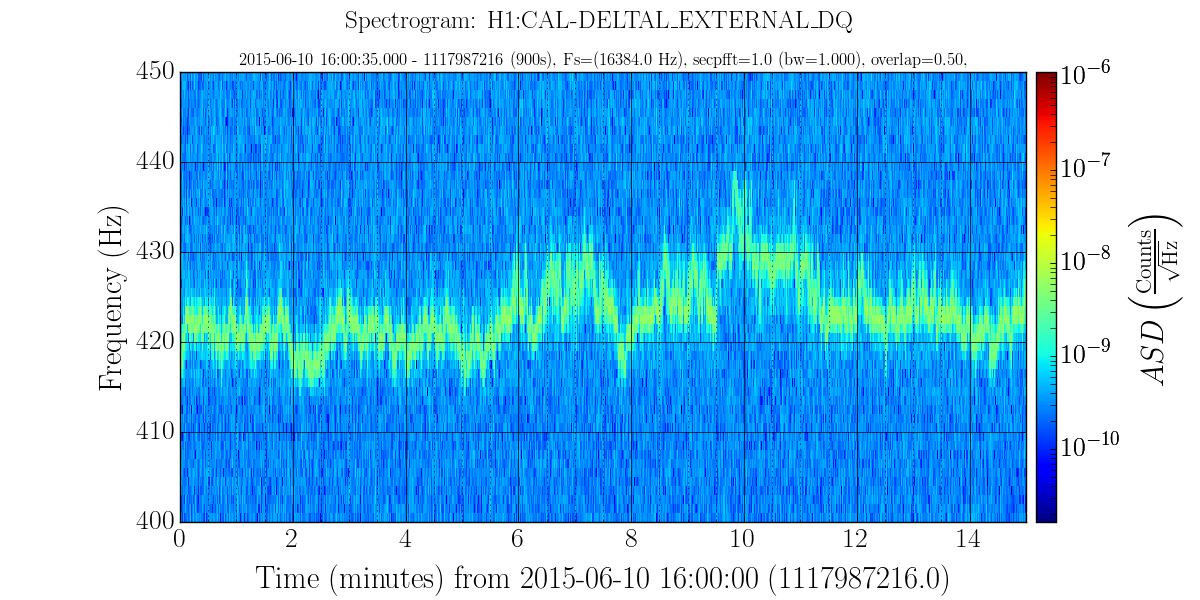
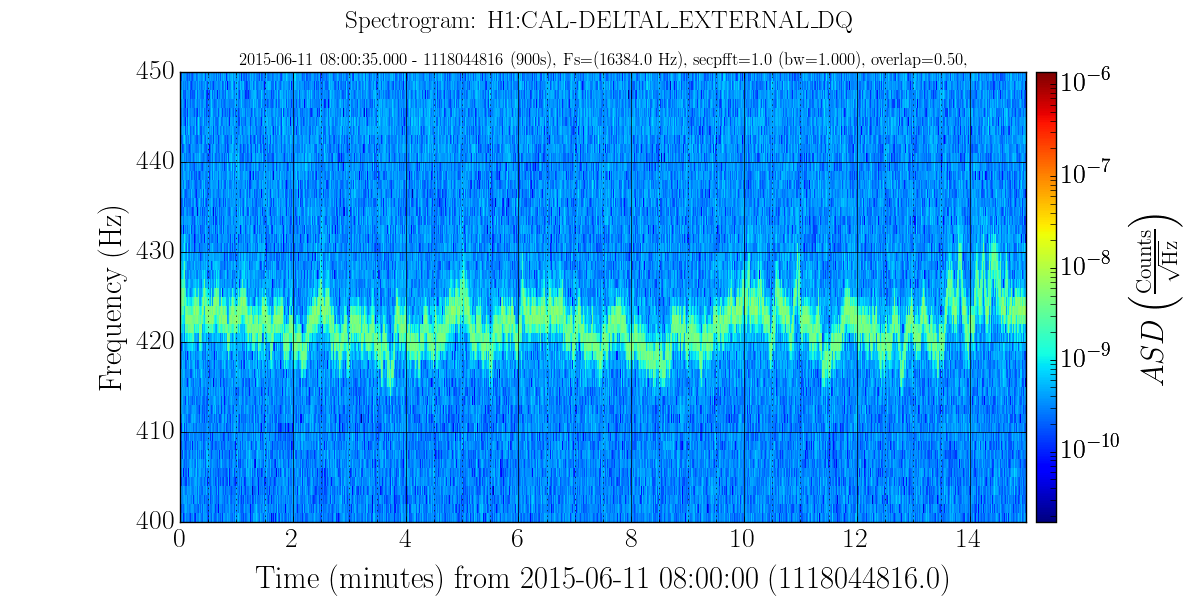
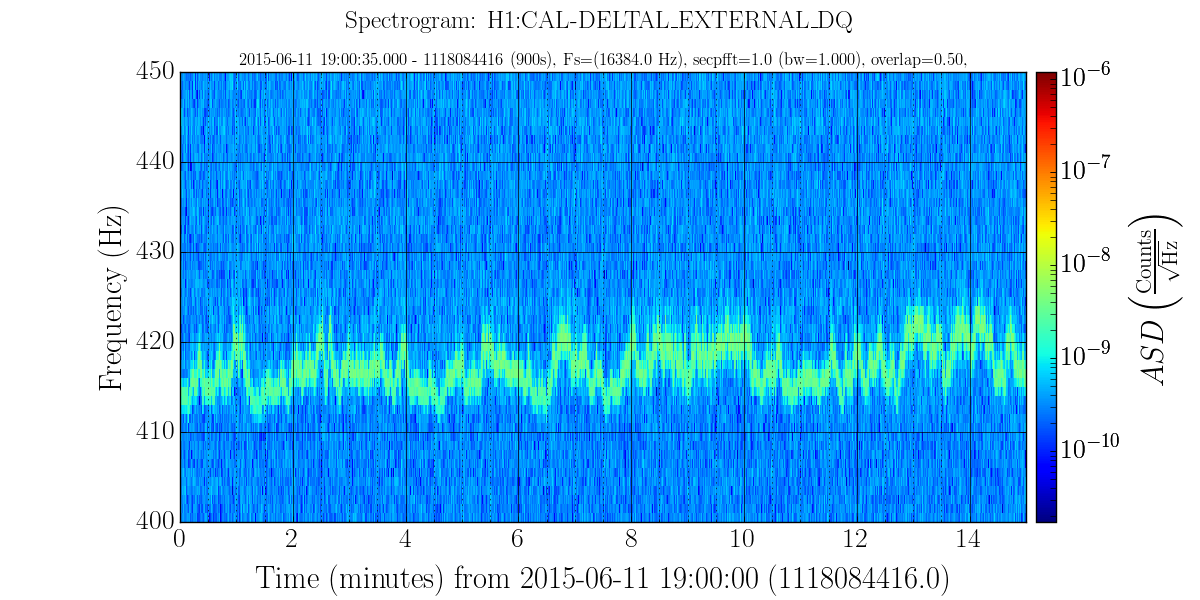
Ross Kennedy, my Ph.D. student, implemented tracking of this line over 800 seconds using the iWave line tracker. Overlaid with a spectrogram, you can see that there is quite good agreement as the frequency evolves. We're working on automating this tool to avoid hand-tuning parameters of the line tracker. It would also be interesting to track both this line and PSL behaviour at the same time, to check for correlation.

In the attached document there are two spectrograms - in each case the black overlay is the frequency estimate from iWave.