Here I present some results from our first Pcal sweep measurement (alog 19128 and 19132) in 5-5000 Hz frequency range.
The main conclusions are:
- Pcal showed an OK agreement in terms of a DARM optical response with our model (i.e. the one used for generating GDS and CAL-CS).
-
Roughly speaking, Pcal agreed with our model with descrepancy of 20 % level in magnitude above 10 Hz.
- Pcal X seemed to have a larger systematic of 20-ish% in the overall scale factor. Not sure why. Needs to repeat the measurement.
- Pcal Y agrees with the model with several % at one time.
- The measured phase agree with the model within +/- 10 deg uncertainty below 1 kHz.
-
Another sweep measurement on a different lock stretch showed a 20 % reduction in the optical gain.
- presumably due to a different DARM offset and maybe different alignment (see alog 19014).
-
For some reason, the measured magnitude descreases as it goes to lower frequencies below 10 Hz.
- This somehow does not change the phase. I don't understand.
-----
This time, our traget was the sensing function or the DARM optical plant in counts/meters. To access the sensing function, we essentially need two different measurements i.e. a TF from ETM displacement to DARM_IN1 [cnts/meters] and DARM loop suppression [cnts/cnts]. Jeff took an open-loop TF and Pcal sweep for each arm, but unfortunately the Y arm measurement did not complete (alog 19128). Approximately 8 hours later of Jeff's measurements, TJ managed to measure a sweep of Pcal Y and DARM suppression TFs (alog 19132). So in total we have three different Pcal sweep data sets as follows,
- Pcal X sweep (13/6/2015 23:40:53 UTC)
- Pcal Y sweep (13/6/2015 23:56:21 UTC)
- Pcal Y sweep (14/6/2015 07:03:59 UTC)
The first two measurements were from a same lock stretch, and the last from a different lock stretch. All the measurement were made with a PSL requested power of 17 W. The plots below show the main results:
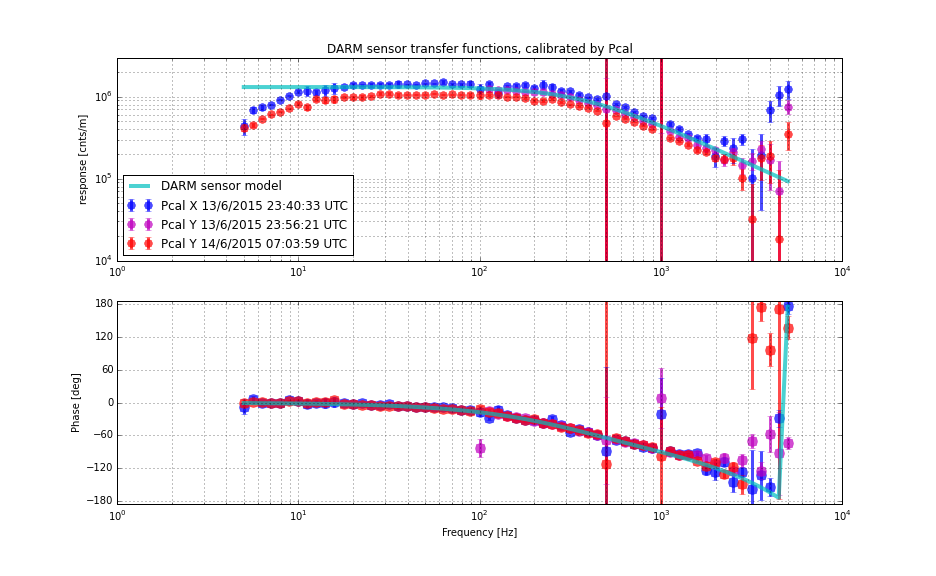
The first plot shows the estimated sensing functions from all three sweep measurements. As seen in the plot, signal-to-noise ratio becomes significantly low above a few kHz. Also as the sweep goes across the fundamental and the second harmonic of the violine modes, the coherence dropped and hence a low signal-to-noise ratio. The cyan solid curve represents the model that we have used for generating GDS and CAL-CS where the DC gain is set to 1.311x-6 cnts/meters and a cavity pole frequency to 355 Hz. Additionally, I set a delay time of the model to 55 usec by eye-ball fitting without any good explanation.
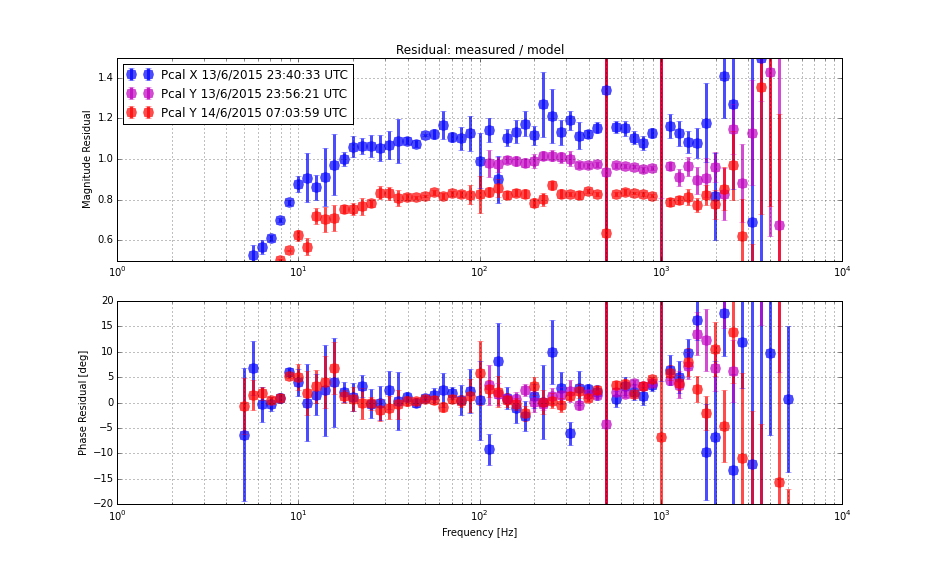
The second plot shows the residual between the measrured and model transfer functions. Even though the first two measurements were from the same lock stretch, they differed by approximately 20 % from each other. I am not sure what caused the descrepancy, but it is clear that the descrepancy is mostly in the scaling factor. The last measurement, which was from a different lock stretch showed a lower optical gain by 20 %. We know that our LSC automation can cause such a variation in the optical gain (alog 19014). So I believe that this 20% reduction is real and not due to some calibration in Pcal. Also the first and third measurements showed significant drop in the magnitude below 10 Hz by more than 50 %. Since the phase does not seem to roatte below 10 Hz, this is not a simple zero-pole argument. Looking at the Pcal active intensity stablization servos, Darkhan and I cofirmed that there was no saturation when the low frequencies were measured (although Pcal Y seemed to have saturated at the beginning of the measurement, meaning higher frequencies). We have no idea.
The analysis code, measurements and figures can be found in:
- aligocalibration/trunk/Runs/ER7/H1/Scripts/PCAL_TRENDS/2015-06-13_optgain_estimation.ipynb
- aligocalibration/trunk/Runs/ER7/H1/Results/PCAL_TRENDS/ *png
- aligocalibration/trunk/Runs/ER7/H1/Measurements/PCAL_TRENDS/ * txt