I used Sheila's matlab script to plot PR3 Pitch as a function of IFO power.
The plots are from 12 days of data ending June 14th at 17:45UTC. This includes locks at 17W and 24W.
Locked = 'in lock, high power'
Data are locks with input power between 17W and 18W, or locks at 24W or more.
Unlocked = 'low power, locked or unlocked'
Data are from input power less that 3W.
PR3 Pitch position is unchanged locked vs unlocked at 3W.
I removed other data points as transitional power states.
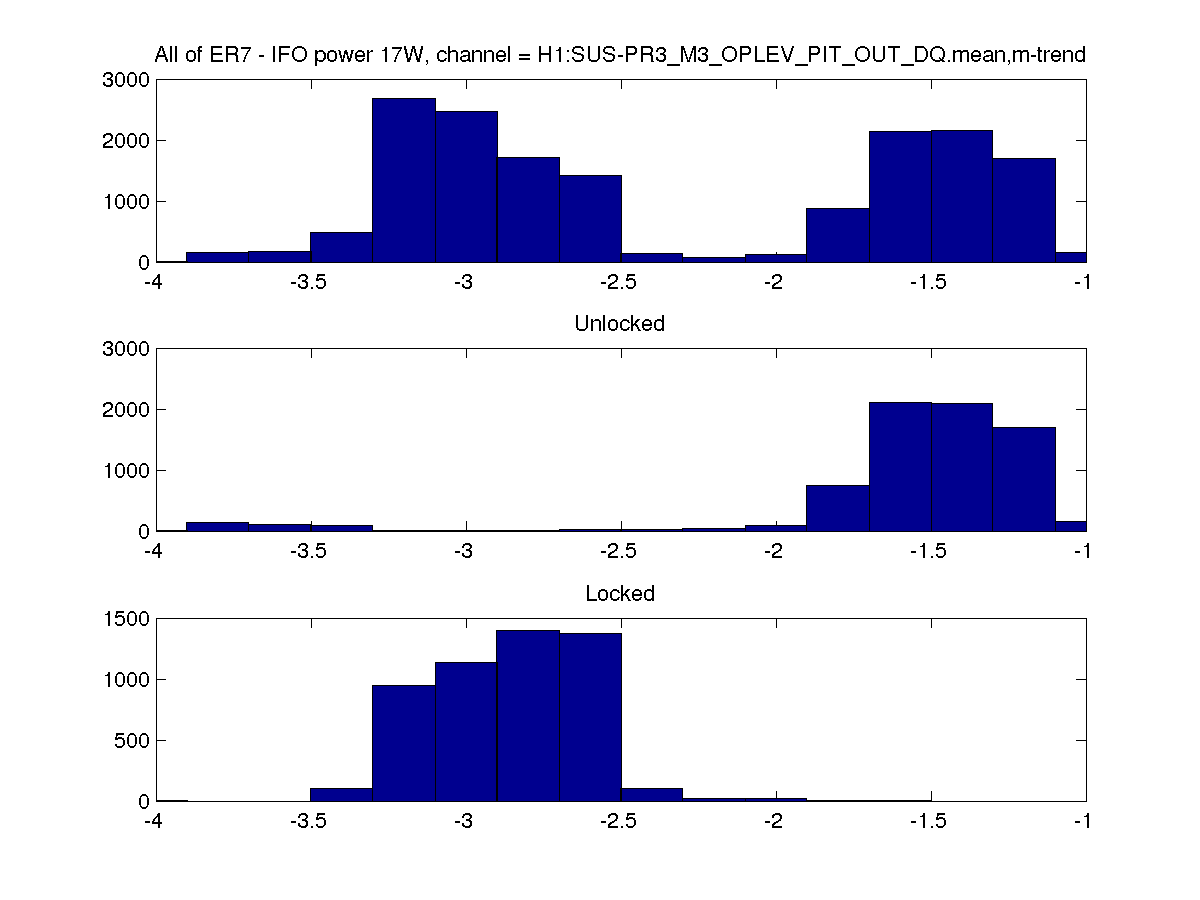
First plot: PR3_PIT_IFO17W.png
Locked pitch position is distributed around -2.8urad.
Unlocked pitch position is distributed around -1.4urad.
Difference = -1.4urad
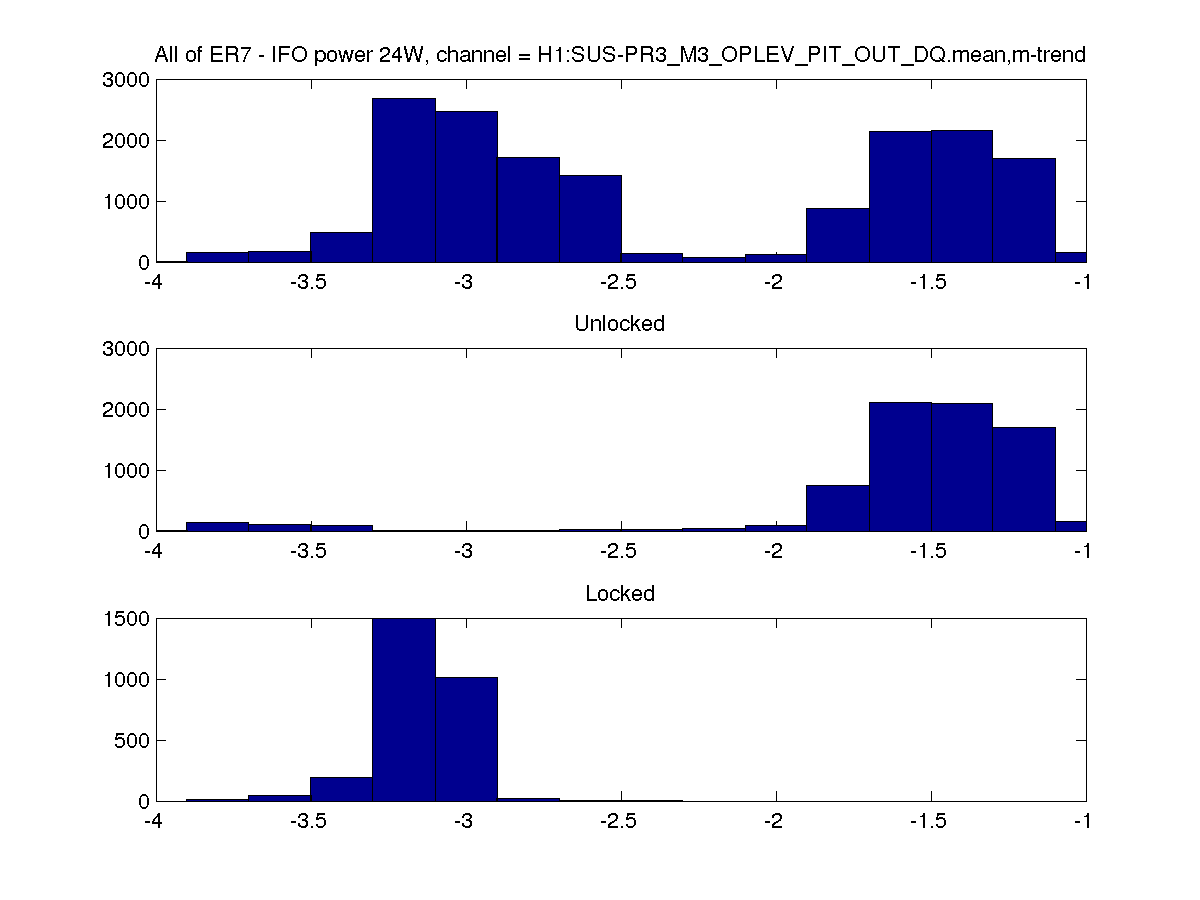
Second plot: PR3_PIT_IFO24W.png
Locked pitch position is distributed around -3.2urad.
Unlocked pitch position is distributed around -1.4urad.
Difference = -1.8urad
Summary:
| IFO power | pitch position | |
| PR3 pitch | 3W | -1.4urad |
| PR3 pitch | 17W | -2.8urad |
| PR2 ptich | 24W | -3.2urad |
The PR3 Pitch position in-lock is changing with the change IFO power.