leonid.prokhorov@LIGO.ORG - posted 13:11, Friday 10 July 2015 - last comment - 20:58, Friday 10 July 2015(19547)
OPLEV charge measurements; Data are beginning to be consistent with a small increase in charge, consistently negative
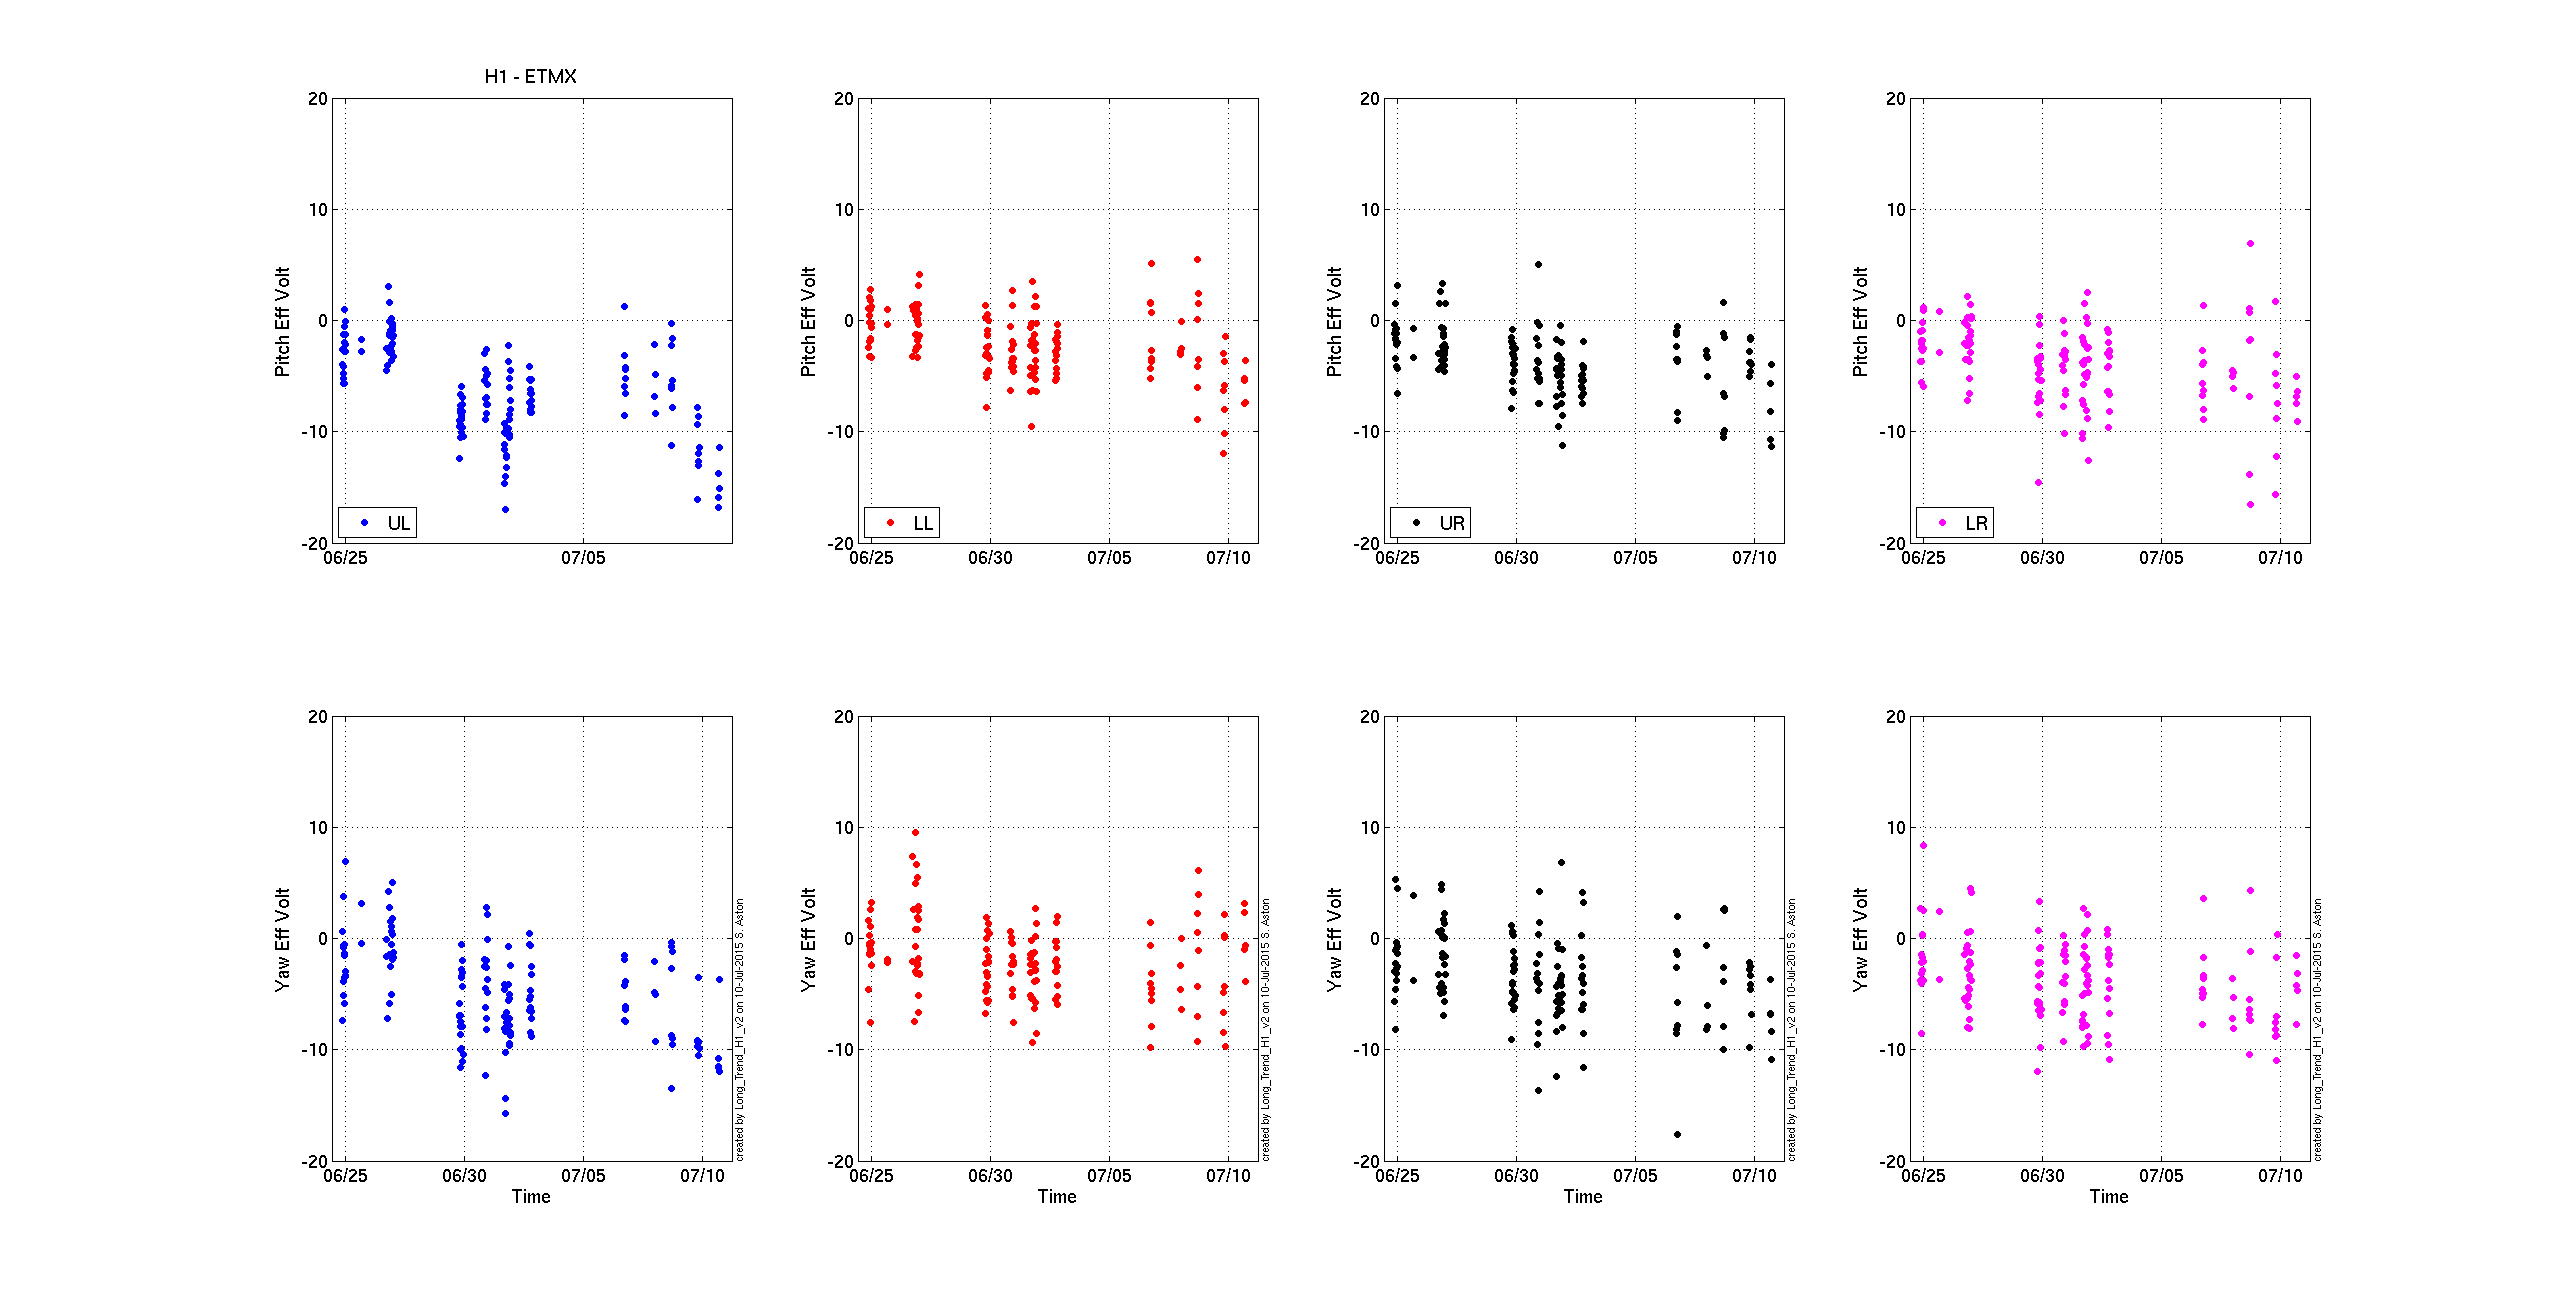
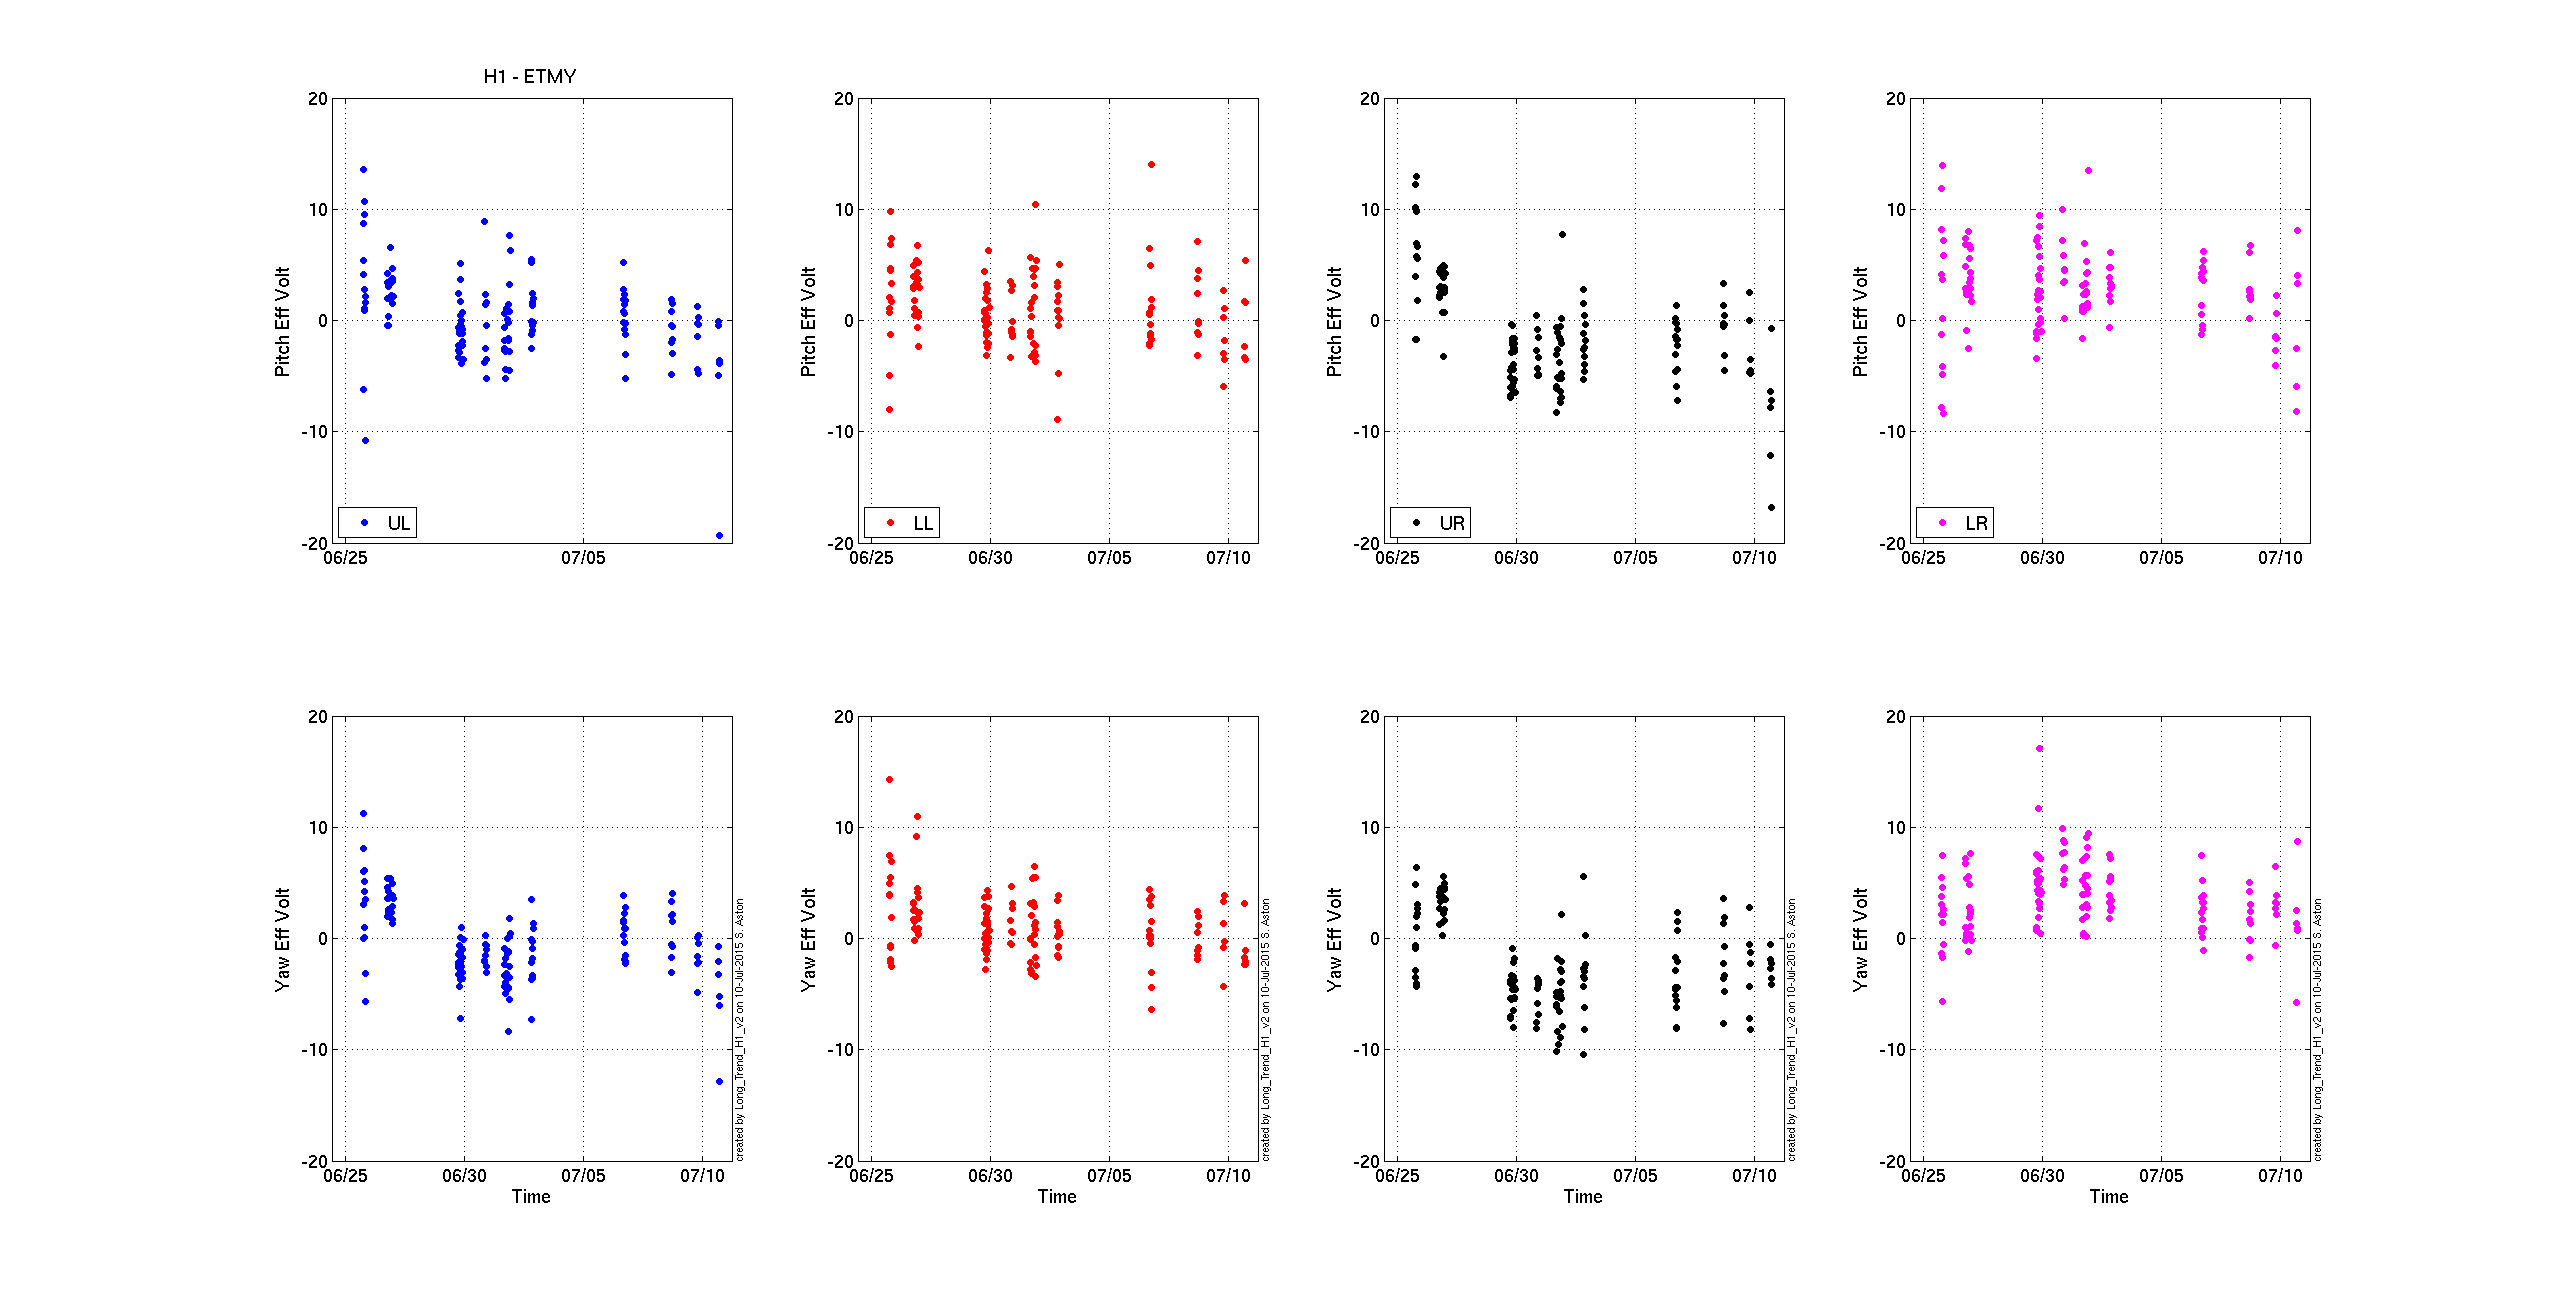
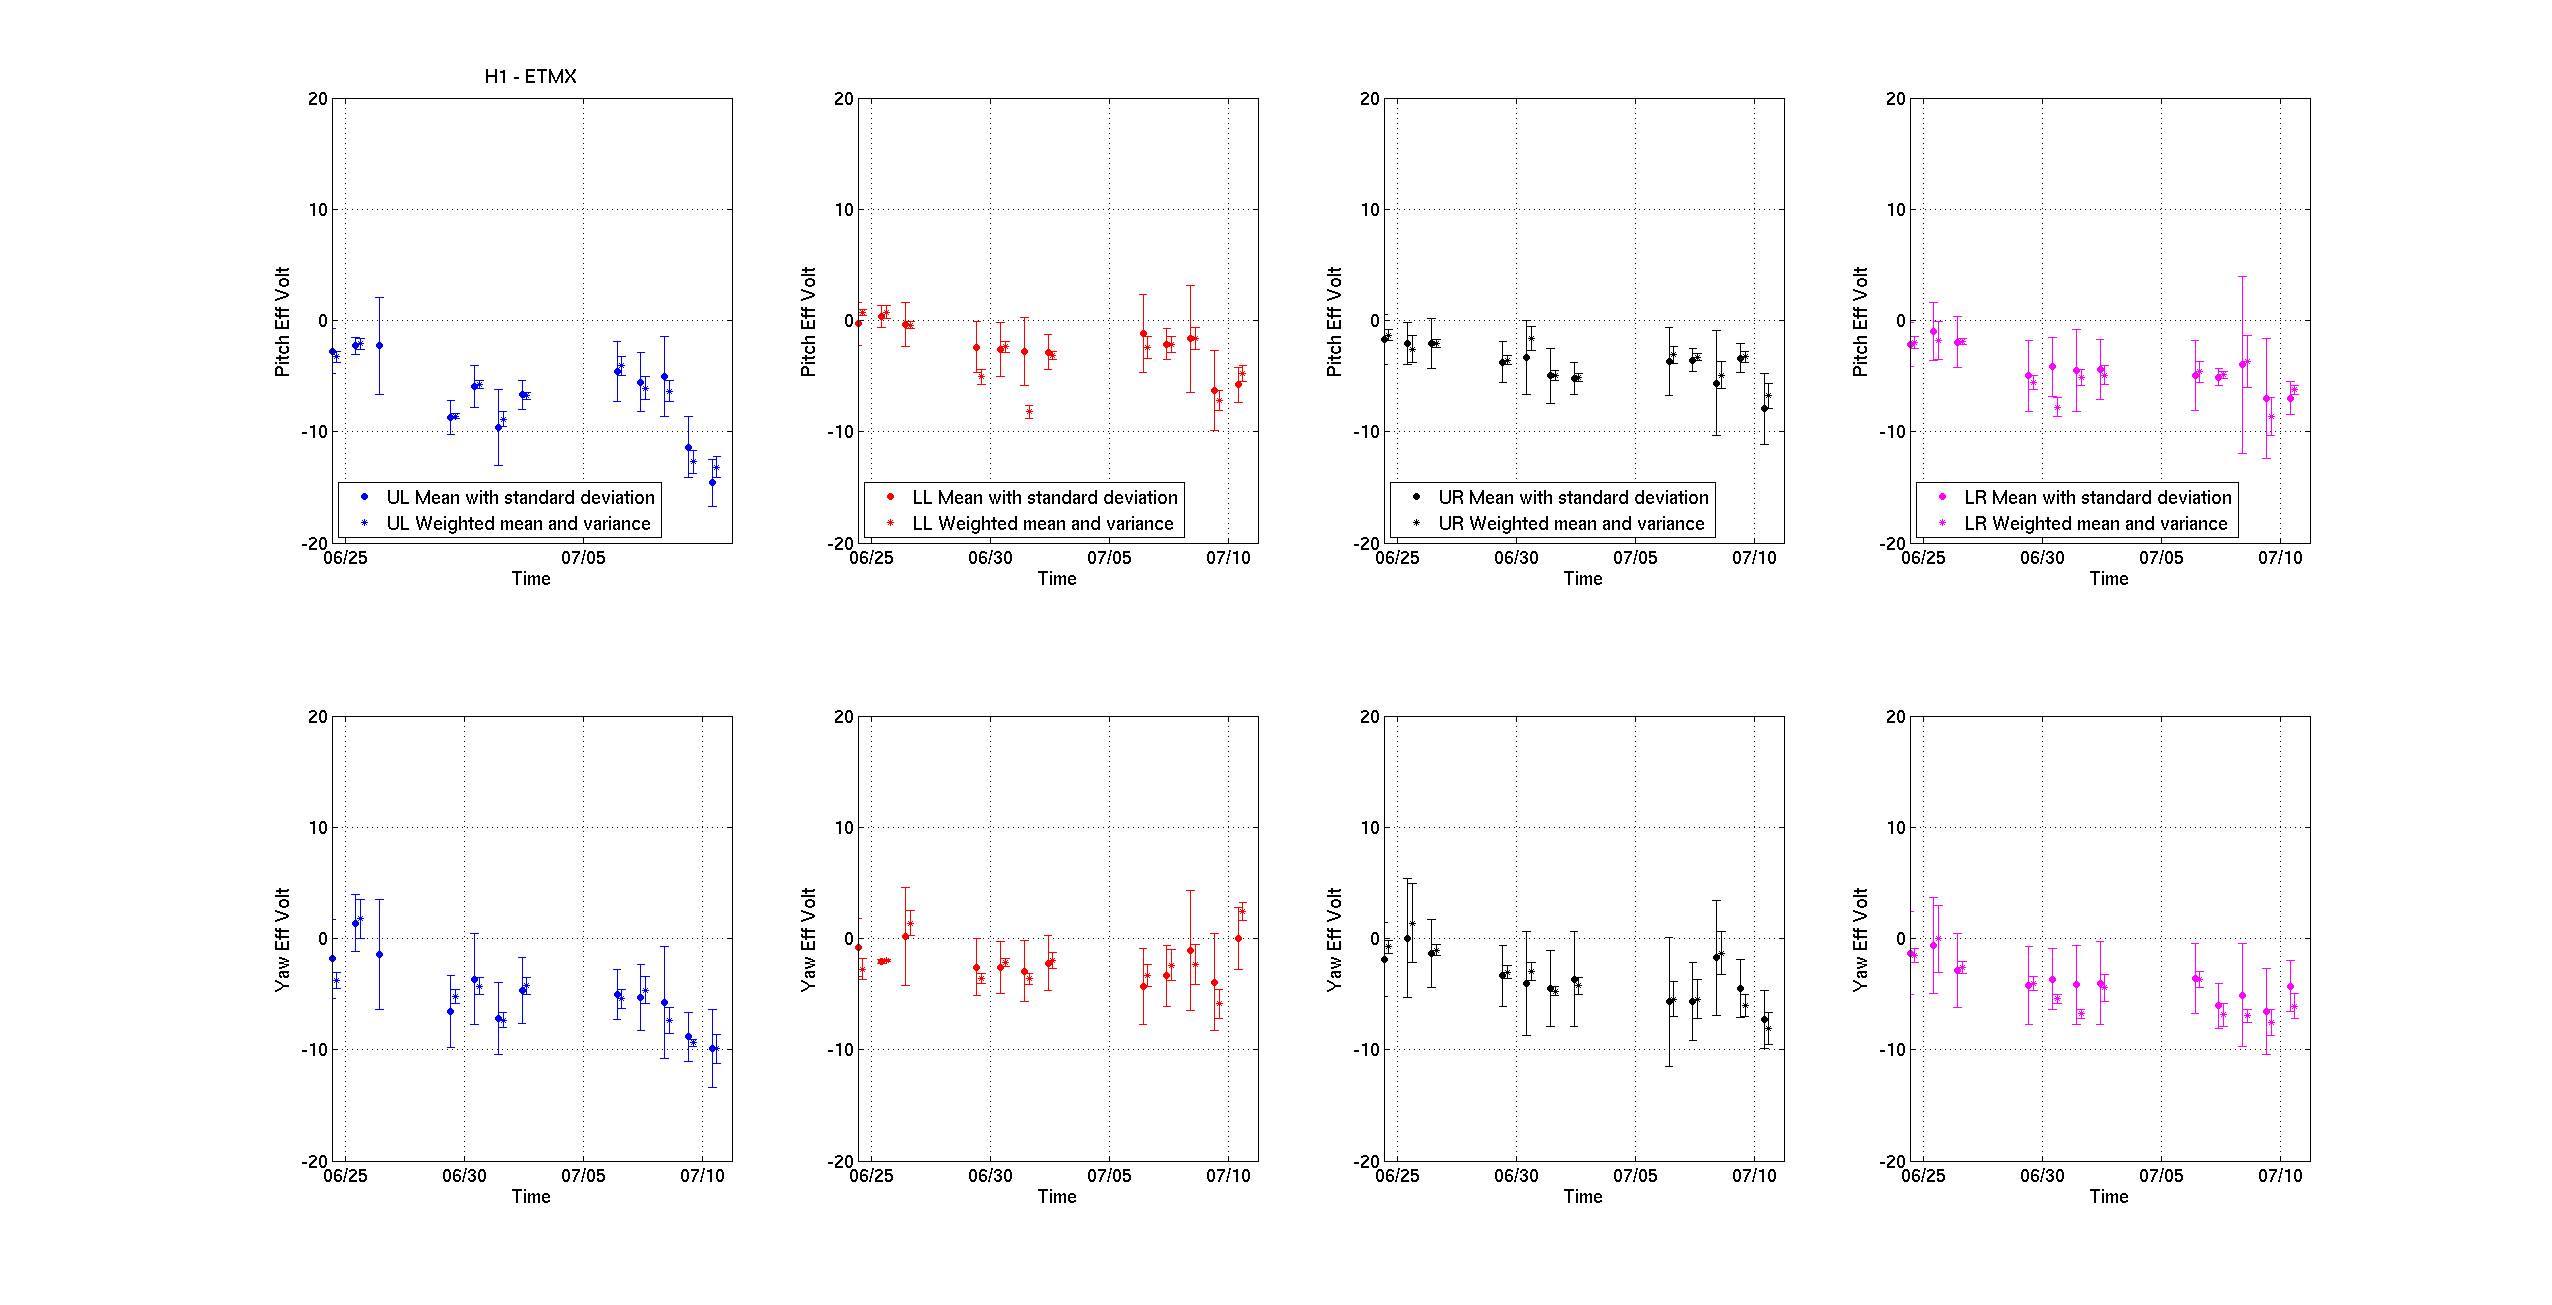
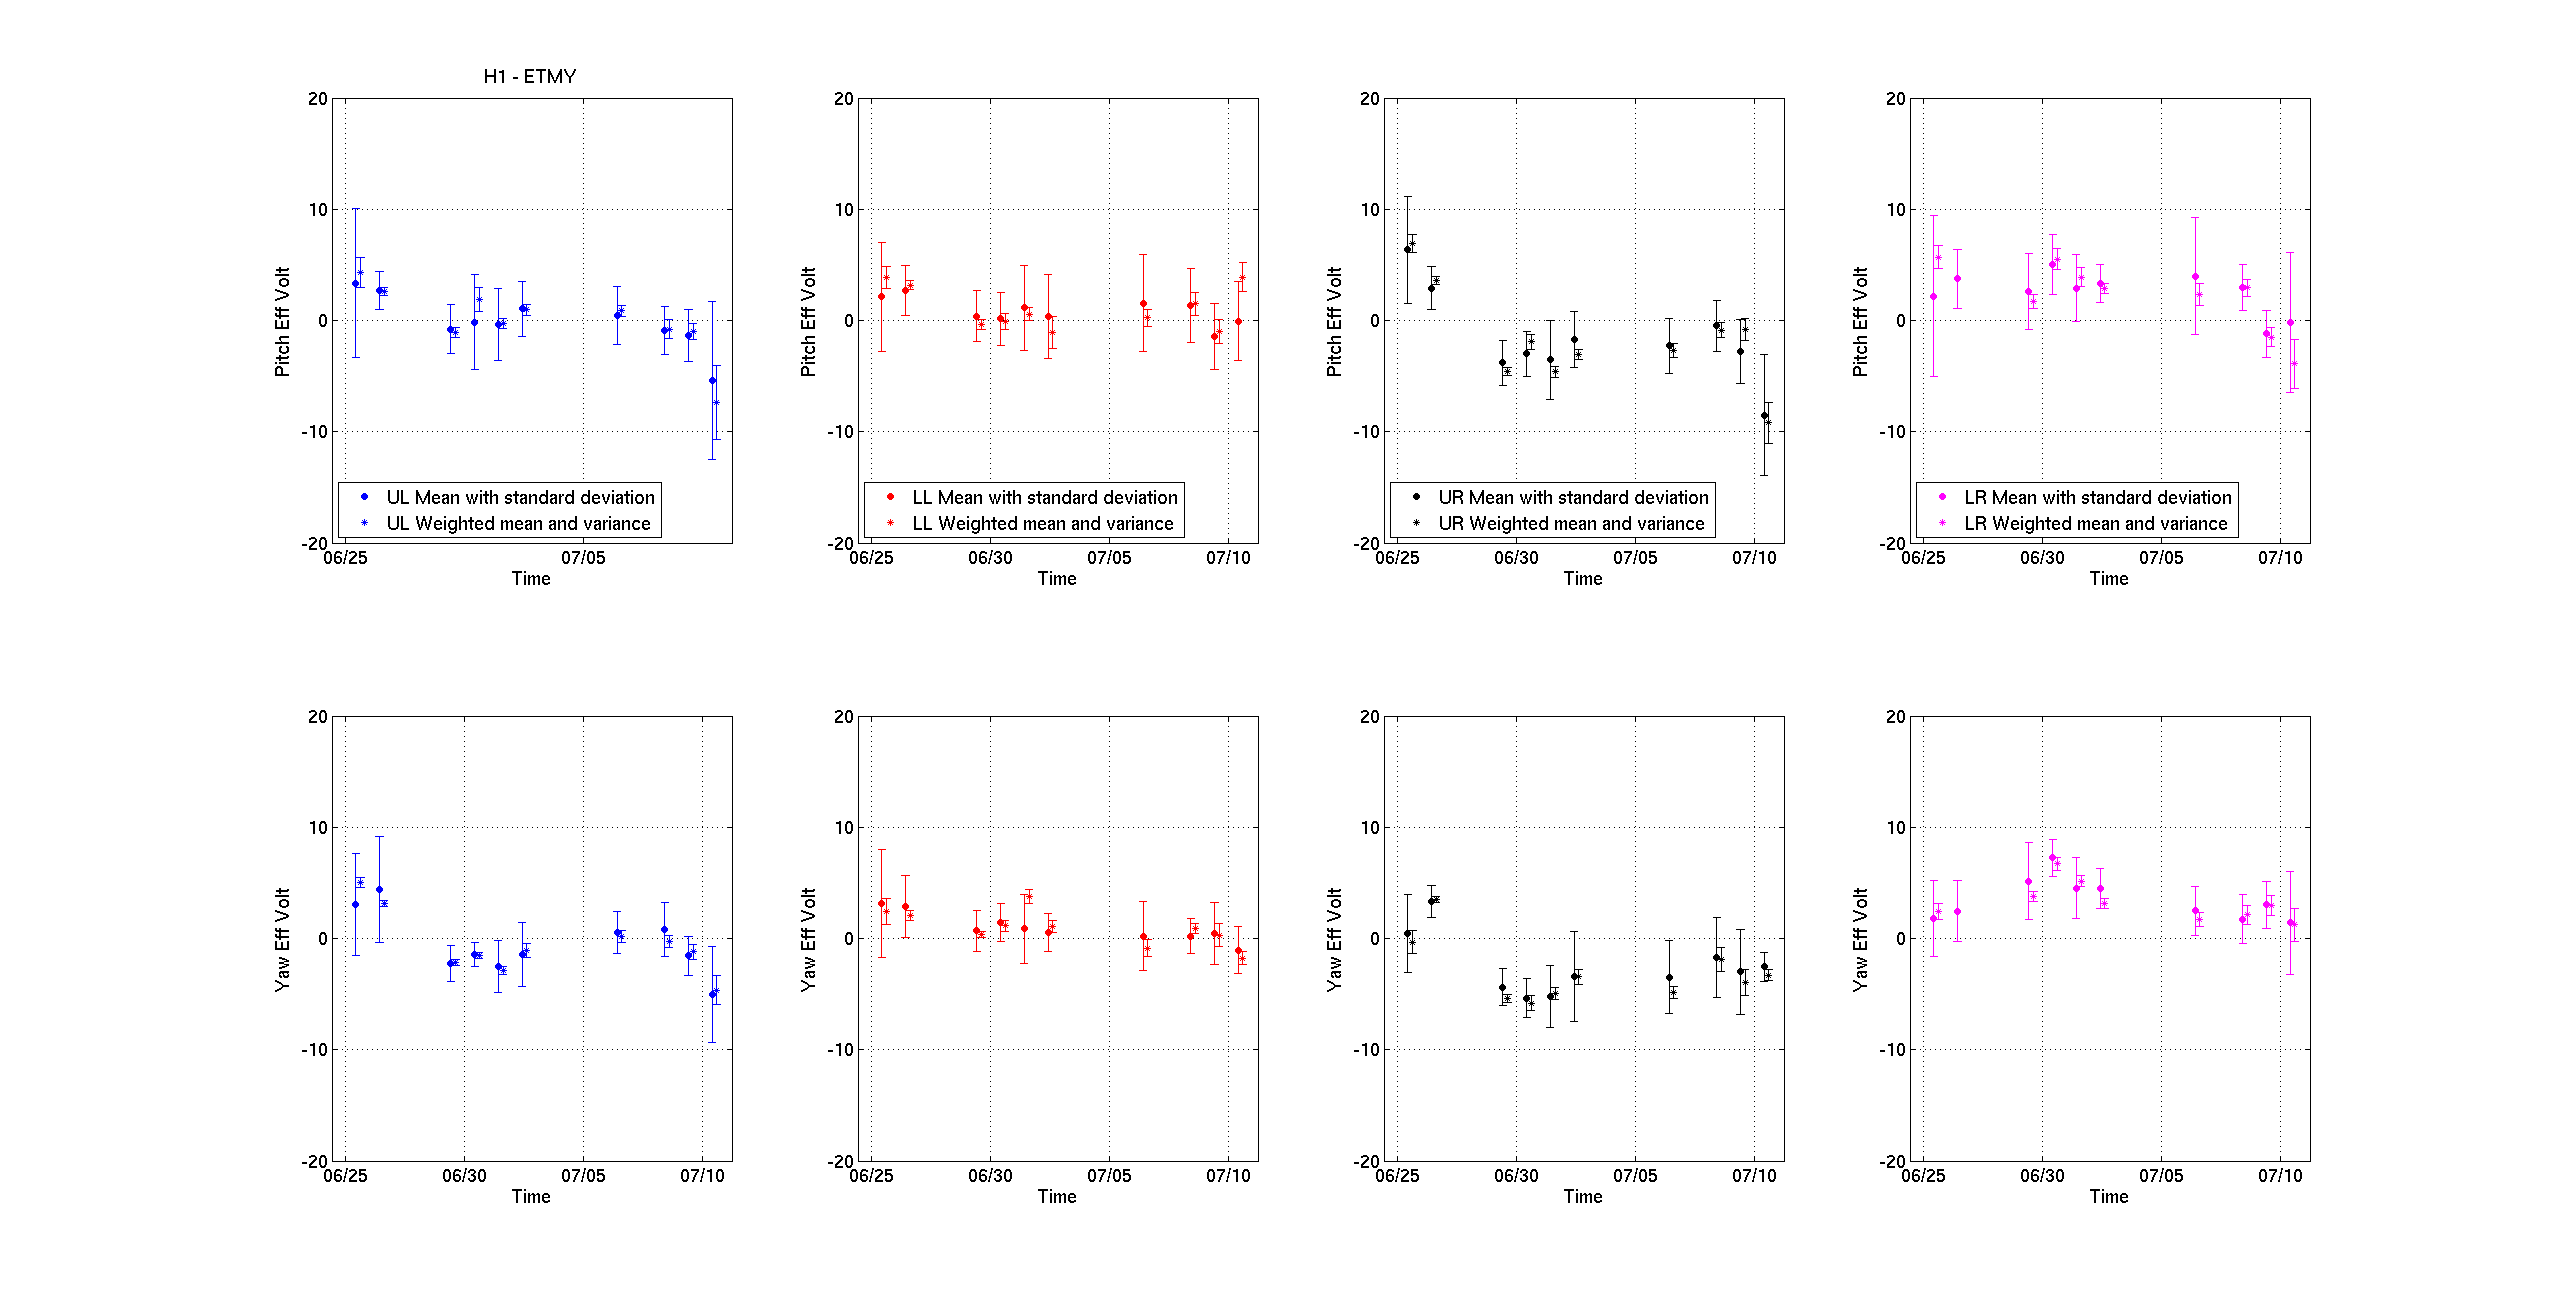
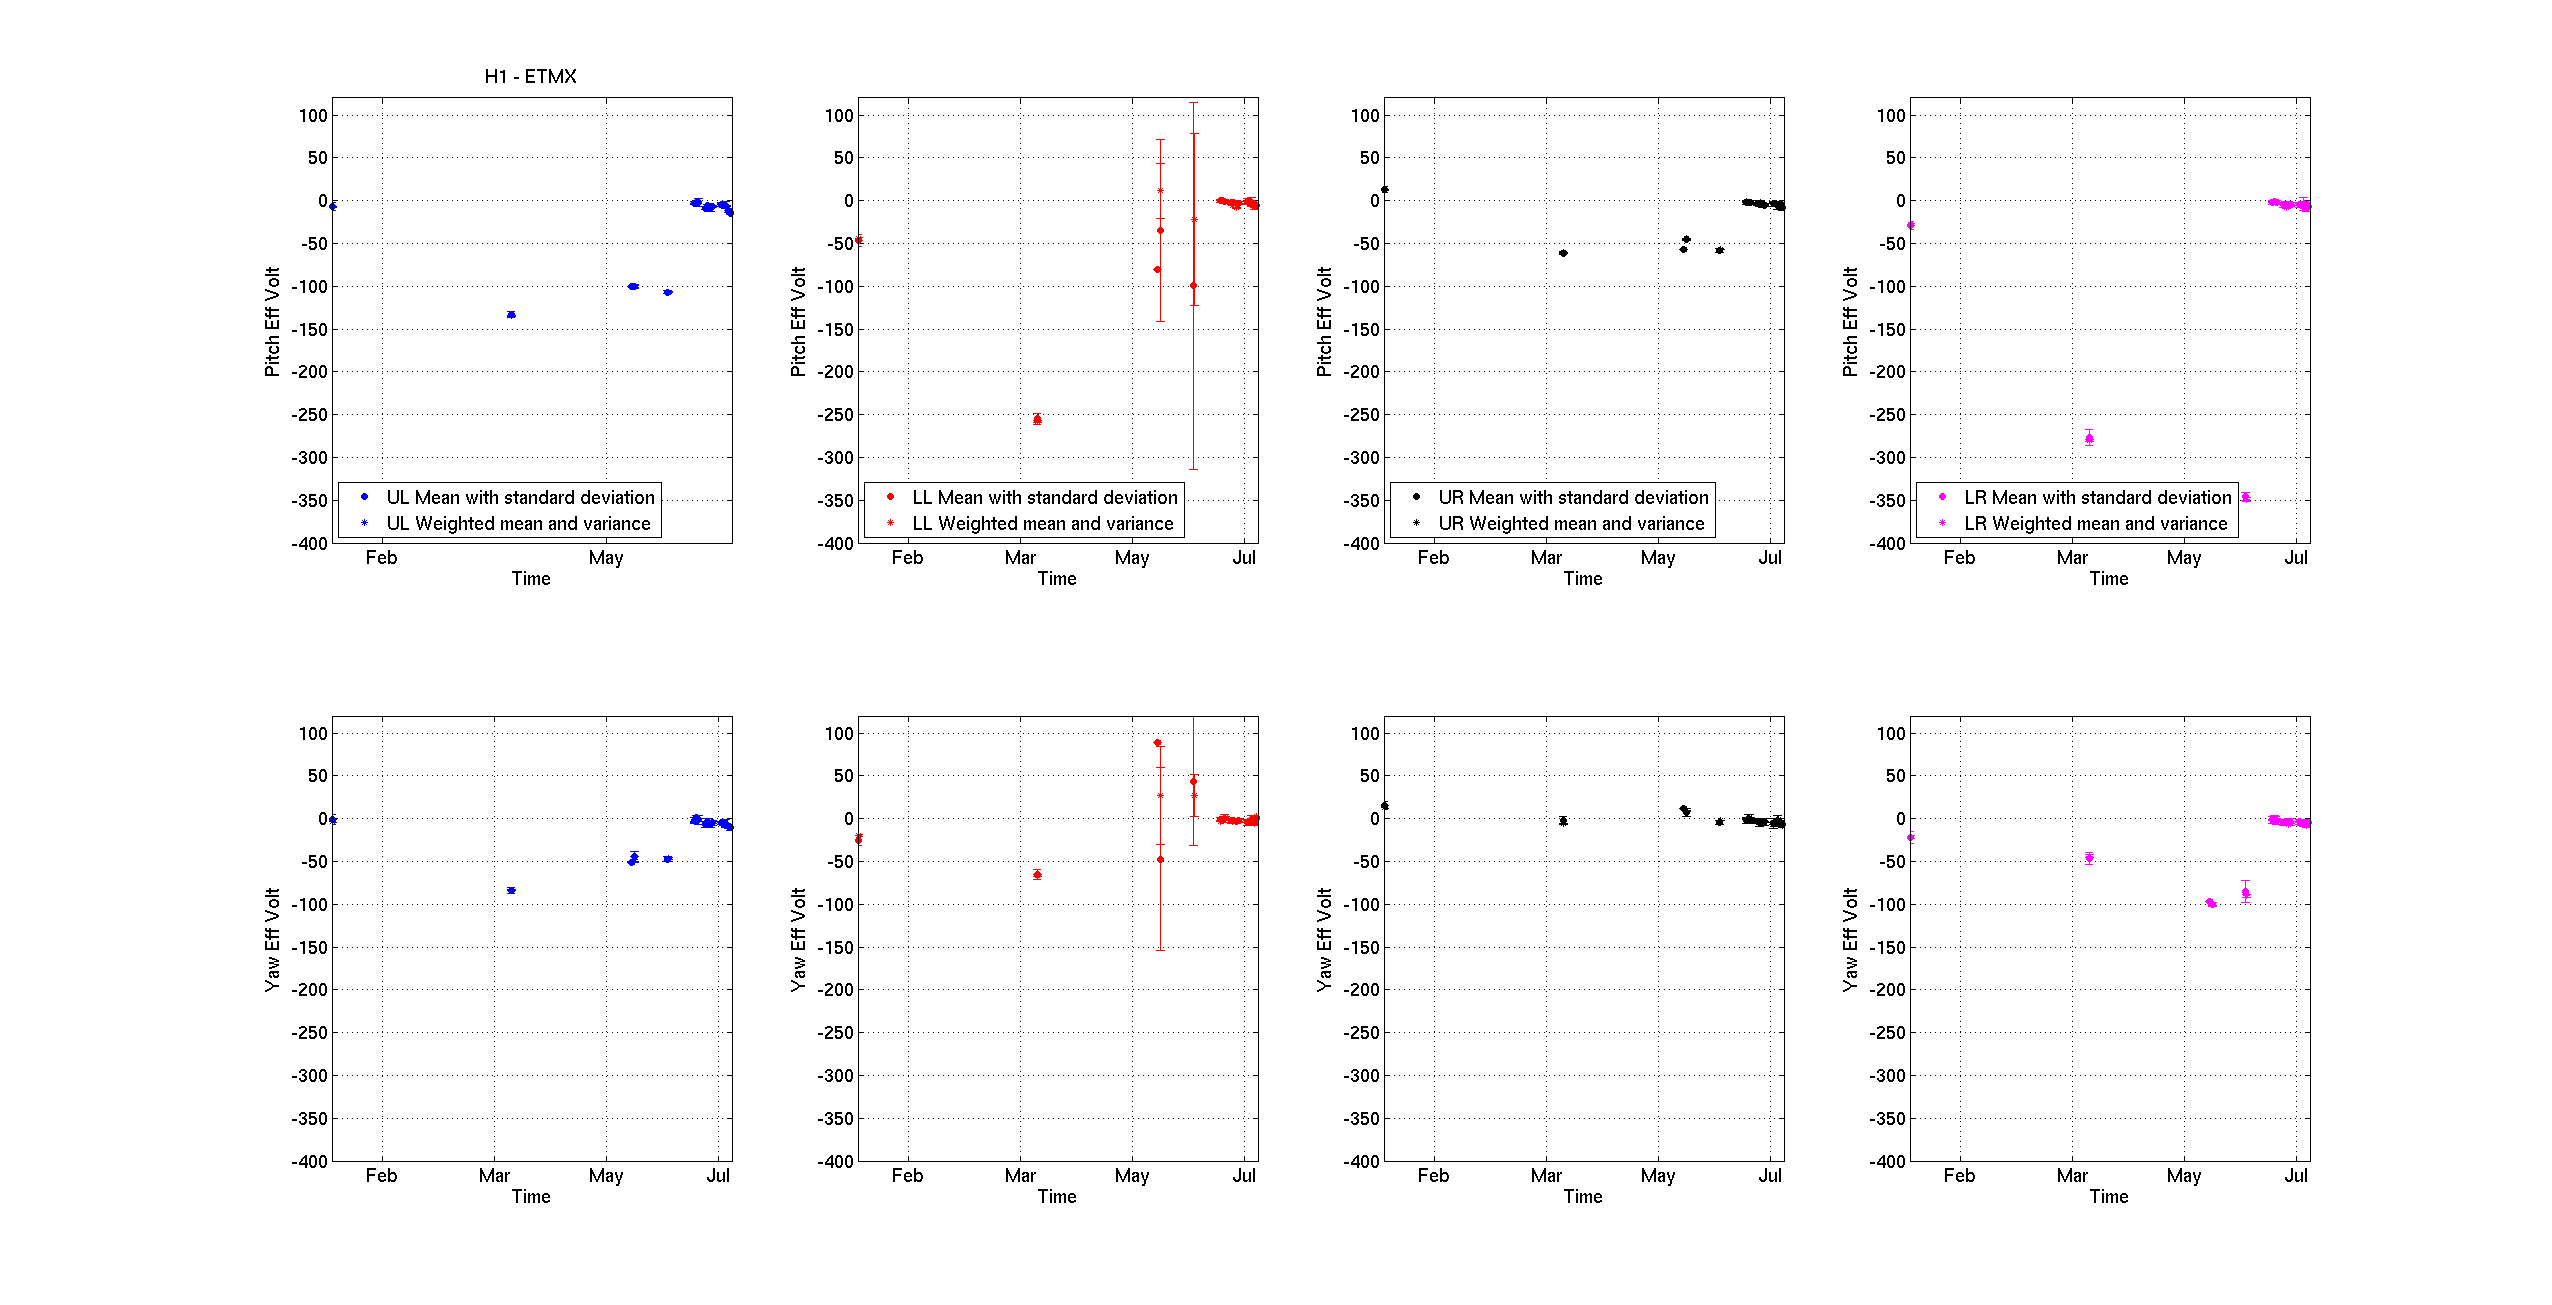
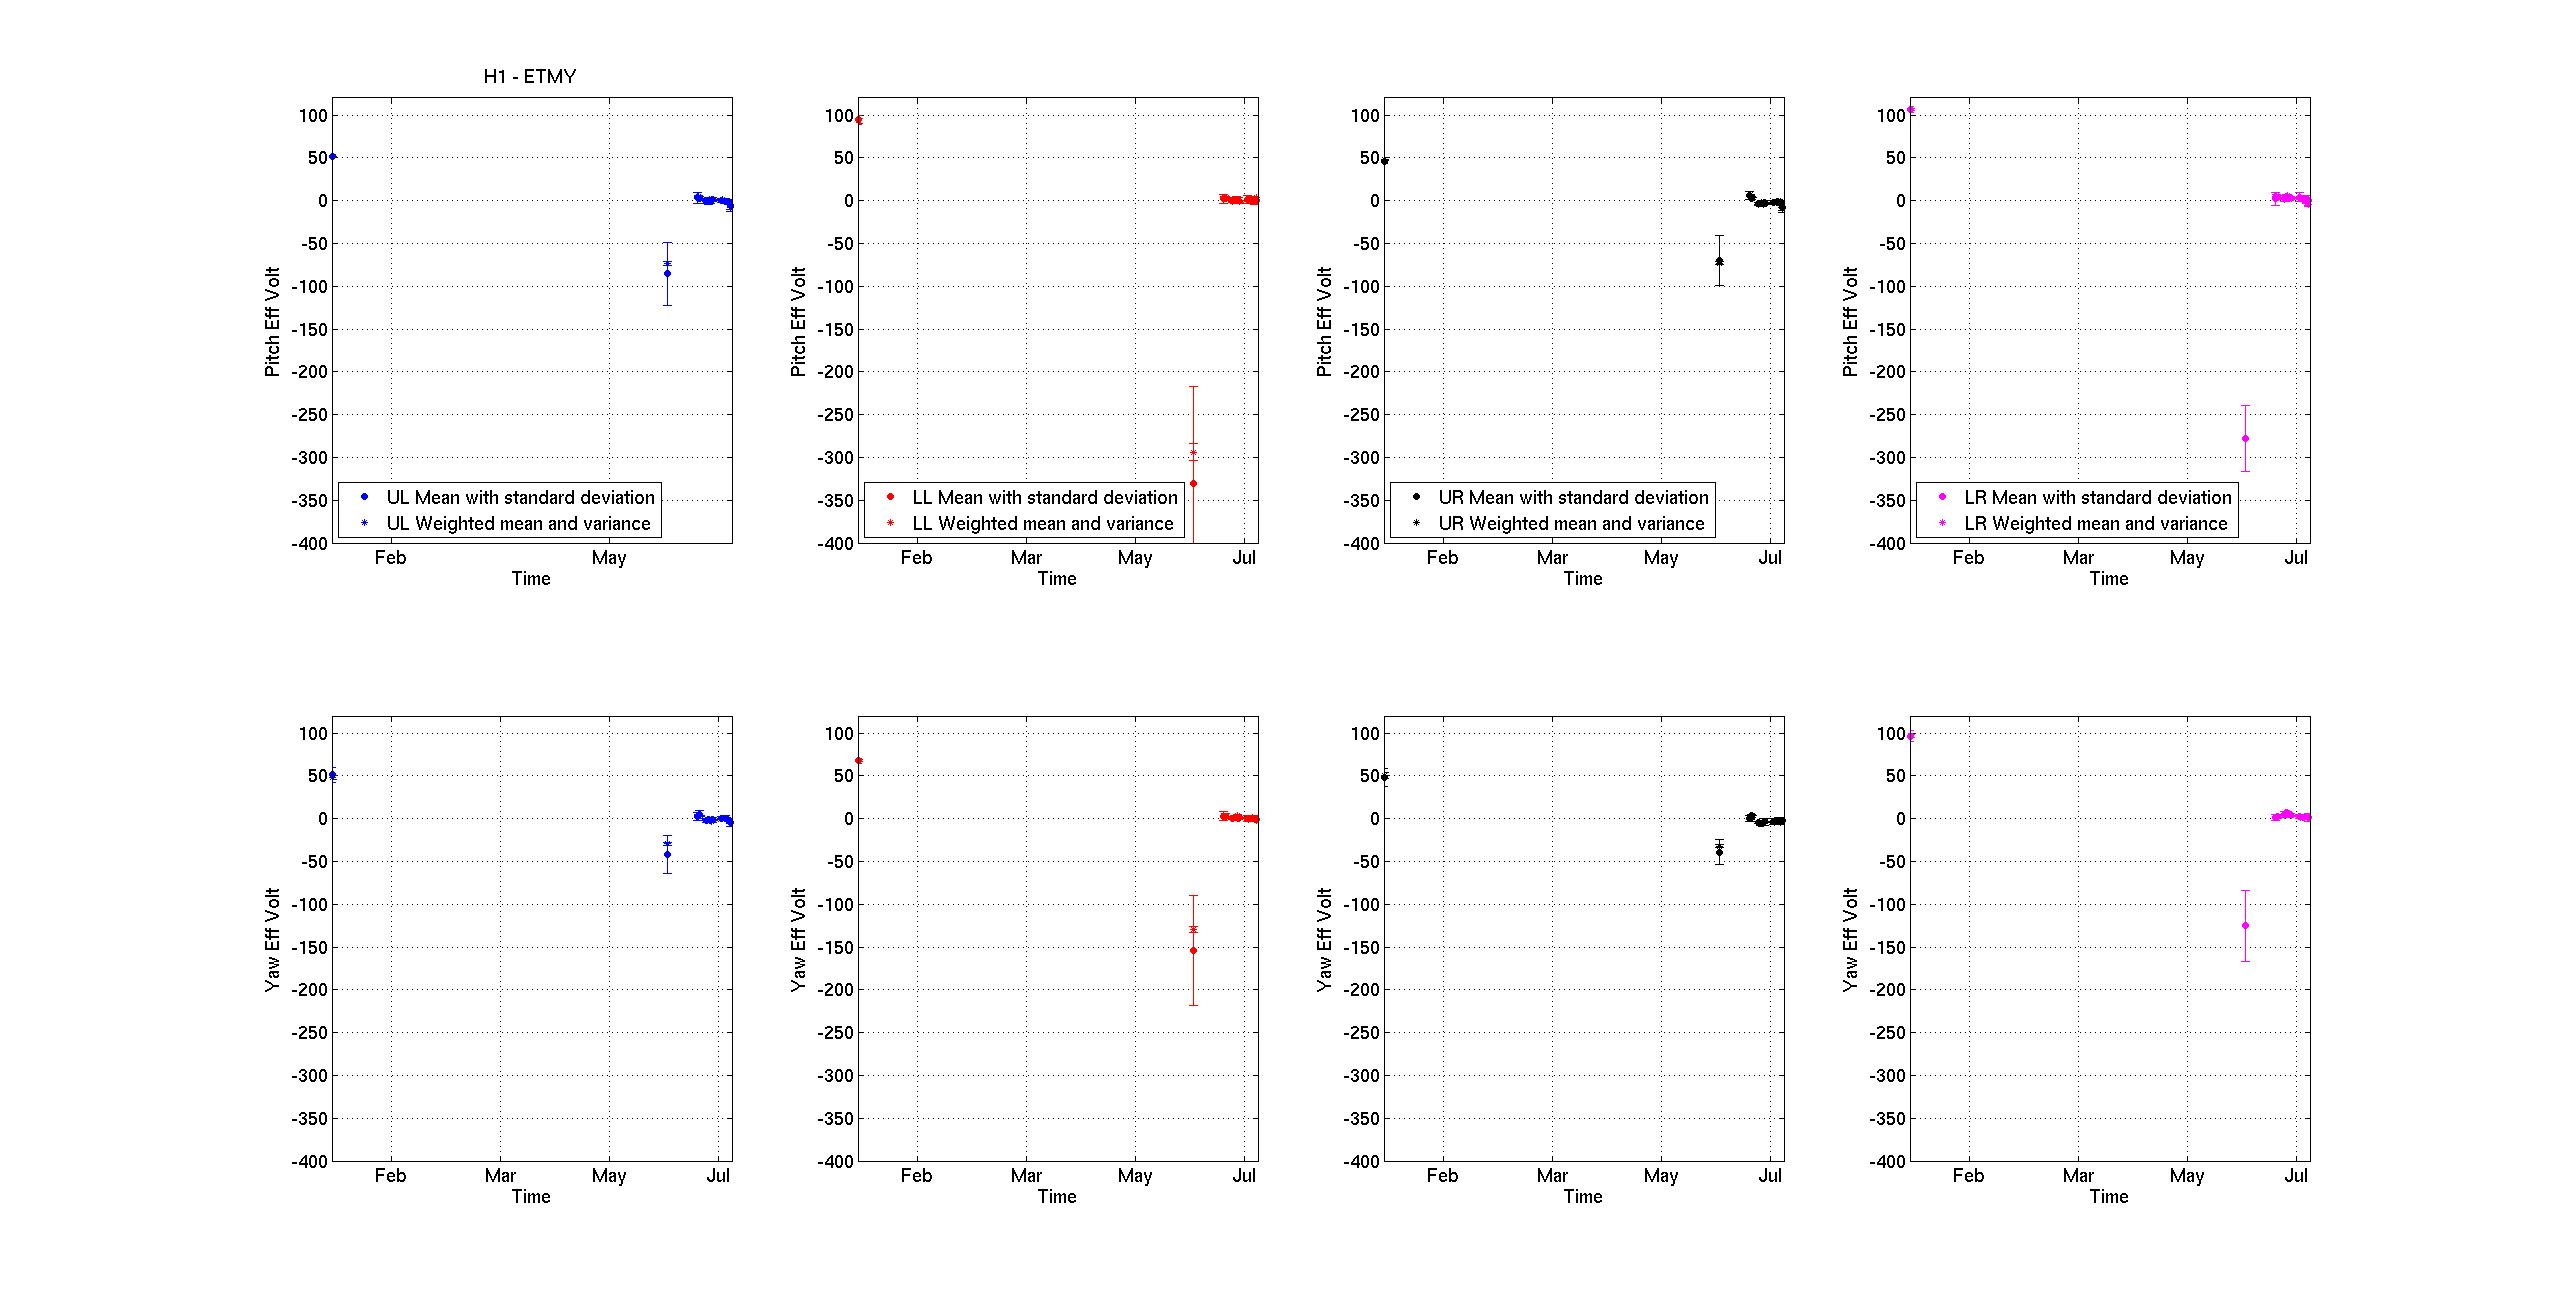
Leonid.Prokhorov, Jeffrey.Kissel

We continue the charge measurements on ETMs. The data are beginning to be consistent with a small increase in charge, consistently negative.
For the past few weeks since the discharging the charge has been small (<10 [V] Effective Bias Voltage), and roughly consistent with a parent Gaussian distribution with a mean about 0.0 [V] Effective Bias Voltage. However, as we get more data, we're beginning to see a case for a slow negative charging of the test masses (about 2-5 V/week) in at least half the quadrants (ETMX UR, UL, and LR; ETMY (the pitch estimates of) UR, UL, and LR). The uncertainty of these measurements is too large to state that the trend is statistically significant, but yellow flags have gone up.

This argues that we should continue roughly daily (say, thrice a week) measurements of the charge, and we need to continue to do so for another week or three.

There are three sets of plots, each which show the same data in a different way:
(1) ETMX.png & ETMY.png show the "raw" data, where the result of each estimate of the effective bias voltage shown *since* the discharging. Each single data point is an estimate of the effective bias voltage, i.e. the charge, as determined by driving the test mass while varying the requested bias voltage and measuring the response with the optic's optical lever.
(2) ETMX_Mean.png & ETMY_Mean.png shows both the mean and standard deviation, and weighted mean and sqrt(weighted variance) of the charge measurements for a given day (which can be from ~4 to ~15 of these 12 minute measurements per mean point). We believe this better shows the long-term trend of the charge.
(3) ETMX2015.png & ETMY_2015.png shows the mean charging measurement results since January 2015, i.e. it includes data when the test masses were charged and shows the discharge which happened in Mid-June.
Images attached to this report
Comments related to this report
It is useful to note that if the bias is going in a negative direction, the charge on the test mass
is going positive. This would be consistent with uv or xuv photoemission from the front surface of
the test mass. Refer to DCC  T1400647-v1. The slow growth of charge on the LLO etmy is also going in the same direction
toward positive charge.