cheryl.vorvick@LIGO.ORG - posted 16:14, Friday 10 July 2015 (19555)
PSL FSS TPD has fallen below 0.9V
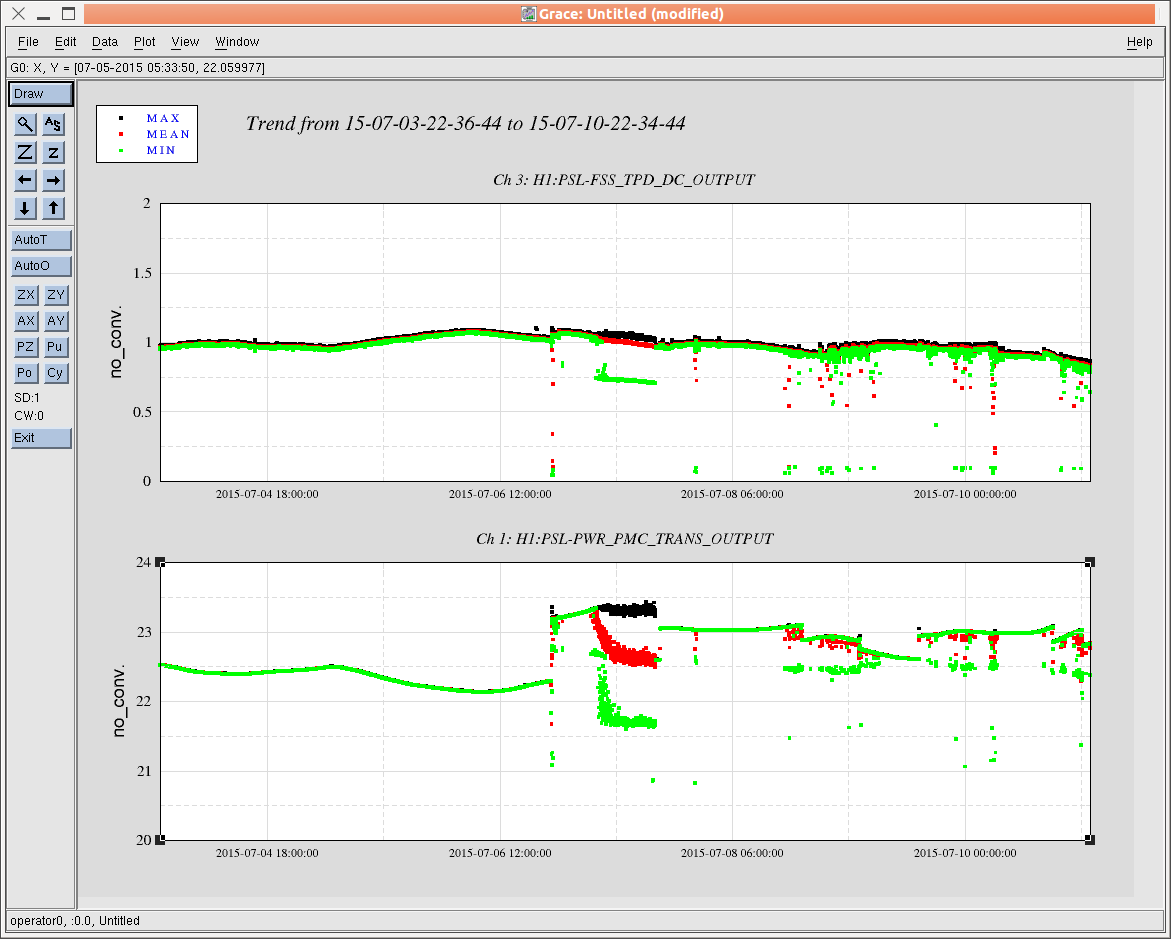
plot 1: PSL FSS TPD (top), PMC TRANS (bottom) - 7 days of data - channels changed behavior about 4 days ago, and TPD fell below 0.9 sometime in the last day or so.
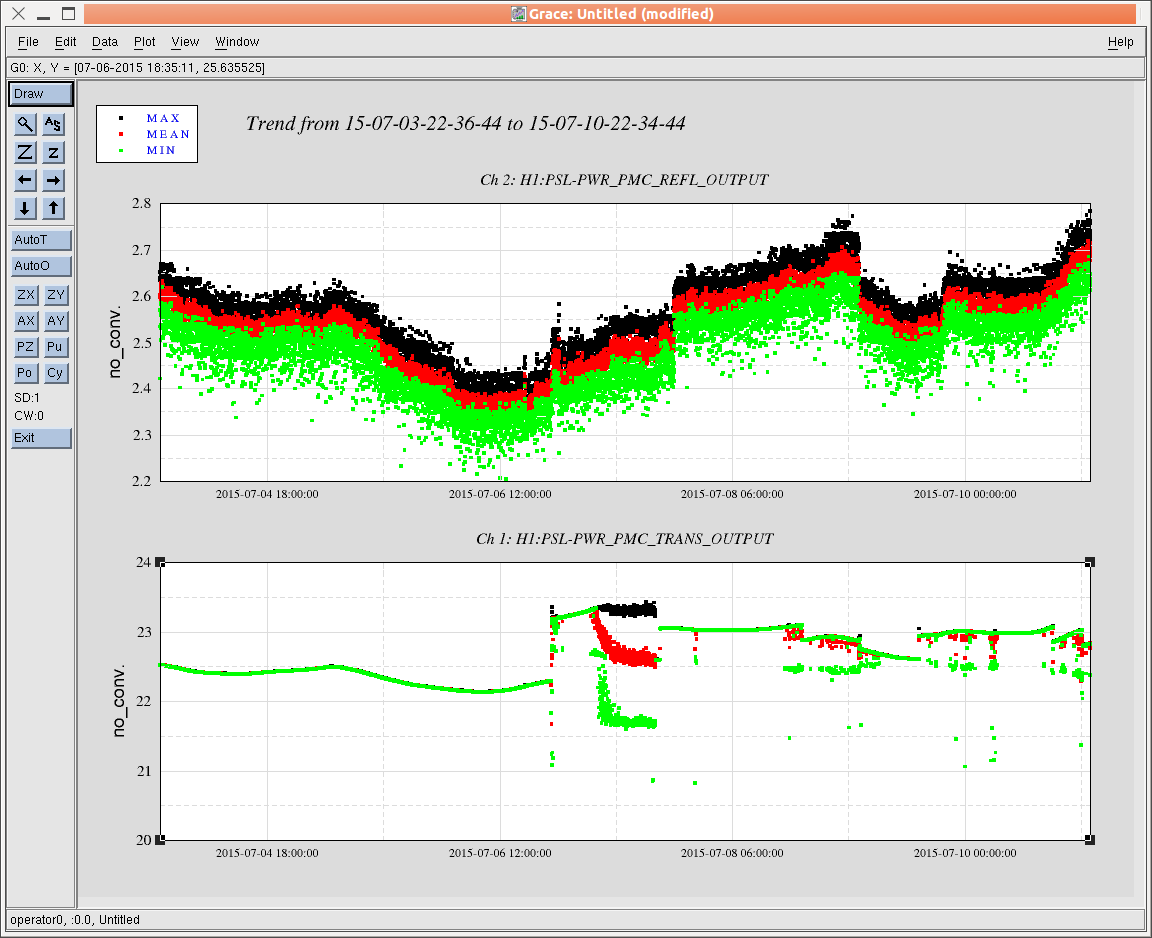
plot 2: PMC REFL (top), PMC TRANS (bottom) - 7 days of data - PMC REFL climbing faster in last 24 hours or so.
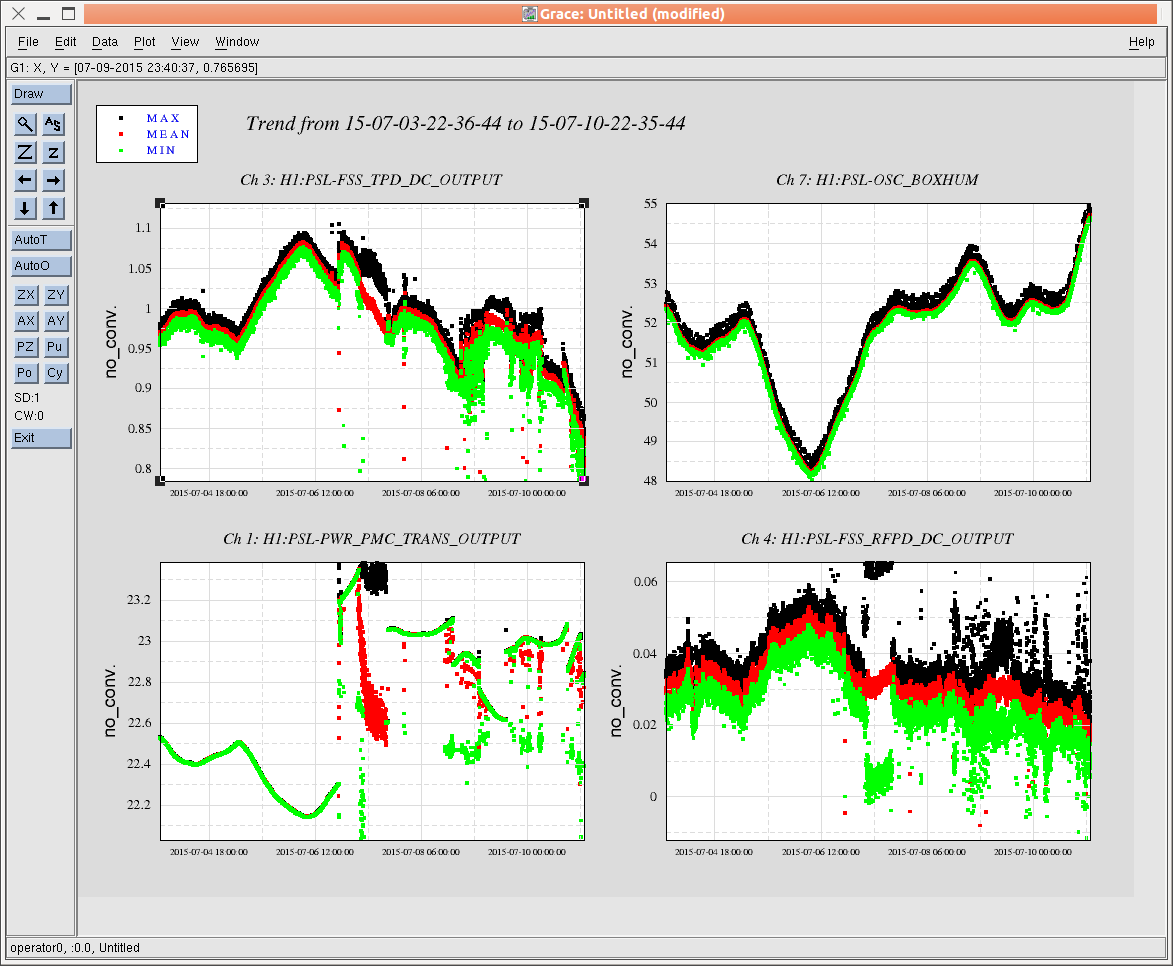
plot 3: Ch7: PSL OSC BOXHUM (upper right) seems to be correlated with other three channels in the first 1/2 of the plot.
Images attached to this report