Summary
To decrease uncertainty in calculation of actuation function correction factor, kappa_A, sensing function correction factor, kappa_C, and CC pole frequency, f_c, we've recently increased calibration line amplitudes to give SNR of 100 with 10s FFT (see LHO alog #19792). Earlier Kiwamu posted his investigation of CC pole frequency over the last weekend in LHO alog comment #19988. In this alog we show kappa_A, kappa_C and f_c calculated according to the method described in T1500377-v3 for the same time interval (2015-07-25 00:00 UTC to 2015-07-27 UTC, when GRD-ISC_LOCK_STATE_N >= 501, 1 min FFTs).
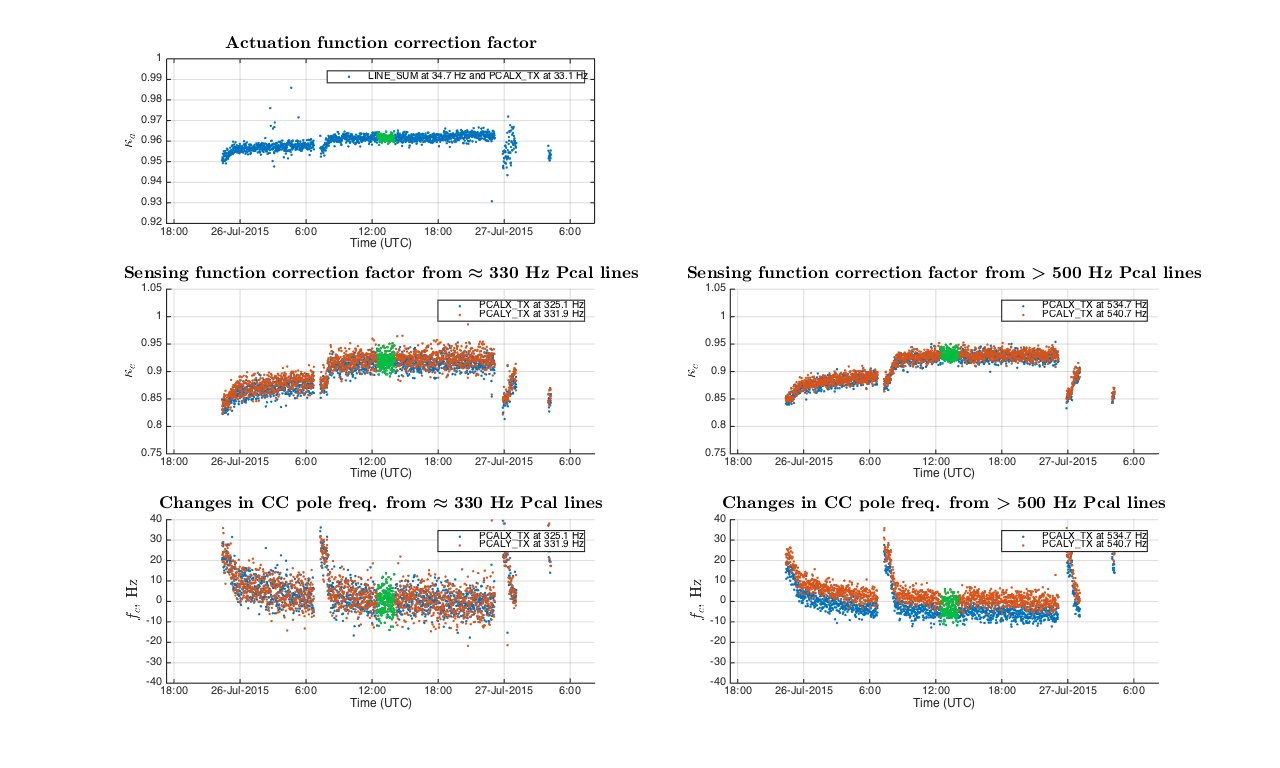
Statistical uncertainties of kappa_A, kappa_C and f_c within 1.5 hours time interval highlighted with green are:
Xctrl(34.7) and PcalX(33.1), std(kappa_A) = +/- 0.45 % (1 sigma)
PcalX(325.1), std(kappa_C) = +/- 1.12 % (1 sigma); std(f_c) = +/- 5.20 Hz (1 sigma)
PcalY(331.9), std(kappa_C) = +/- 1.43 % (1 sigma); std(f_c) = +/- 5.55 Hz (1 sigma)
PcalX(534.7), std(kappa_C) = +/- 0.70 % (1 sigma); std(f_c) = +/- 2.08 Hz (1 sigma)
PcalY(540.7), std(kappa_C) = +/- 0.78 % (1 sigma); std(f_c) = +/- 2.68 Hz (1 sigma)
Notice that kappa_C and f_c on the left subplots were calculated from low SNR 325.1 Hz and 331.9 Hz Pcal lines set by Evan (see LHO alog comment #19823). Calculation of these parameters using higher SNR 534.7 Hz and 540.7 Hz Pcal lines (right subplots) gave less noisy results.
Details
C_0, D_0 and A_0 were taken from LHO ER7 DARM model.
To make kappa_C calcluations consistent between results from 4 Pcal lines, a manual correction to phases of Pcal lines that correspond to 130us of time advance was applied. On the plot we report only changes in f_c by subtracting mean value of about 300 Hz. In order to receive an absolute value of f_c using this method, we must take into account exact time delay/advance of PCAL RXPD channel w.r.t. DARM_ERR; possibly a frequency independent phase shift (however we do now know any reason for that); and the DARM model TFs at the reference time, C_0, D_0 and A_0.
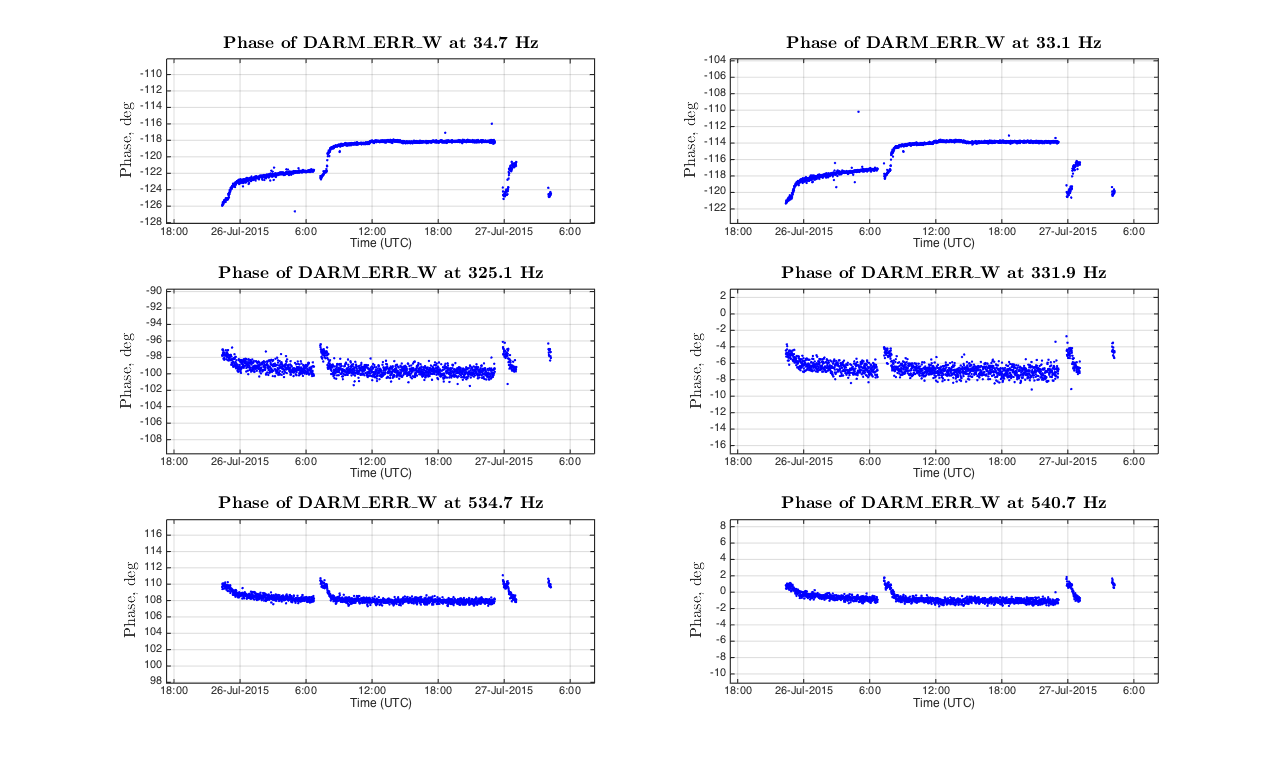
Plots of 1 min FFT dewhitened calibration line amplitudes and phases are given below.
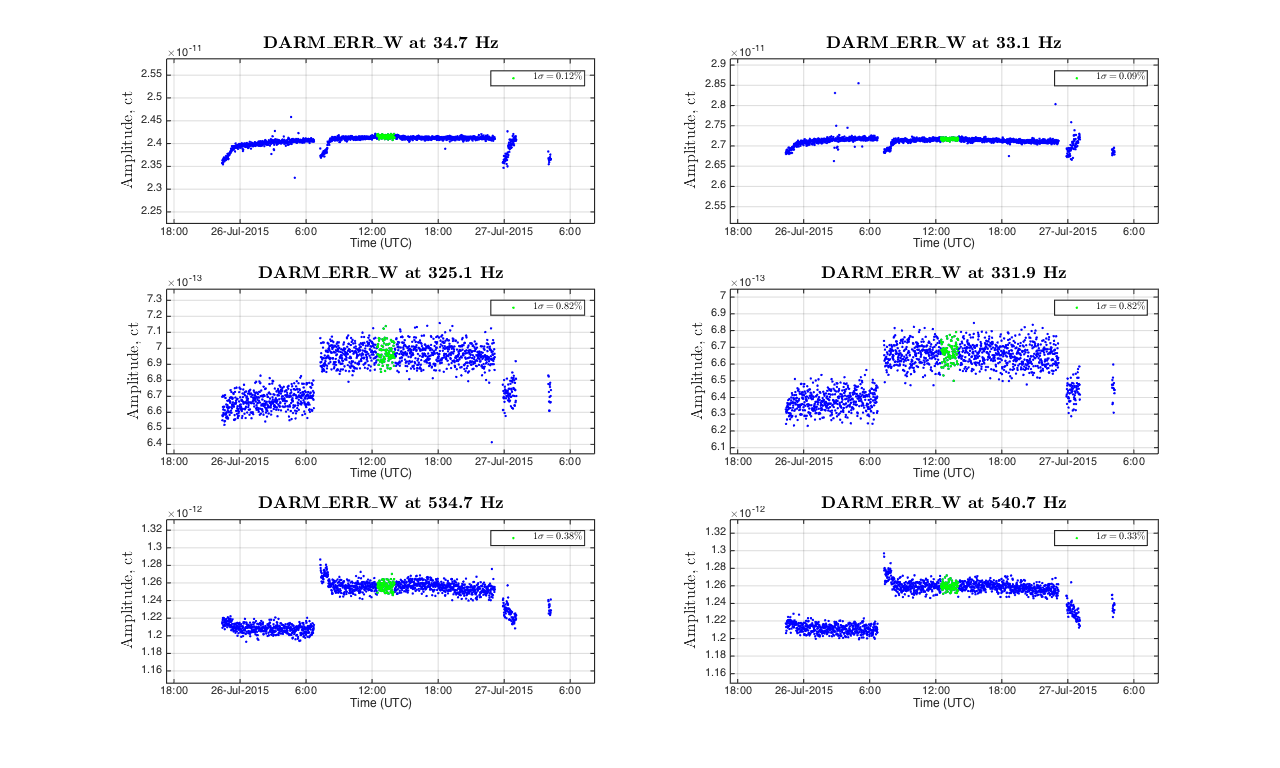
Calibration line uncertainties in DARM_ERR readout in a 1.5 hours interval (highlighted with green color) are as follows:
Xctrl( 34.7) = 2.2000e-01 (+/- 0.00 %); Derr( 34.7) = 2.9738e-10 (+/- 0.15 %)
PcalX( 33.1) = 2.4587e-02 (+/- 0.00 %); Derr( 33.1) = 3.0817e-10 (+/- 0.26 %)
PcalX(325.1) = 1.0724e-01 (+/- 0.00 %); Derr(325.1) = 2.0593e-10 (+/- 1.48 %)
PcalY(331.9) = 9.3791e-02 (+/- 0.01 %); Derr(331.9) = 2.0150e-10 (+/- 1.55 %)
PcalX(534.7) = 7.1100e-01 (+/- 0.00 %); Derr(534.7) = 5.8223e-10 (+/- 0.52 %)
PcalY(540.7) = 6.3845e-01 (+/- 0.01 %); Derr(540.7) = 5.8948e-10 (+/- 0.45 %)
P.S.
After today's calibration telecon we've changed calibration lines that will be used for estimation of kappa_A, kappa_C and f_c to (see LHO alog #20063):
- PCALY 36.7 Hz, SNR ~100;
- DARM_CTRL 37.3 Hz, SNR ~90;
- PCALY 331.9 Hz, SNR~100;
- PCALY 1083.7 Hz, SNR~40;
We are also planning to add an ESD line close to low frequency PCALY line and another high frequency low SNR PCALX line at 3001.3 Hz after completing power budget investigations of PCALX module.
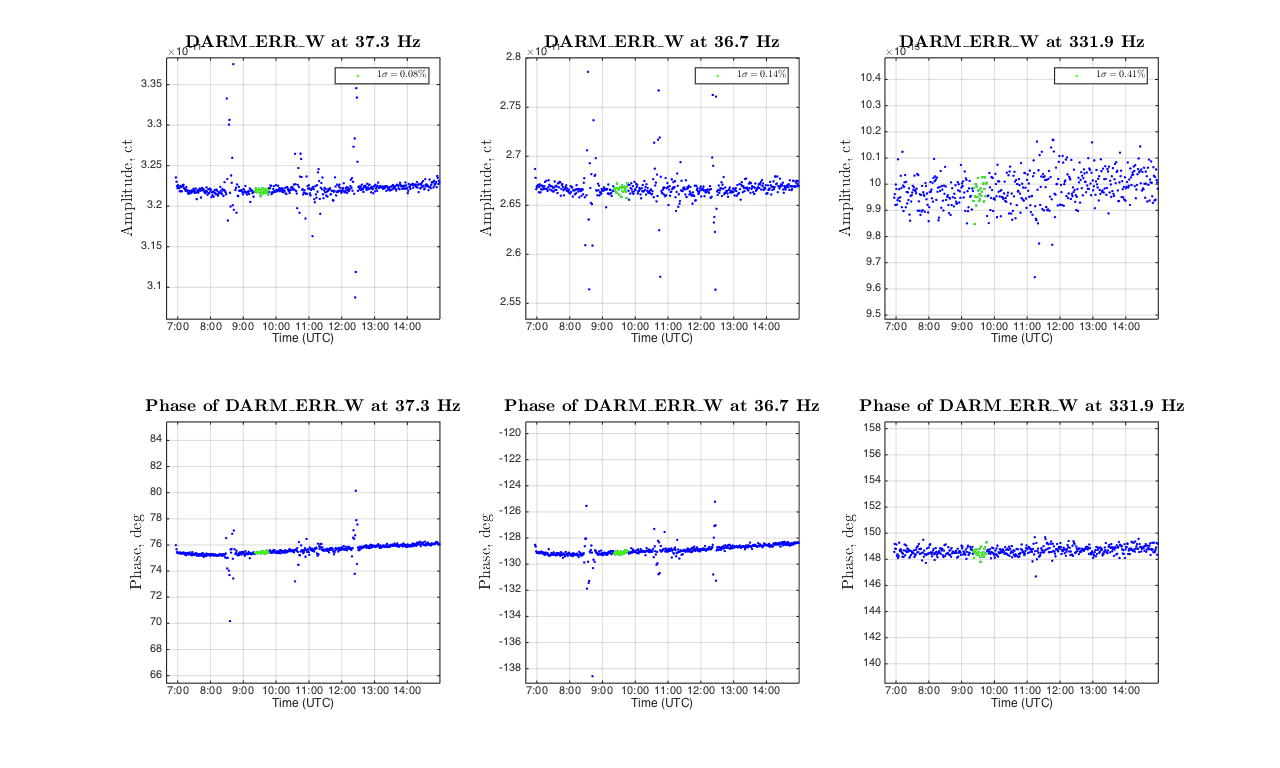
Plot of kappa_A, kappa_C and f_c calculated from new calibration lines (see LHO alogs #20063 and #20052) from the last night lock stretches undisturbed lock stretches is given below.
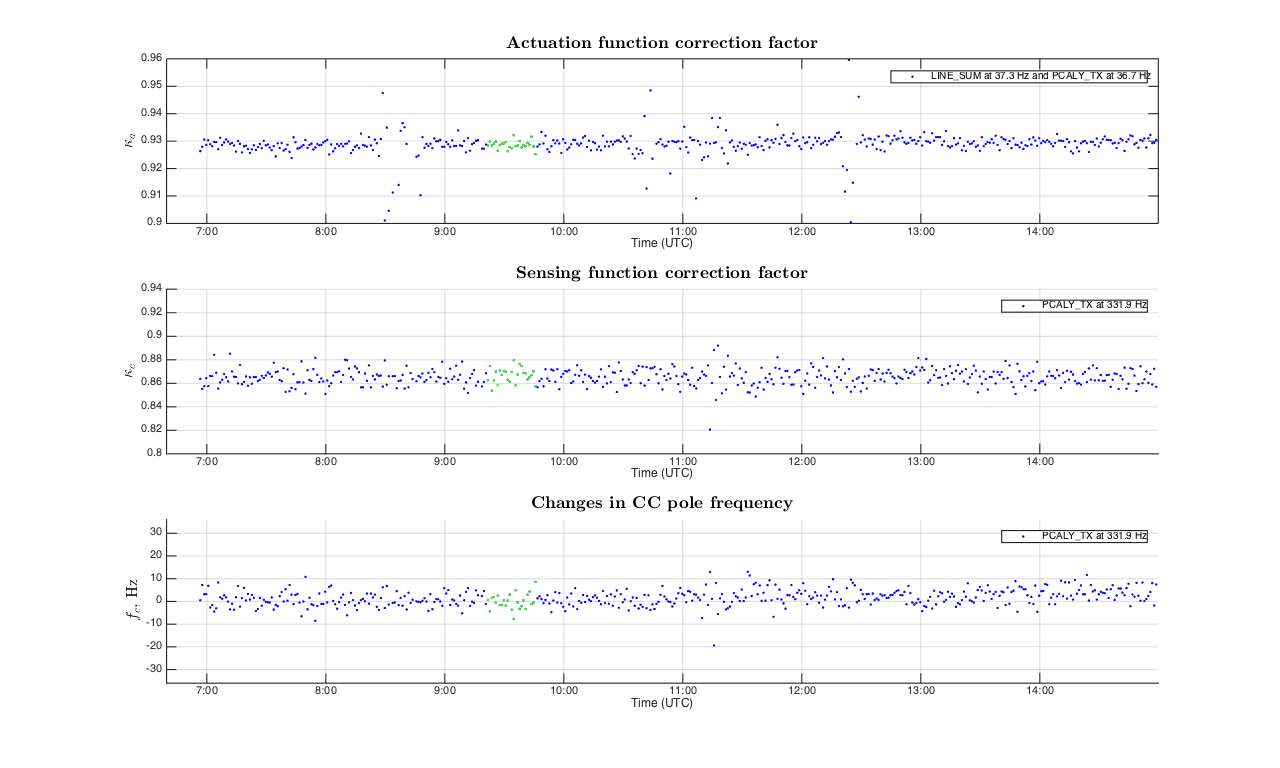
As it was reported in LHO alog #20089, undisturbed data was collected for ~25 minutes in the interval [Jul 31 2015 09:21:13 UTC, Jul 31 2015 09:46:13 UTC], this interval is highlighted with green data points.
Details
Statistical uncertainties of 1 min FFT calibration line amplitudes in d_err in undisturbed interval (highlighted with green markers on the attached plot) are:
PCALY line in d_err(36.7 Hz)   = 3.6189e-10 (+/- 0.14 %)
 DARM line in d_err(37.3 Hz)   = 4.4939e-10 (+/- 0.08 %)
PCALY line in d_err(331.9 Hz)  = 3.0103e-10 (+/- 0.41 %)
PCALY line in d_err(1083.7 Hz) = 3.5701e-10 (+/- 1.30 %)
Statistical uncertainties of calculated kappa_A, kappa_C and f_c in undisturbed interval are:
from Xctrl(37.3) and PcalY(36.7):
    std(kappa_A) = +/- 0.92 % (1 sigma)
from PcalY(331.9):
    std(kappa_C) = +/- 0.73 % (1 sigma)
    std(f_c)     = +/- 3.40 Hz (1 sigma)
Statistical uncertainties of calculated kappa_A, kappa_C and f_c are: