This is a brief update of the current situation of the ISS 2nd loop.
- It successfully lowers intensity noise.
- The resonant peaks of the periscope mirror mount, which would contribute significantly to DARM, can be pushed to more than a factor of 10 below the current DARM floor, in 20-2k Hz band.
[Contribution to DARM]
Here are estimation of the contribution of intensity noise to DARM with and without closing the 2nd loop:
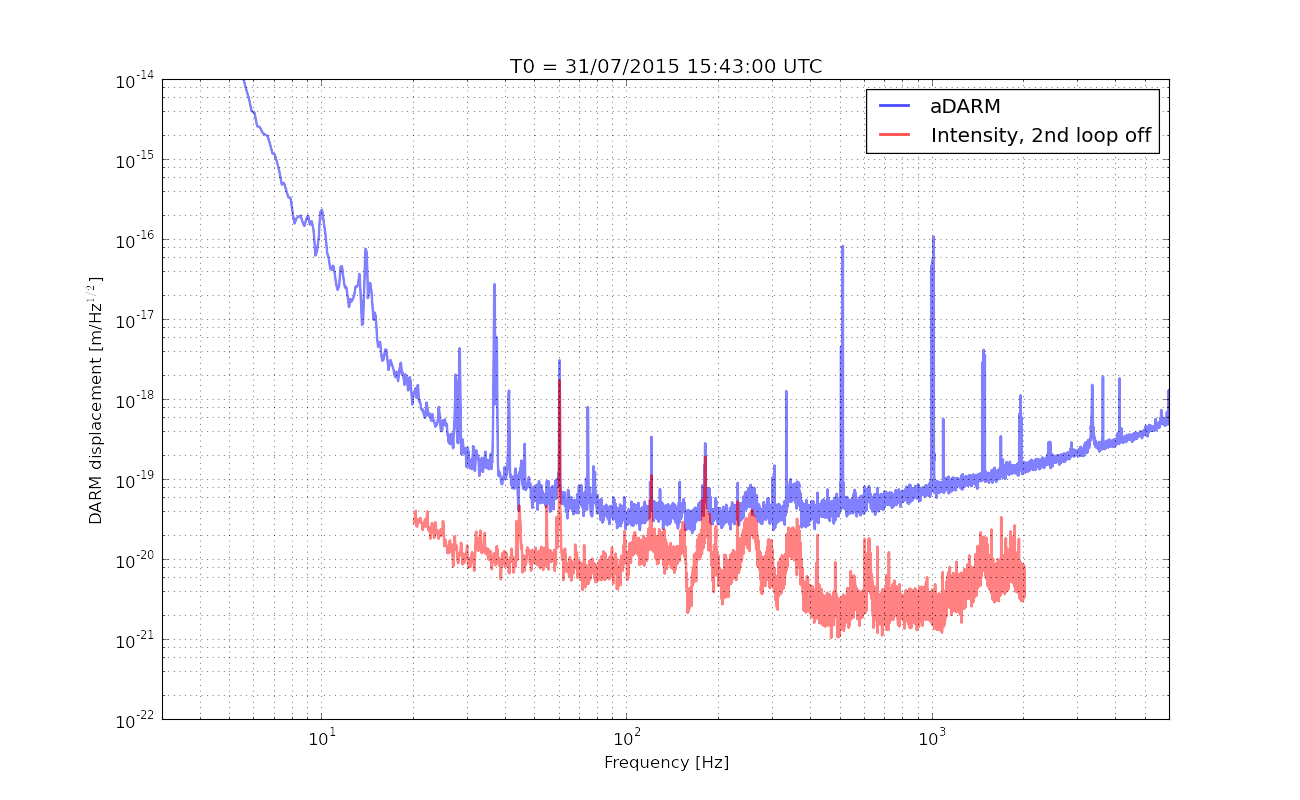
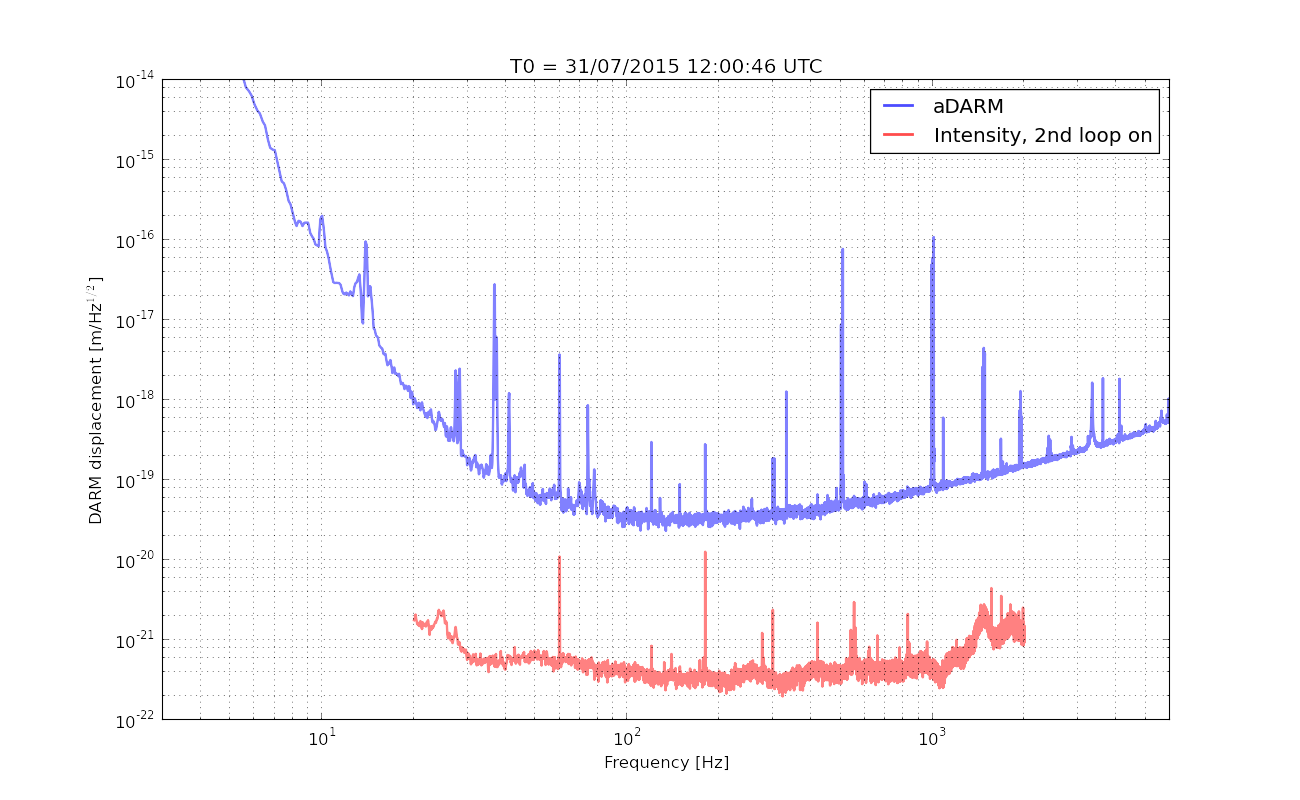
The left plot is an estimation without the 2nd loop closed, and the right plot with the 2nd loop closed. The estimation was done by measuring the coupling transfer function from the ISS 2nd loop PD array to the DARM error point and propagating the measured spectra of the ISS array via the measured transfer function to DARM displacement. As you can see, when the 2nd loop is open, it pollutes the DARM spectrum in 100- 400 Hz. Though it looks like I am missing a factor of two or so for some reason in order for the intensity noise to be dominant in the DARM spectrum as observed.
As shown in the right plot, the loop suppresses intensity noise and pushes it to a point more than a factor of 10 apart from the DARM noise floor. This is good. One thing I noticed is that the spectral shape of intensity noise changed depending on whether the 2nd loop was closed or not. For example, the left plot clearly shows structure in 100 - 400 Hz band in the estimated contribution of intensity noise while the right plot does not show the structure. I am still studying what is going on, but it seems like it is from some kind of readout noise of the PD array which covered the real spectral shape.
Also, I attach a measured coupling from the PD arrays to DARM displacement [meters/RIN].
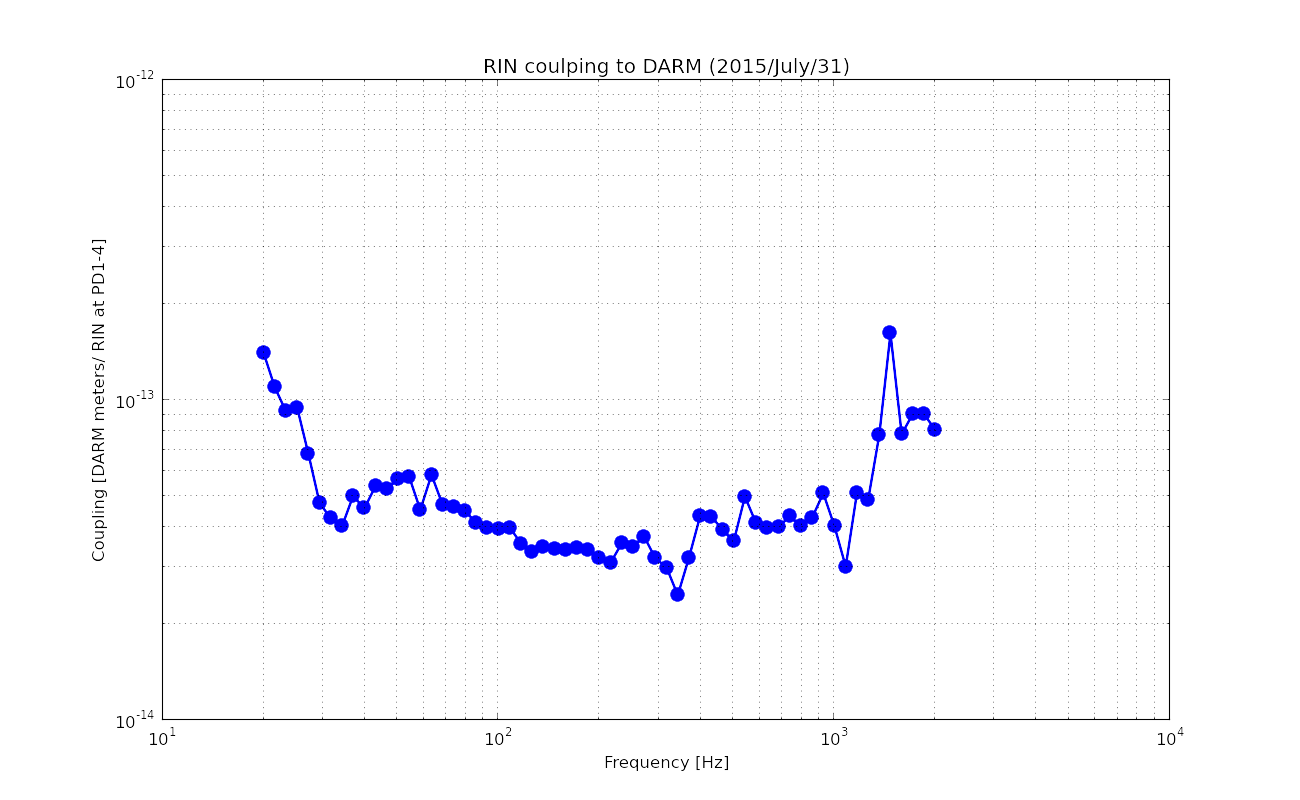
As shown, it is on the order of 3-4 x 10-14 [meters/cnts]. By the way, meters, I refer here is unsuppressed DARM displacement. The measurement was done by injecting swept sine at H1:PSL-ISS_TRANSFER1_INJ with the 2nd loop intentionally disabled in order to get high coherence. The interferometer was locked fully in low noise and a PSL power was at 24 W at around 8:40 PT of July 31st.
[Suppression]
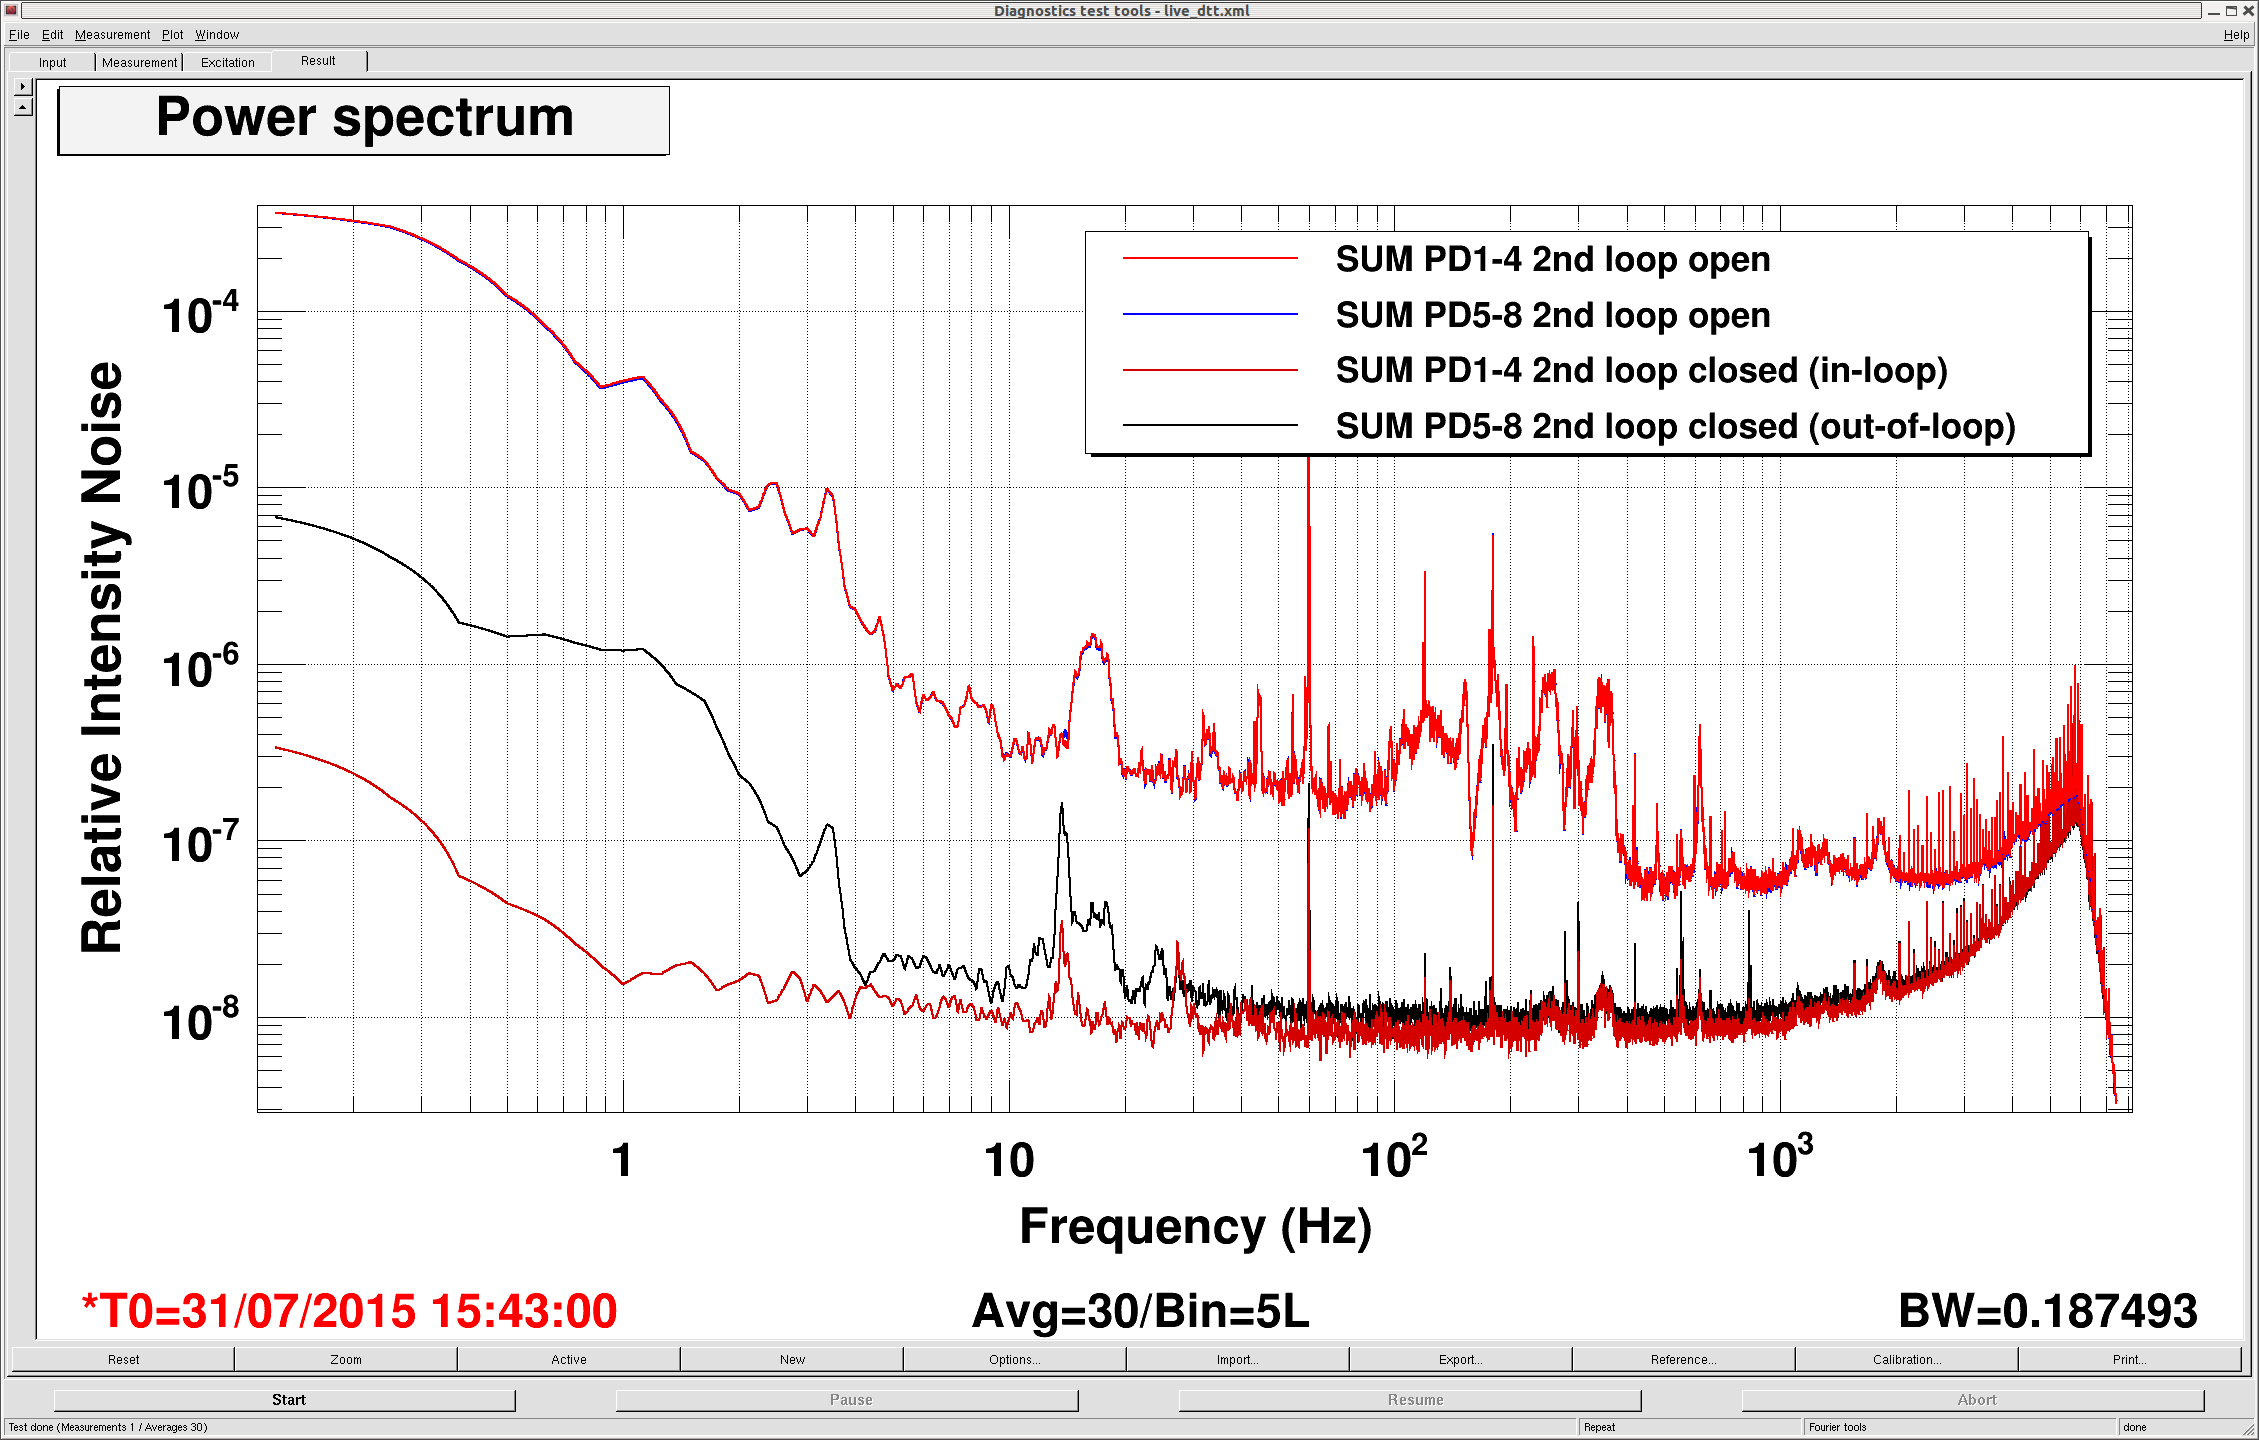
As mentioned above, the suppressed noise does not make sense. They look as if they are covered by some kind of readout noise. Nevertheless, it is evident that the suppression at 300 Hz is approxiamtely a factor of 60 as expected. Good. Later, Stefan and I undid the anti-whitening in the measured spectra in order to check whether the signals were above ADC noise or not -- they were above ADC noise by a factor of 10 or so. Also, I believe that the structure in 10-20 Hz is some scattering induced noise which Gabriele reported before (for example, alog 15198).
[Next to do]
* Modeling of the measured intensity noise coupling.
* Figure out the read out noise.