In this elog entry I'll describe some statistical study of all the loud glitches of the last two months. Unfortunately, I don't have any clear conclusion, but I identified 151 glitches of the kind we are looking for.
Method
Looking at the Detchar summary pages, I selected the most stable and longest lock stretches from June 1st till today. For each of them, loud glitches were selected by looking at the minutes when the inspiral range dropped more than 5 Mpc with respect to the general trend (computed with a running average of 30 minutes). The list of lock stretches is reported in the first attached text file (lock_stretches.txt).
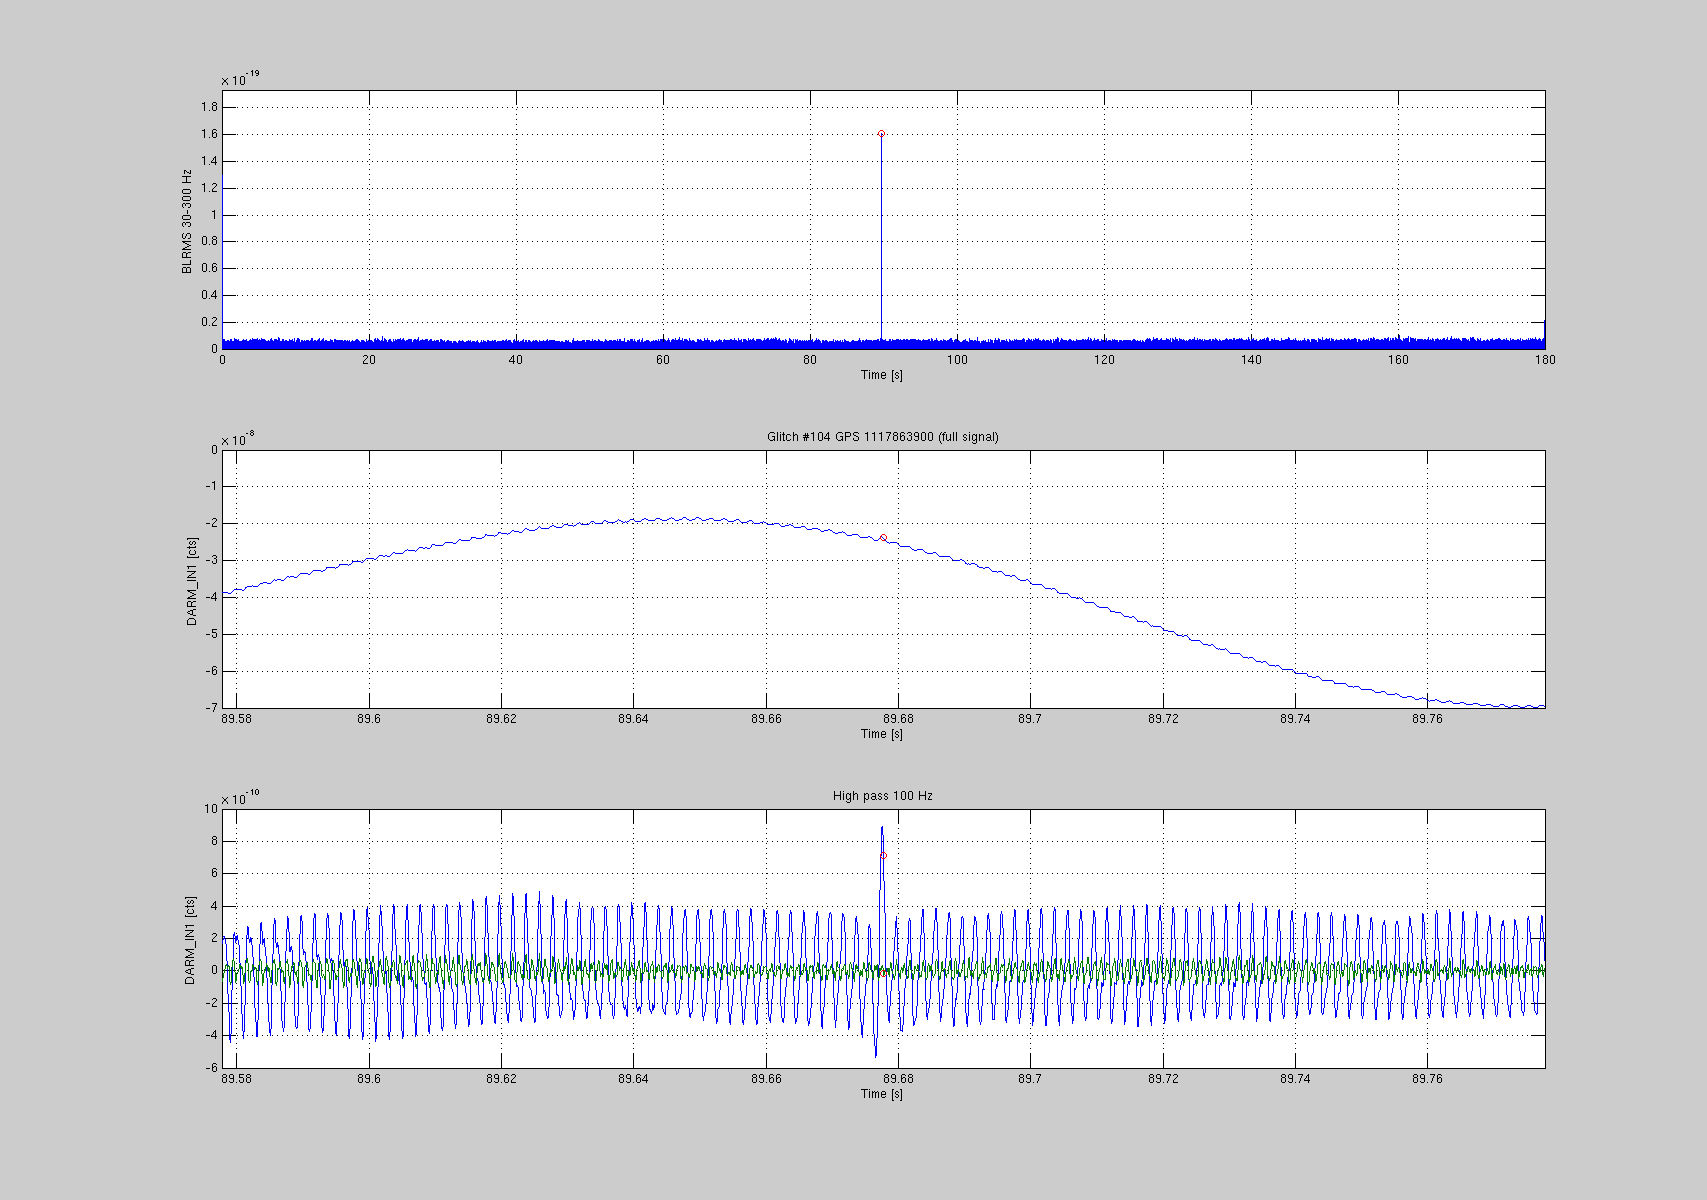
The range is sampled at 1/60 Hz, so to better identify the glitch time I loaded LSC-DARM_IN1 and computed a band-limited RMS between 30 and 300 Hz. Empirically, this turned out to be a good indicator of the kind of glitches we are trying to investigate. The time of the glitch is taken as the time that corresponds to the maximum value of the said BLRMS. This works very well for our glitches, but may give slightly wrong results (within one minute) for other kind of glitches
In total I identified 285 loud glitches, as defined above. The corresponding GPS times are listed in the second attached text file (glitch_times.txt) together with a number which classifies the glitch (see more later).
Some general statistics
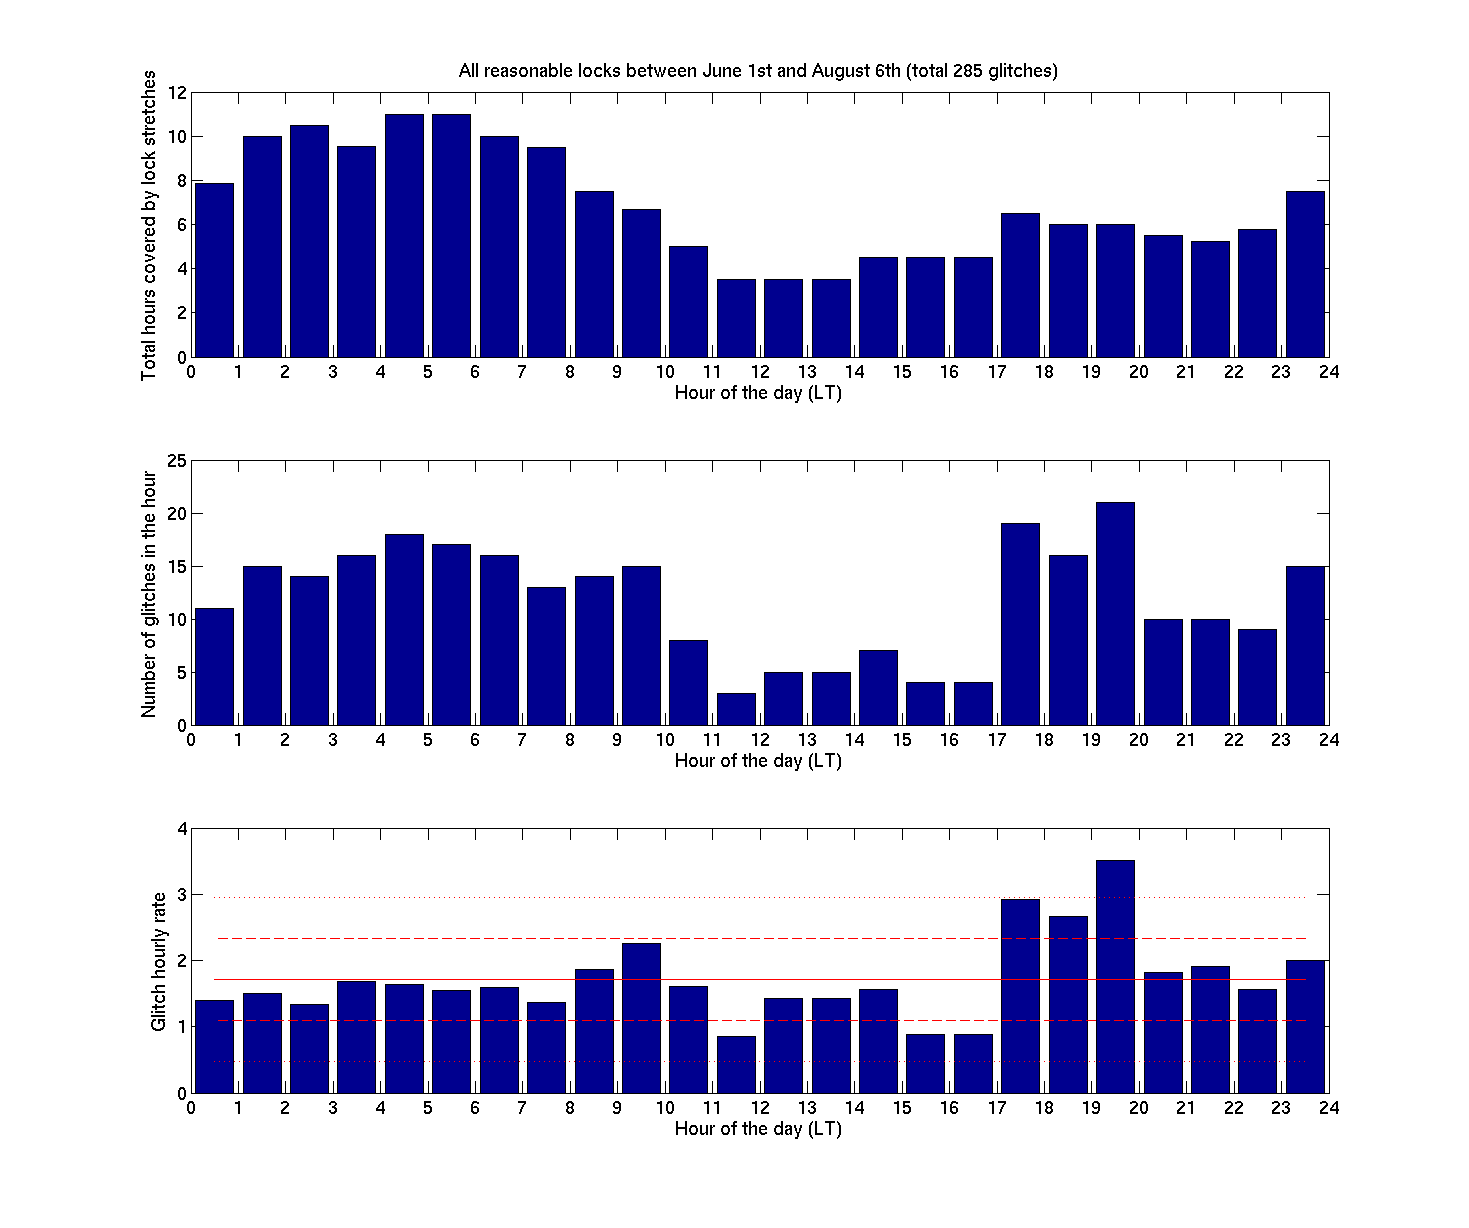
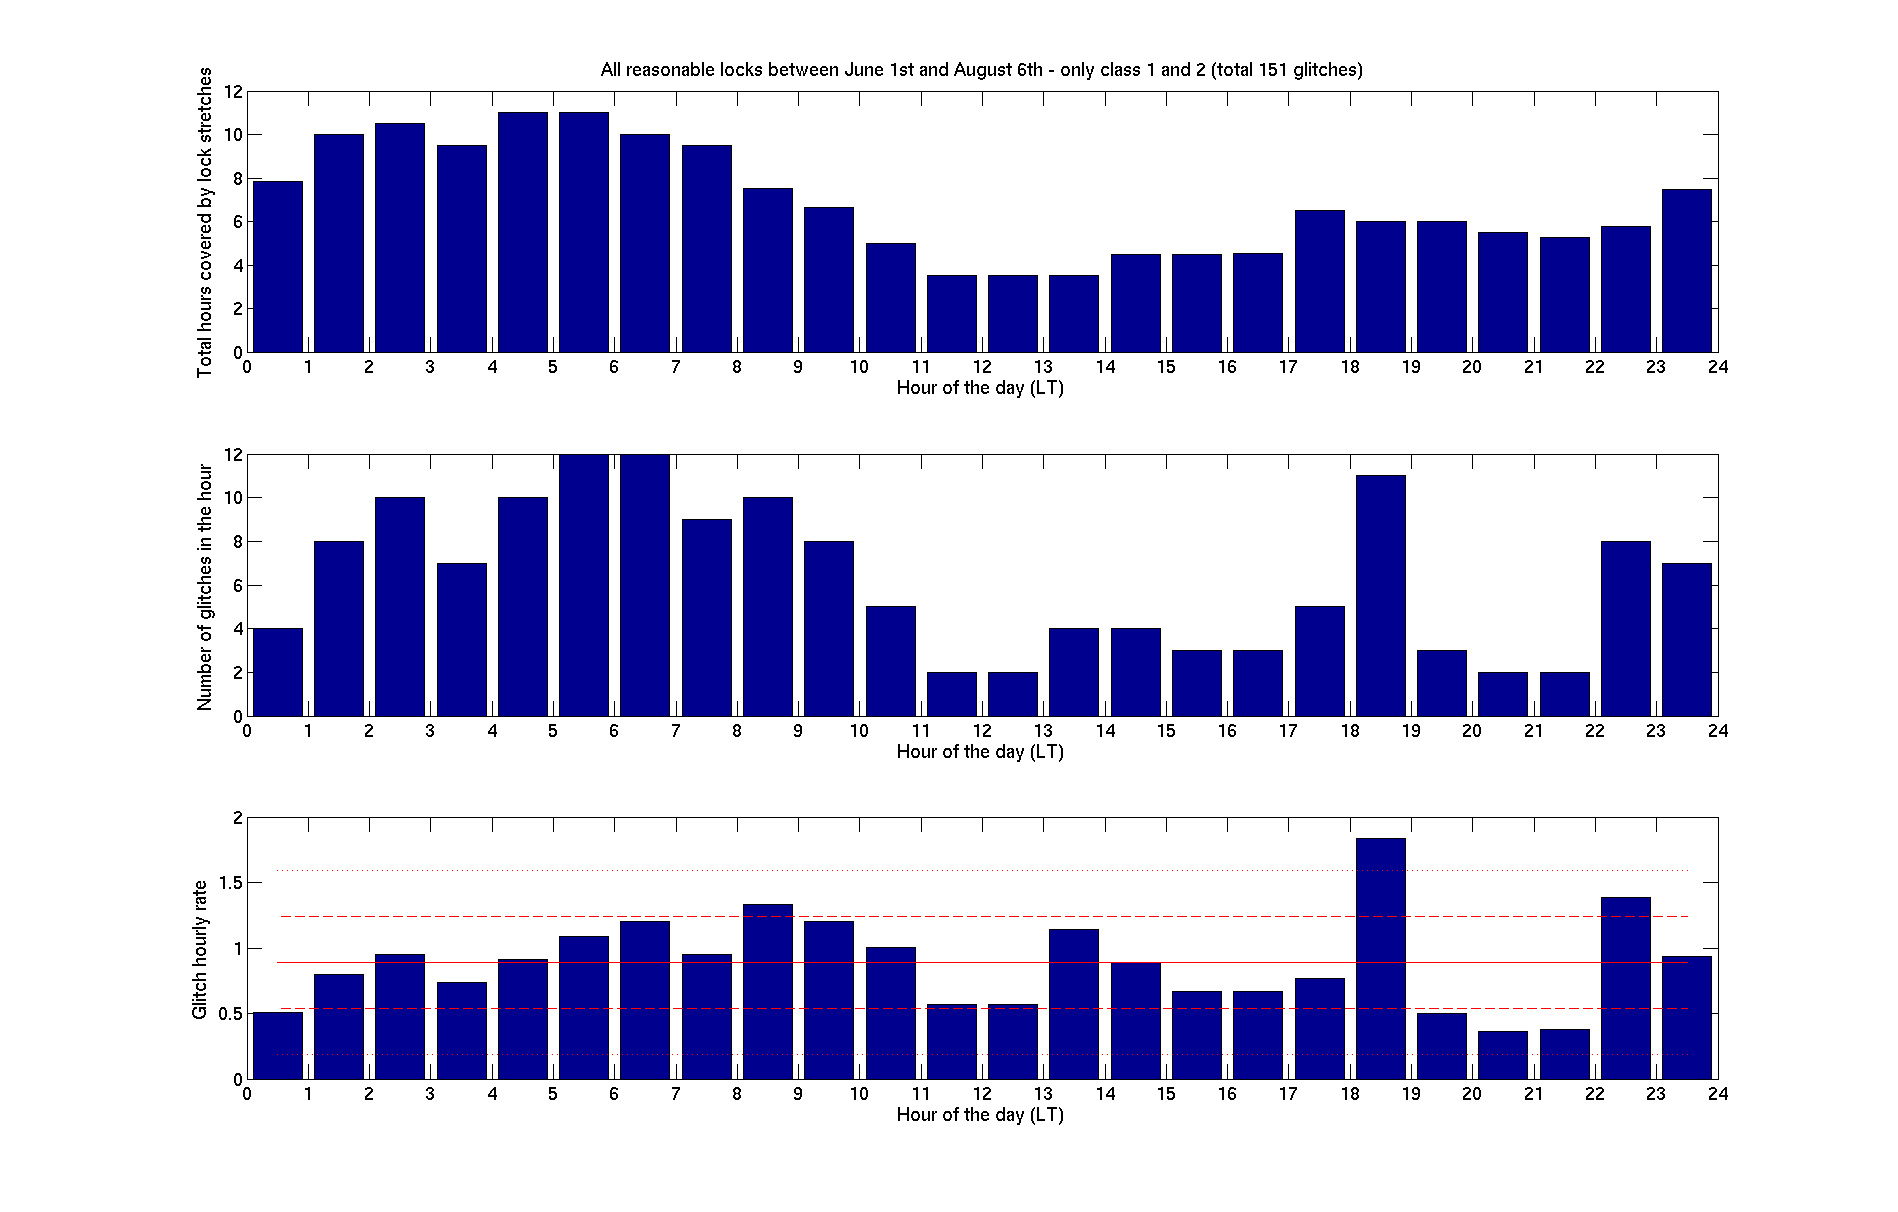
First of all, I wanted to understand if those loud glitches, regardless of their shape and origin, are clustered in particular hours of the day. The first attached figure shows three histograms:
- the top one is telling you how many hours of lock have been selected for each period of time. So the first histogram is telling you that my analysis covered about total 8 hours of data between 0 am and 1 am every morning (collected over the two months), about 10 hours between 1 am and 2 am, etc...
- the middle histogram is the count of loud glitches in the corresponding period of time, regardless of the day. So it is telling you that, over the two months, we had 11 glitches happening between 0 am and 1 am, and so on...
- the third histogram shows the ratio of the second over the first, so basically it's an estimate of the hourly glitch rate as a function of the time of the day, in local time. The red solid line is the average over the whole day, the dashed and dotted lines correspond to one and two standard deviations
I don't see any dramatic clustering, however it seems that there are a bit more glitches happening between 5pm and 8pm. Not very significant though. Morevoer, remember that this analysis covers all locks that I judged to be good, without having any information on the activity of the commissioners.
Statistics during ER7 and not-ER7
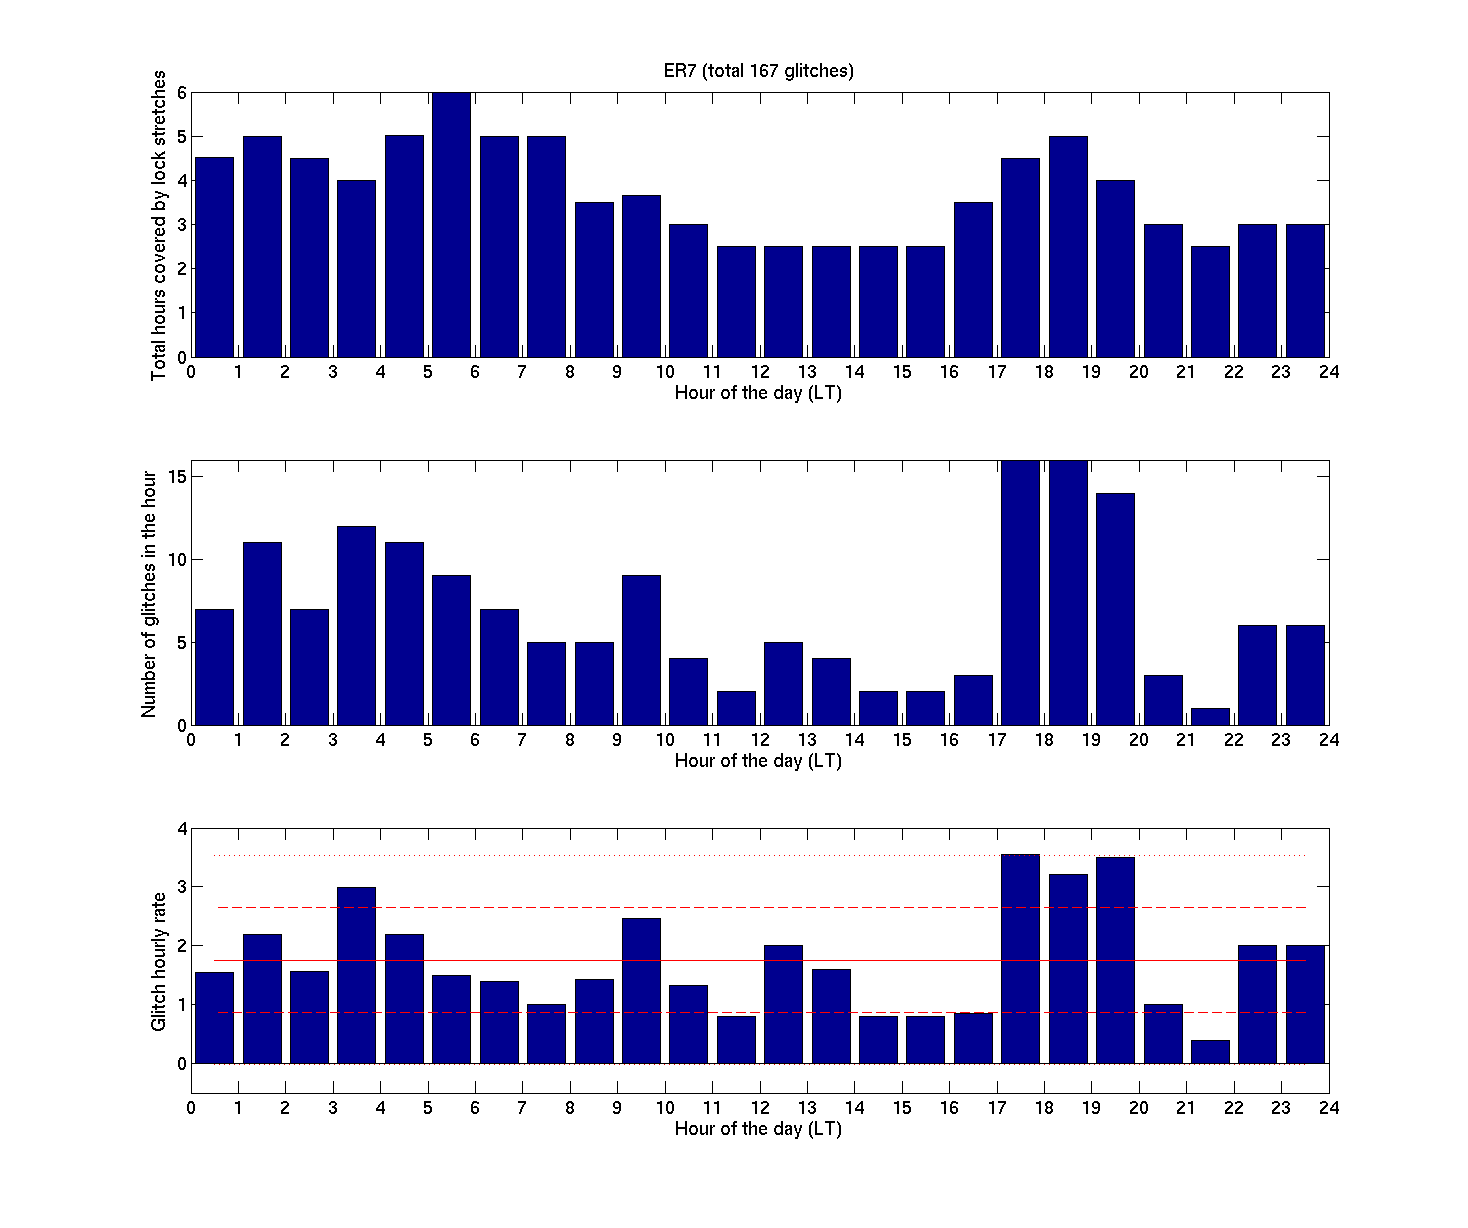
The second attached plot is the same kind of histogram, but here I restricted the analysis to the period of time marked as ER7 (between GPS 1117400416 and GPS 1118329216). This should be a more controlled period, without too much commissioning or tube cleaning. A total of 167 glitches were identified in this period.
Basically, the same daily distribution as before is visible, altough the predominance of 5pm-8pm is somewhat lower.
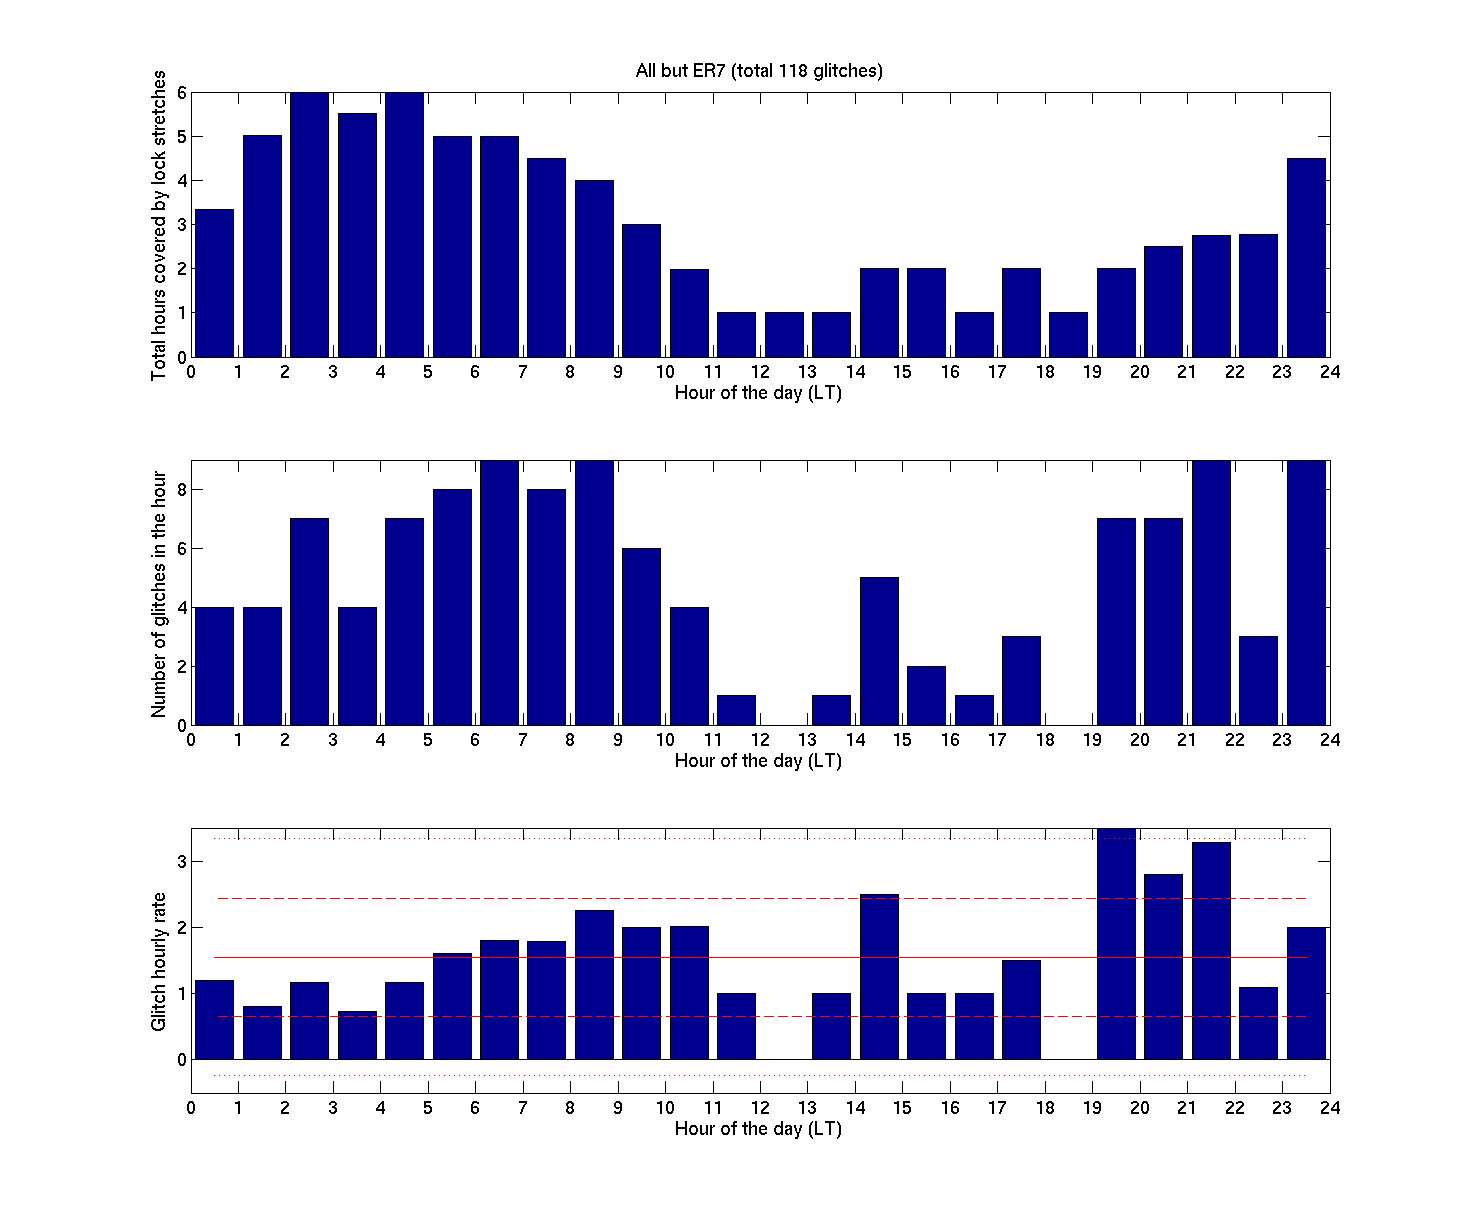
The third attached plot shows the same histogram again, but for all the non ER7 periods. It looks like the dominant periods are later in the night, between 7pm and 10pm.
In conclusion, I don't see any striking dependency on the time of the day.
Glitch classification
I looked into the 285 glitches one by one, to try a classification based on their shape. The kind of glitches we are hunting down have a very clear shape, as pointed out by Keita. Here is my classification system:
Class 0: unidentified origin (not clear what caused the range to drop...)
Class 1: like the glitches we are looking for, but kind of small and sometimes not completely certain
Class 2: definitely the glitches we are looking for
Class 3: somewhat slower glitches, with a duration of 10-100 ms
Class 5: general noise increase on a longer time scale (seconds)
Class 6: messy things, including clear human actions (swept sines, etc..)
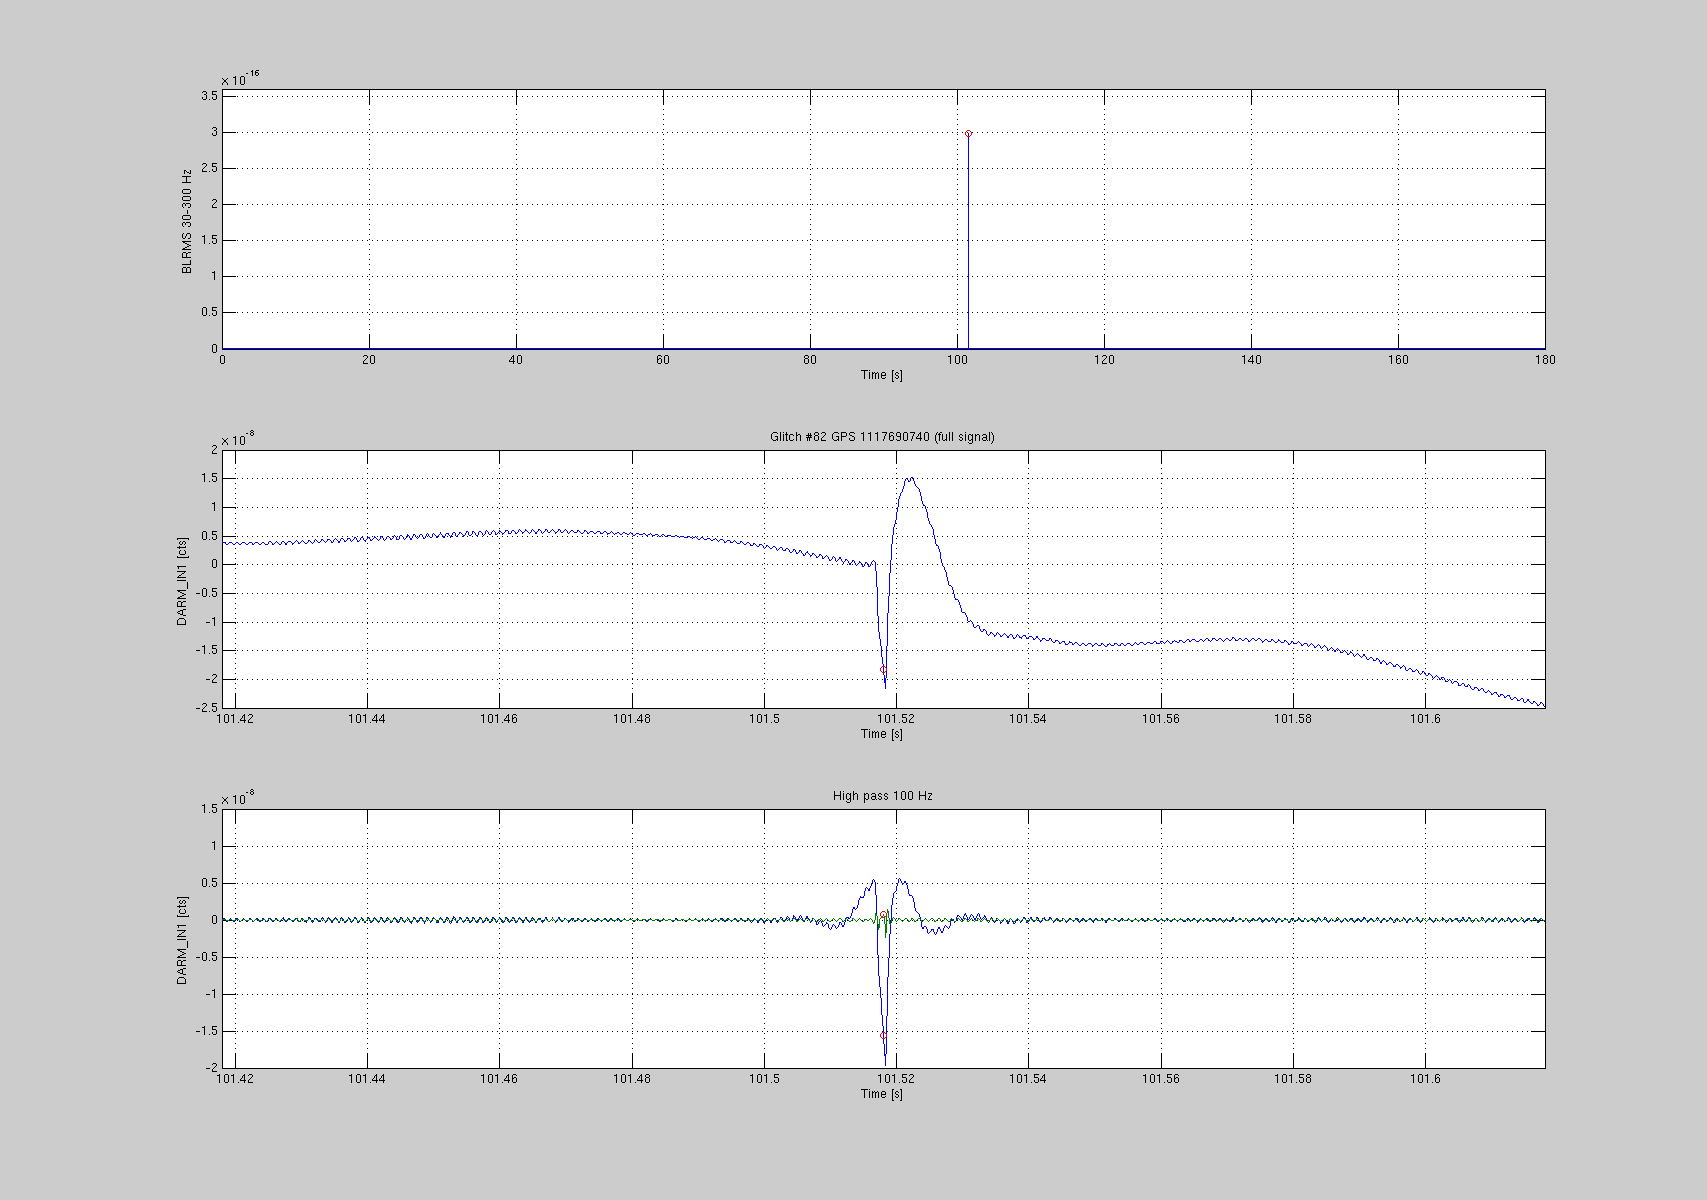
The classification is based on the behavor of the BLRMS in the 30-300 Hz band, the time series, and a 100Hz high passed time series.
In total, I could identify 151 glitches of class 1 and 2, that most likely corresponds to what we are looking for. Attached figures 4 and 5 show two examples of class 1 and class 2 glitches. I saved similar plots for all 285 glitches, so ask me if you are interested to see all of them.
Statistics of class 1 and 2 glitches
I repeated the same stastistical analysis described above, but this time using only class 1 and 2 glitches. The 6th attached plot shows the dependency on the time of the day. Unclear to me if there is anything significant. The peak is betwen 6pm and 7pm...
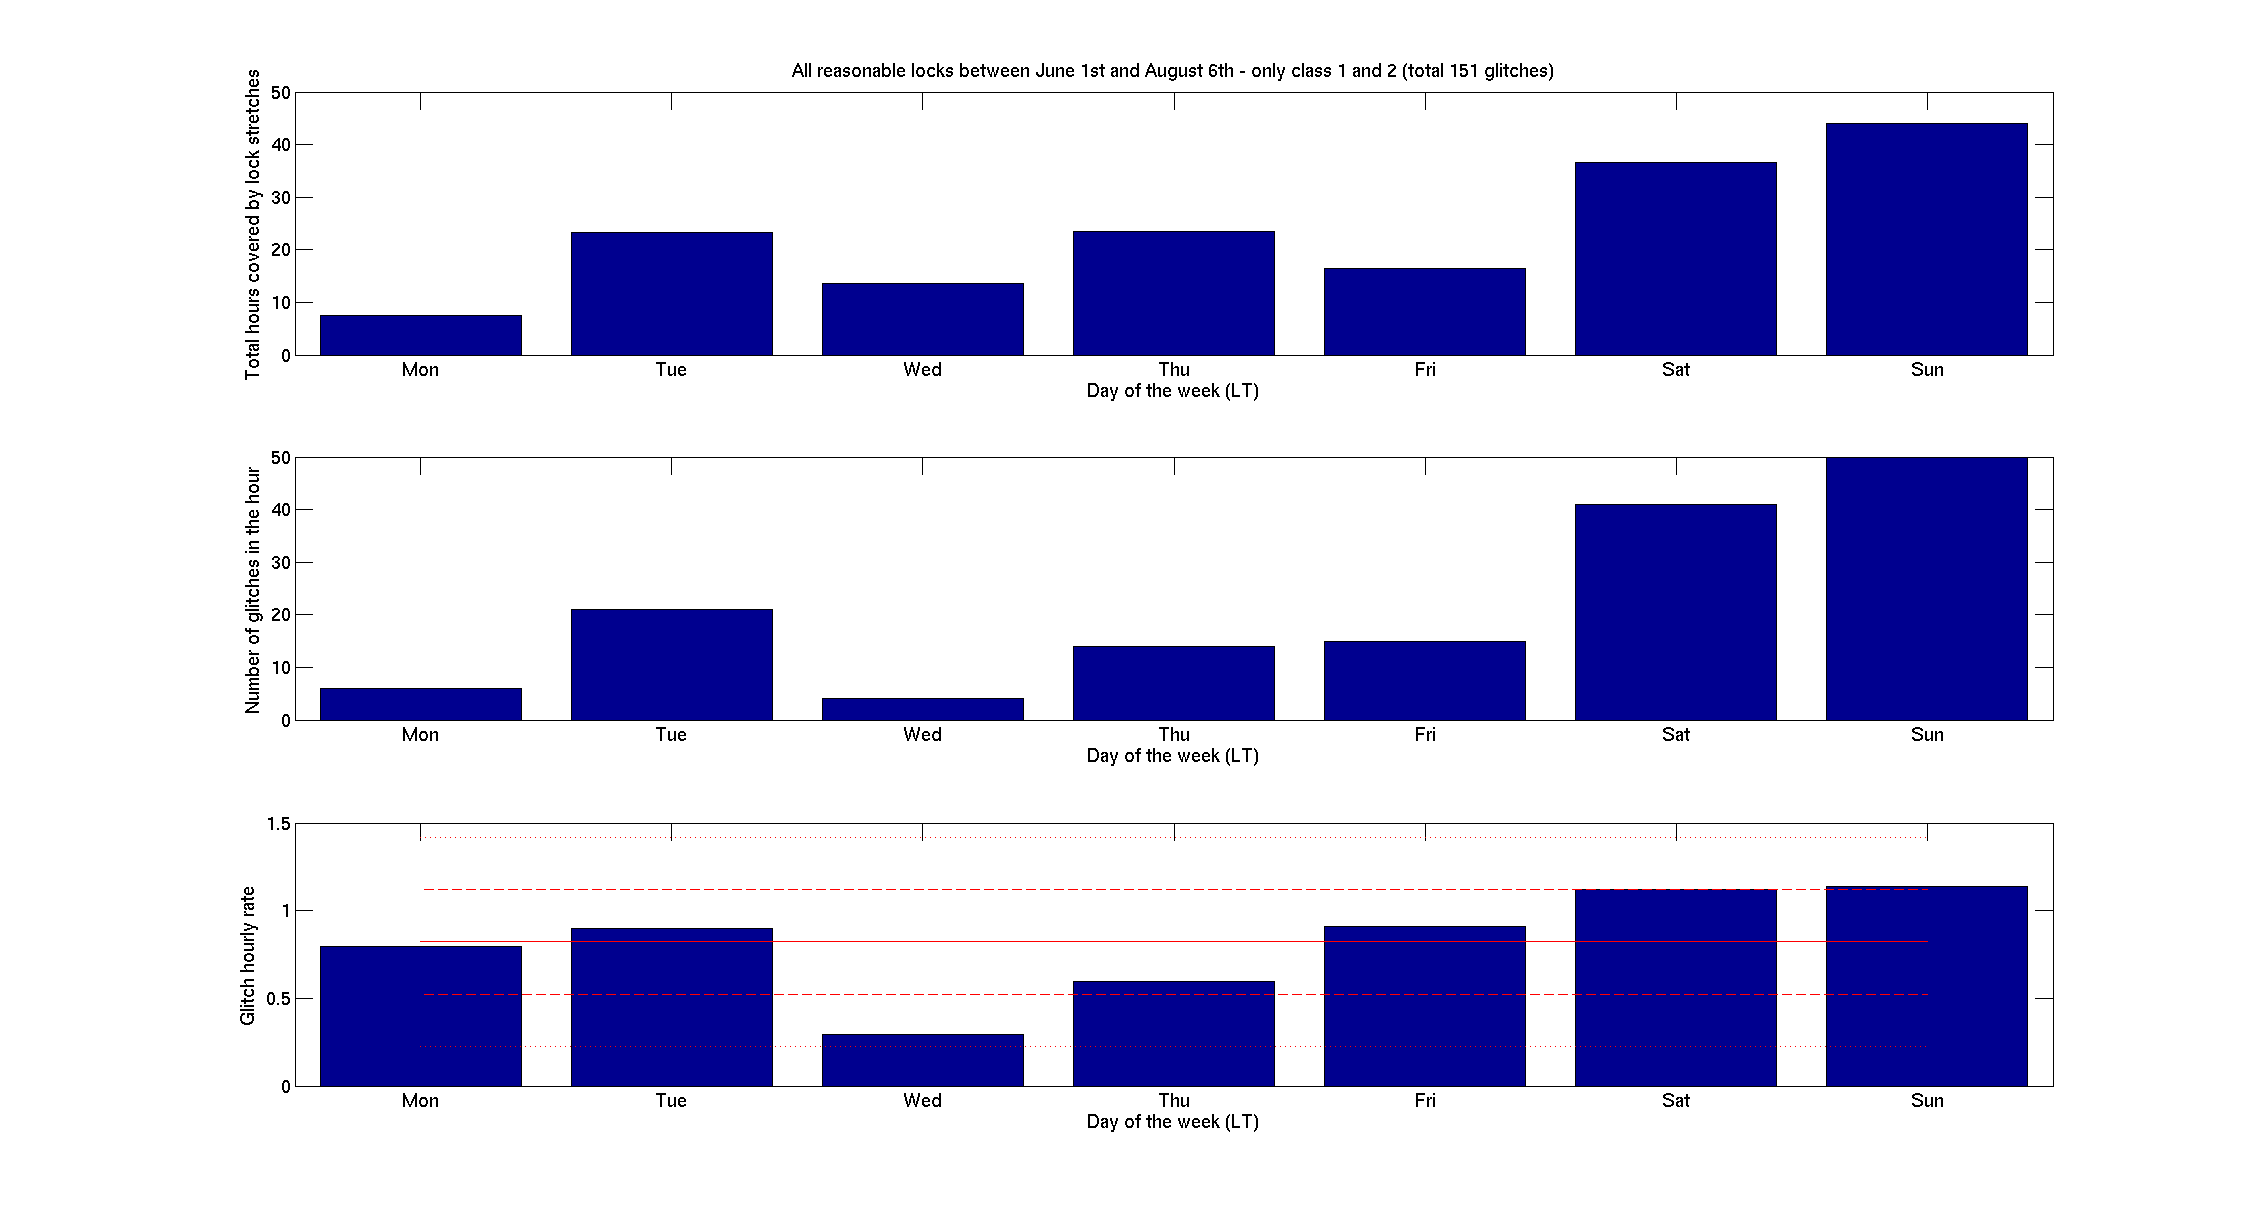
I also checked if there is a correlation with the day of the week, see the 7th plot. Not clear either, altough it seems excluded that there are less glitches over the weekend. It's more likely the contrary.
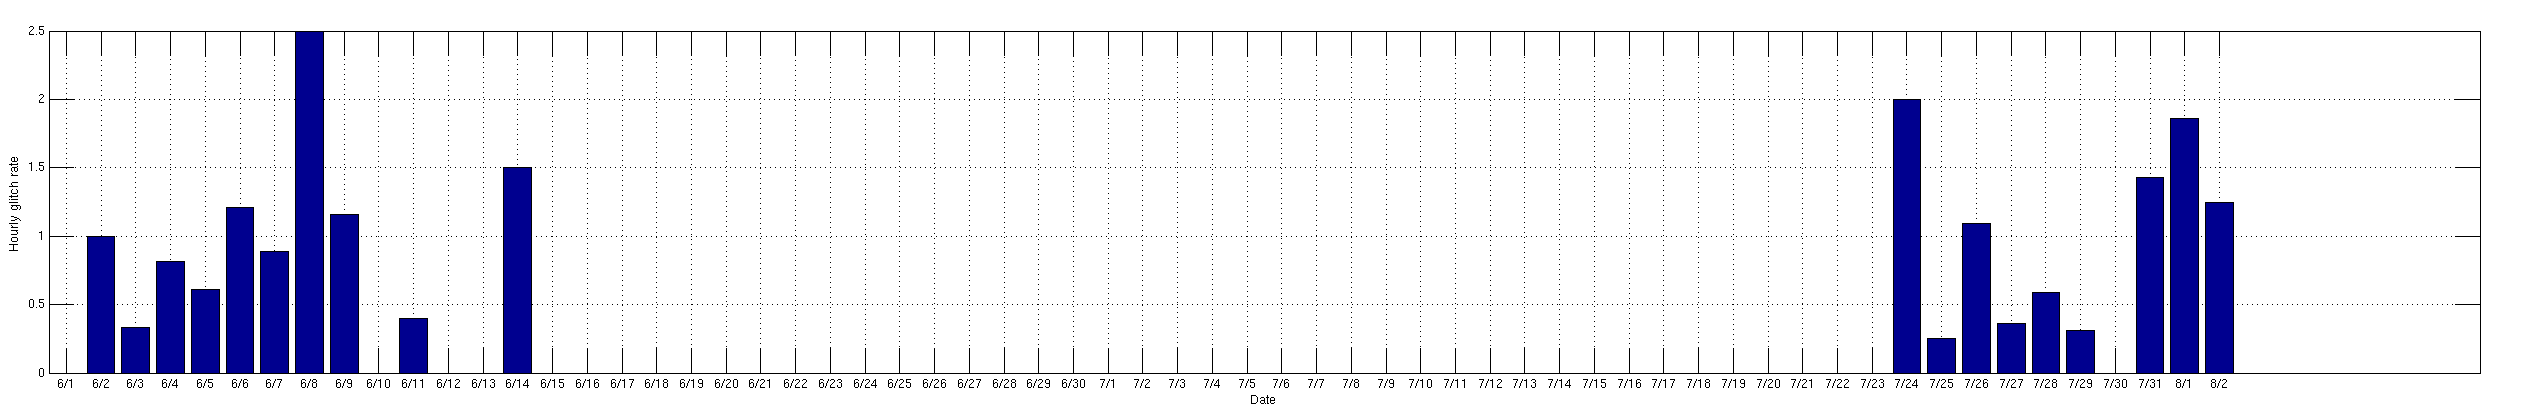
Finally, the very last plot shows the glitch rate as a function of the date. It seems that three days were particularly glitchy: June 8th, July 25th and August 1st.