Let's add some statistical information on the loud glitches we've been investigating lately (see 20176, 20276, 20304).
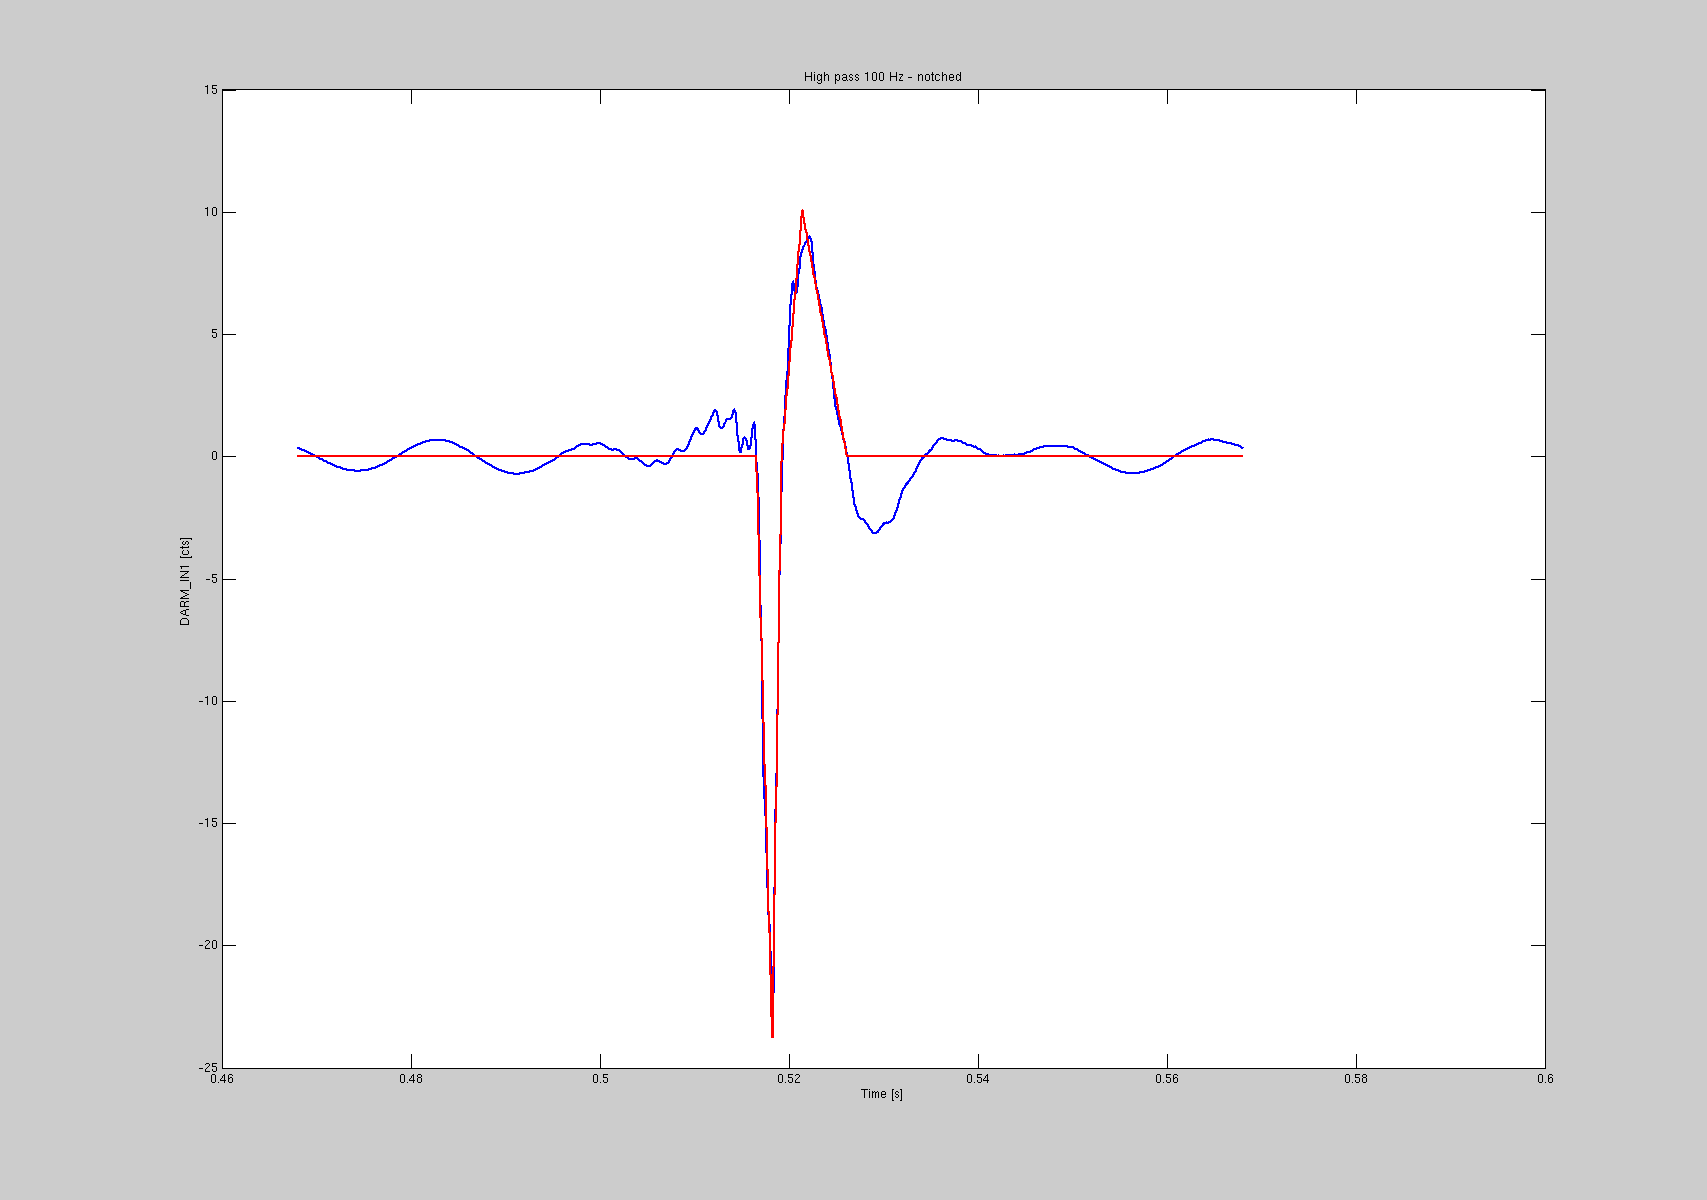
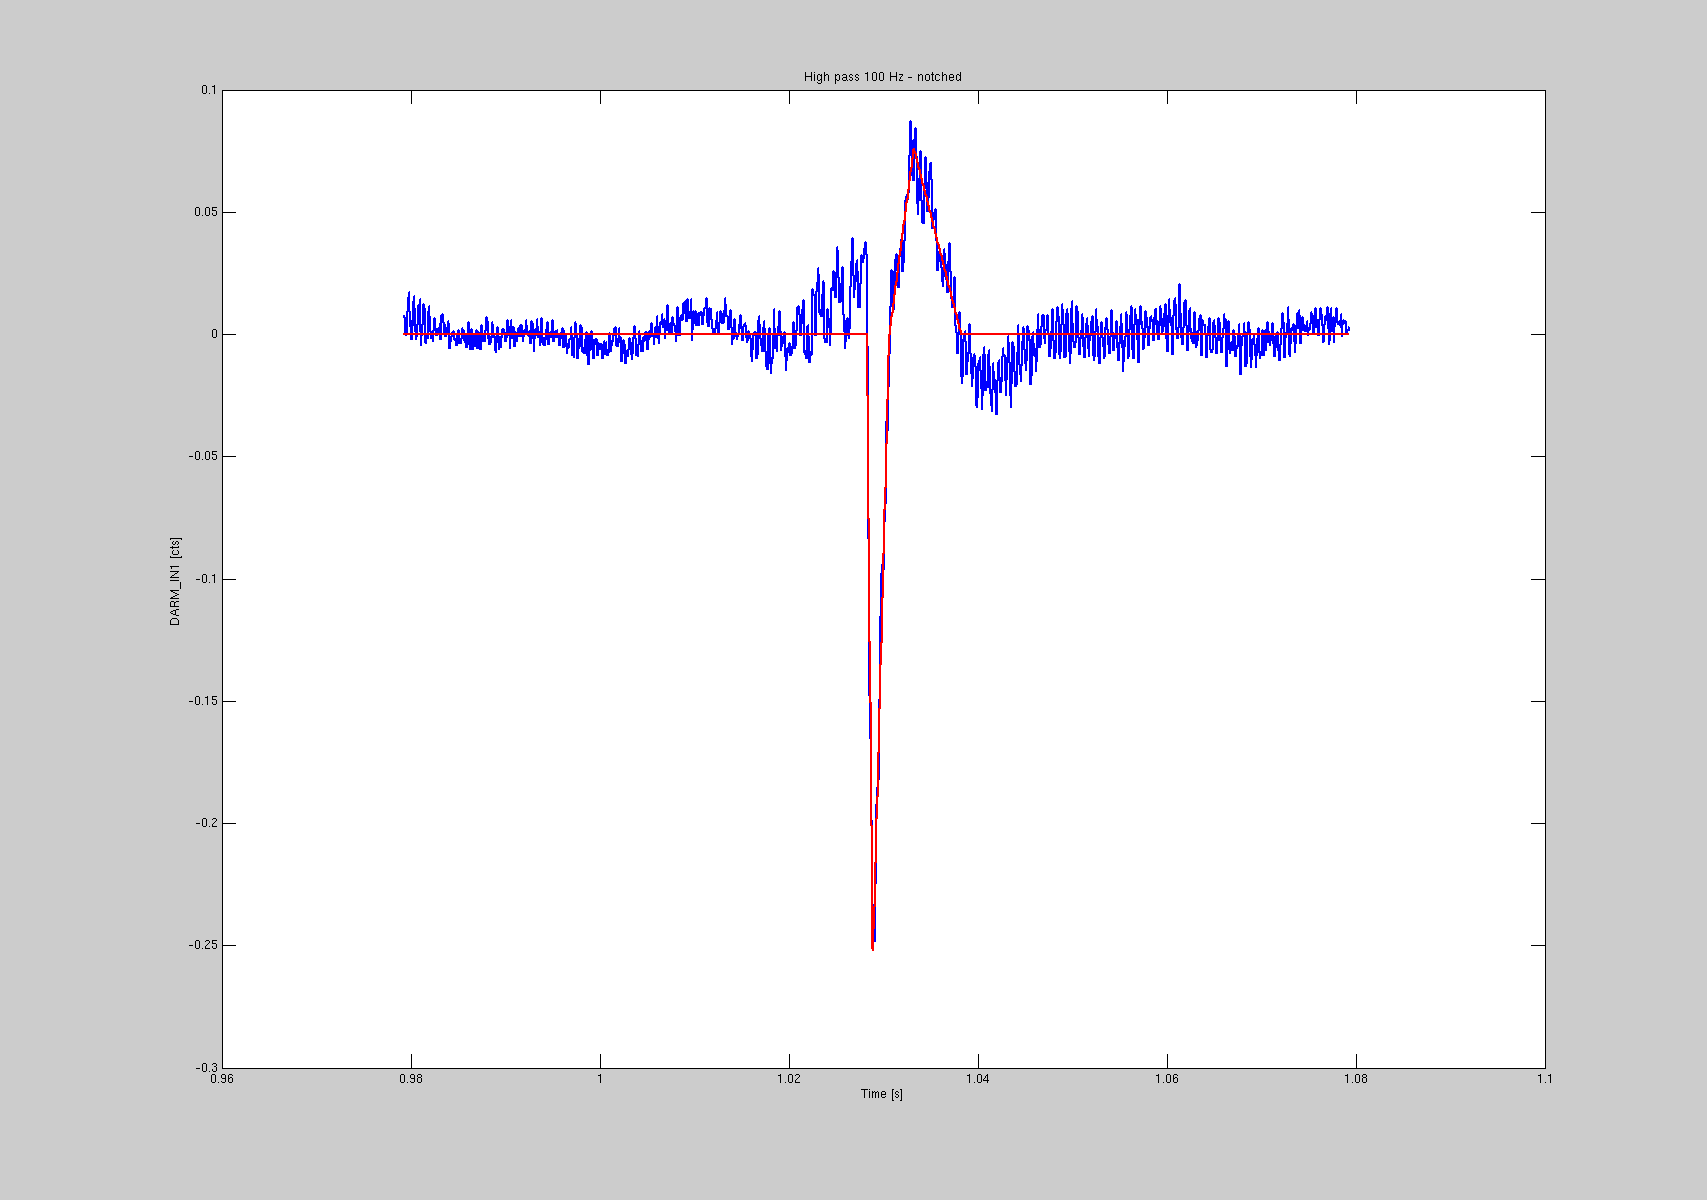
All those glitches have a very distinctive shape: a sharp peak rising in about 1ms and decaying in about 1ms, followed by what we believe is the DARM loop response: a second slower peak of opposite sign.
I looked into all the glitches I previously identified, and run a MATLAB script to fit them with the above shape. What I'm fitting is a 100 Hz high passed DARM_IN1_DQ signal, with additional notches at 60, 502, 992, 1000, 1462 and 2450 Hz. The parameters are the rising and decay times of the first peak, its amplitude, the rising and decay times of the second peak and its amplitude. The waveform is the sum of two triangles. See for example the first two plots for a large and a small glitch.
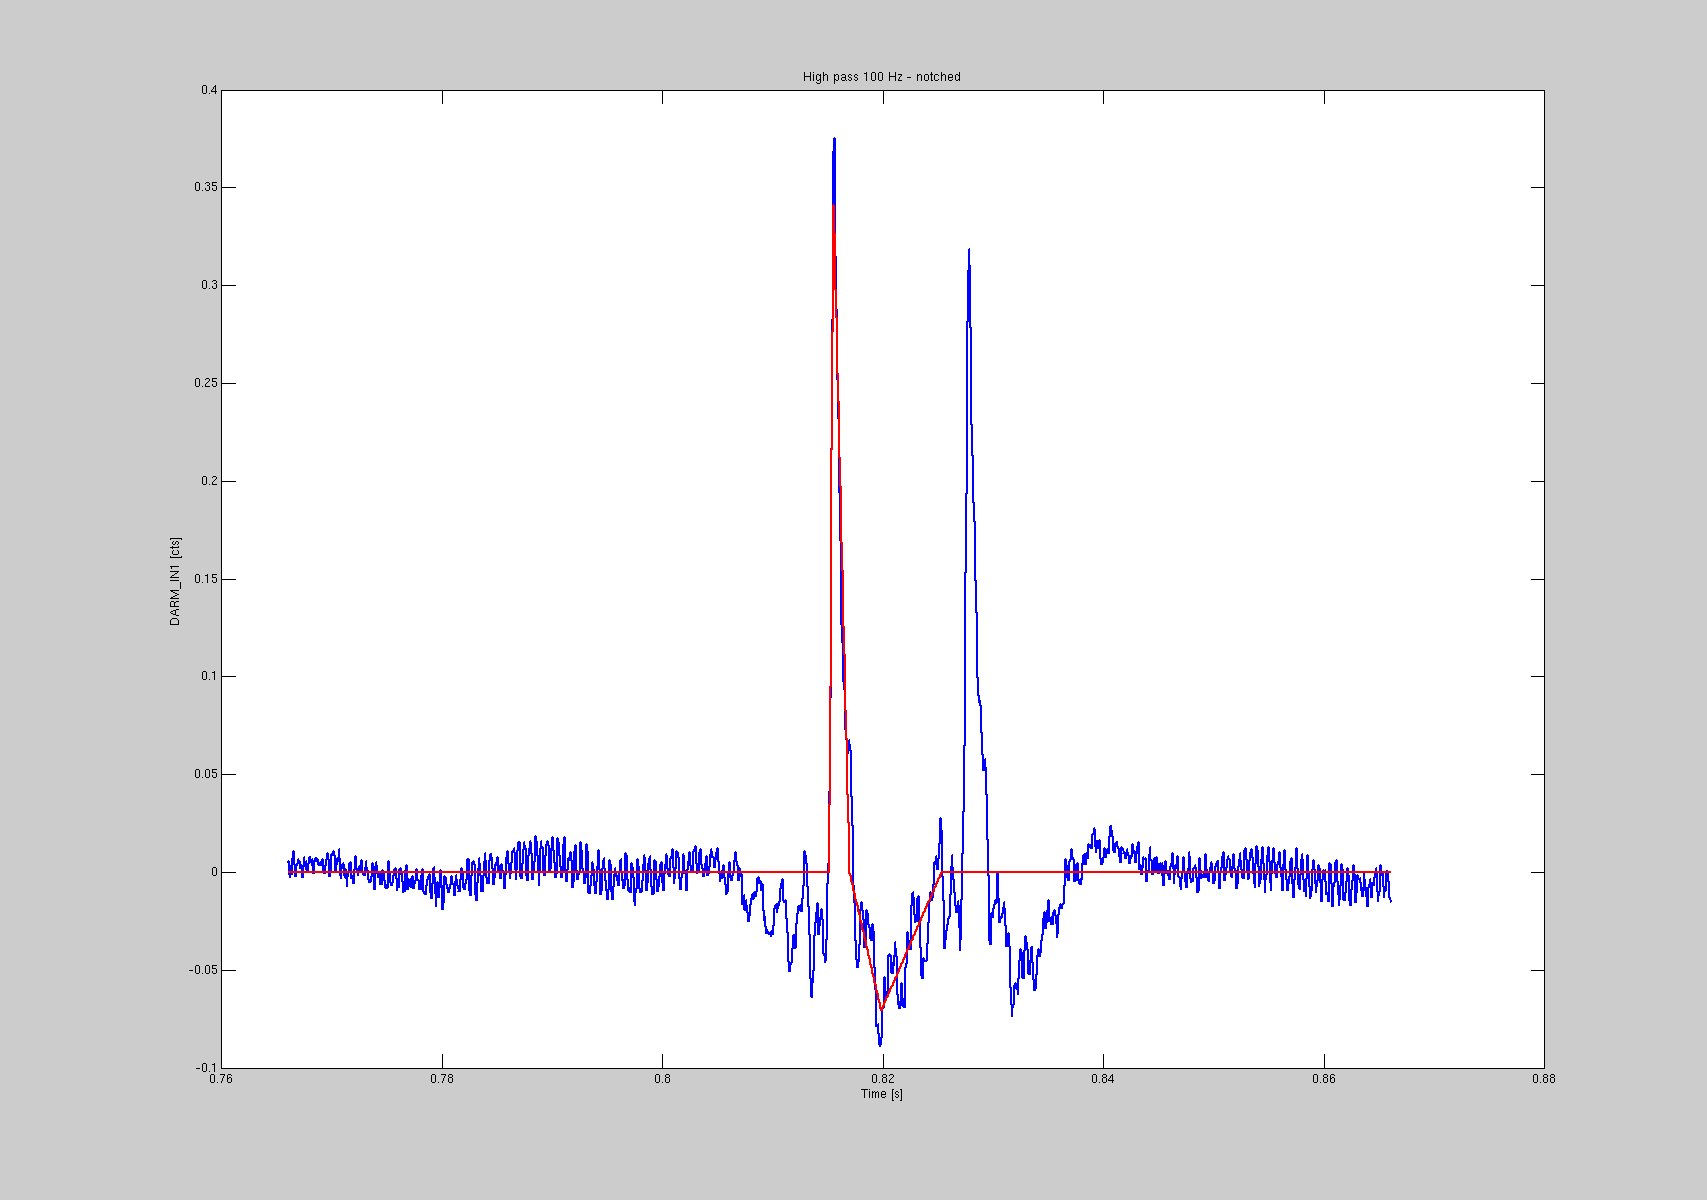
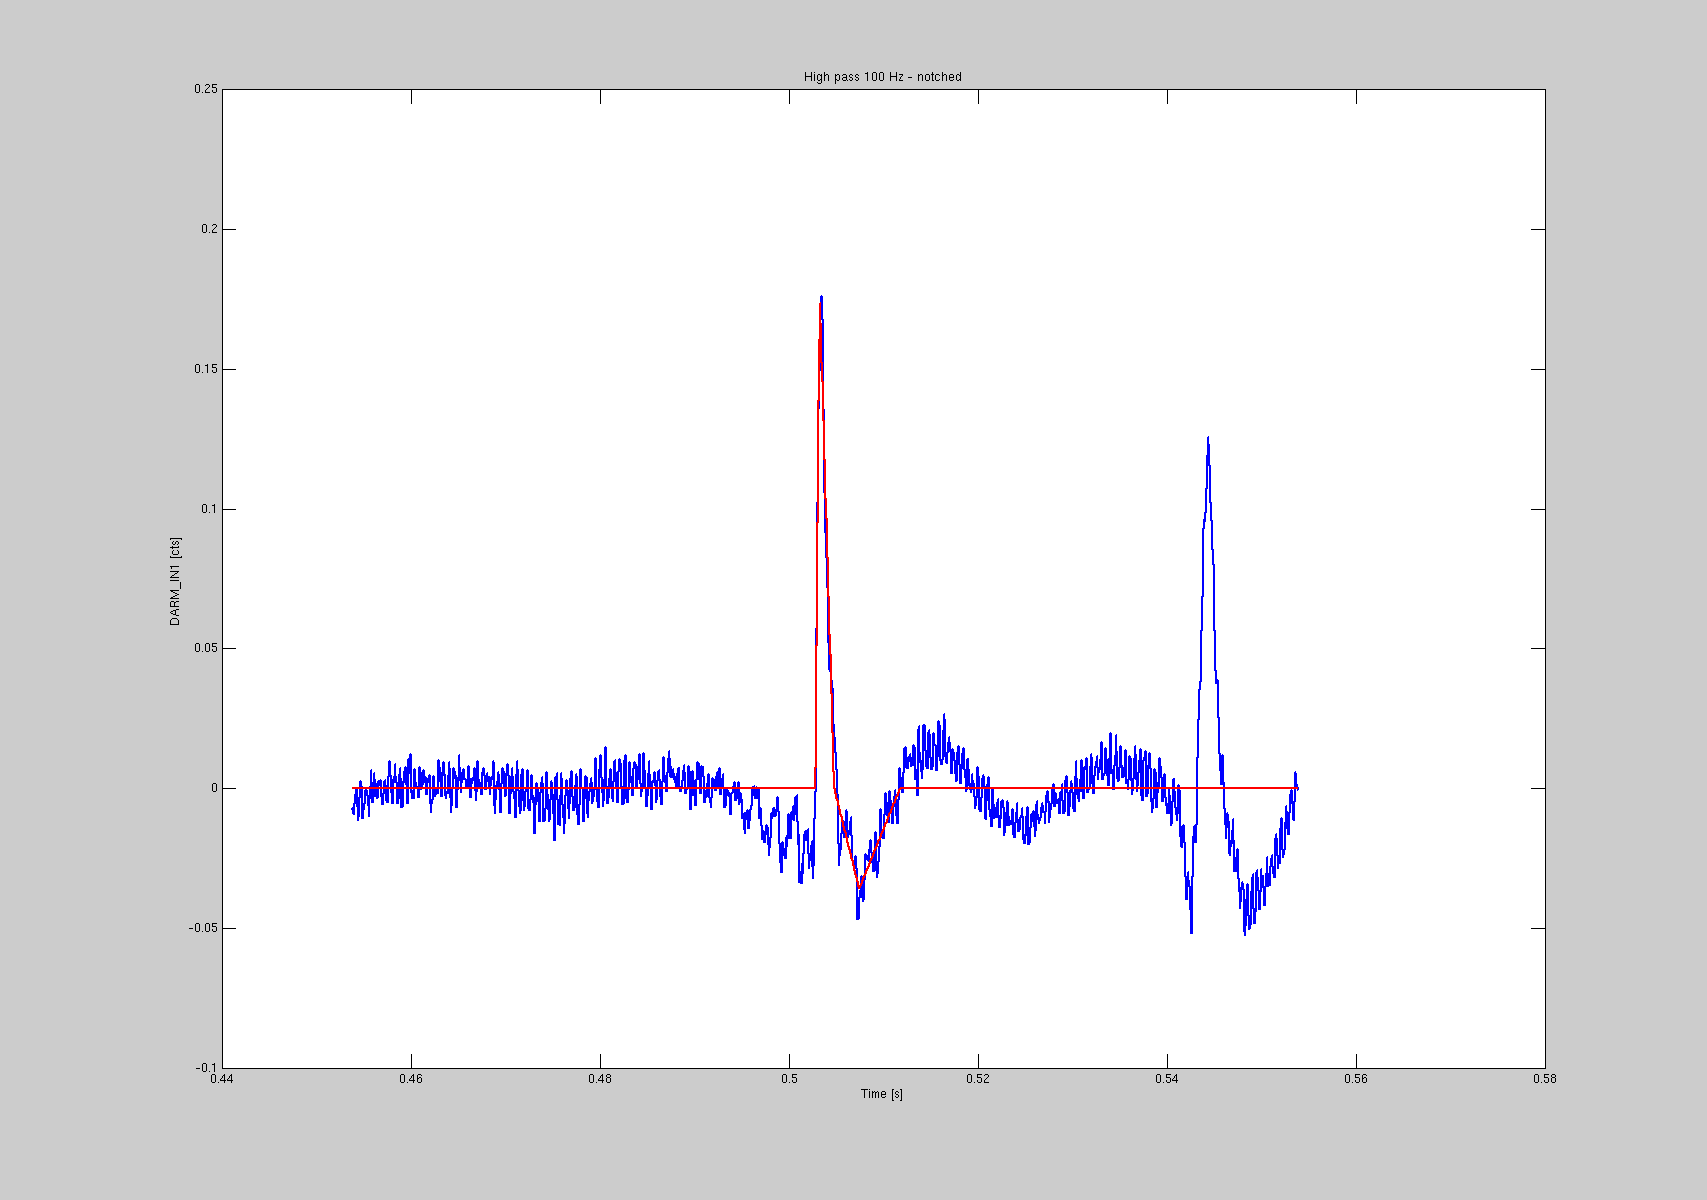
After fitting all the 151 glitches, I actually convinced myself that 13 of them were probably of another kind, since the shape was clearly different. In two occasions (GPS 1117616943 and 1117631610) there were double glitches (see 3rd and 4th plots).
Armed with the results of the fit, I can now look at the distribution of the amplitudes with sign and of the duration. The 5th plot shows an histogram of the amplitudes. Result: there are both positive and negative amplitude glitches, but large amplitude glitches are only negative (in DARM_IN1_DQ).
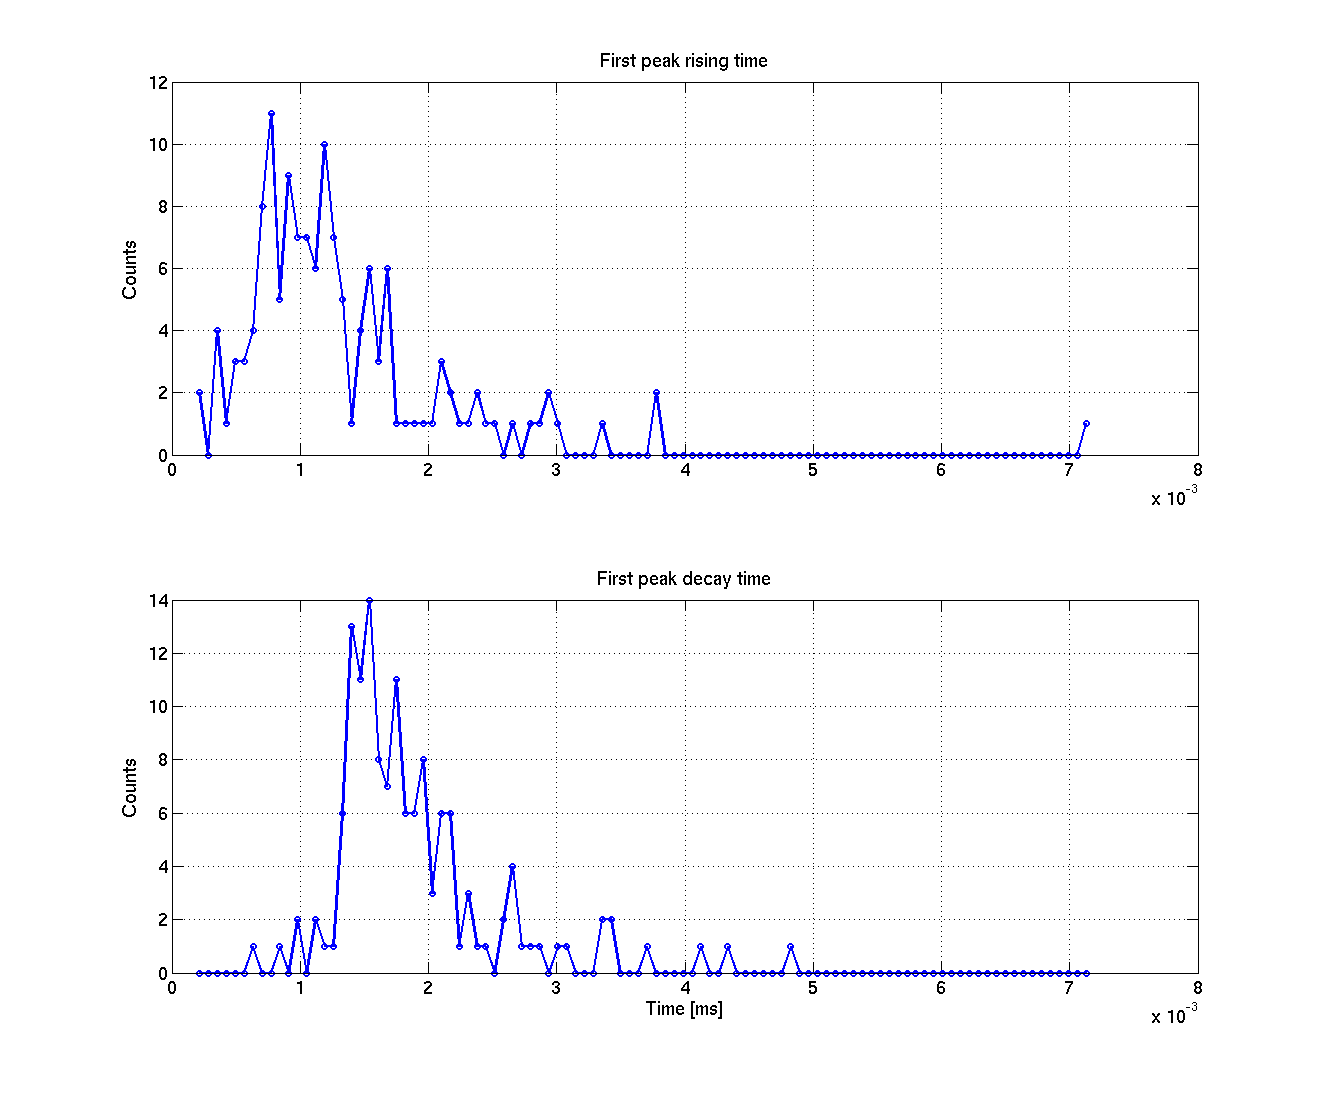
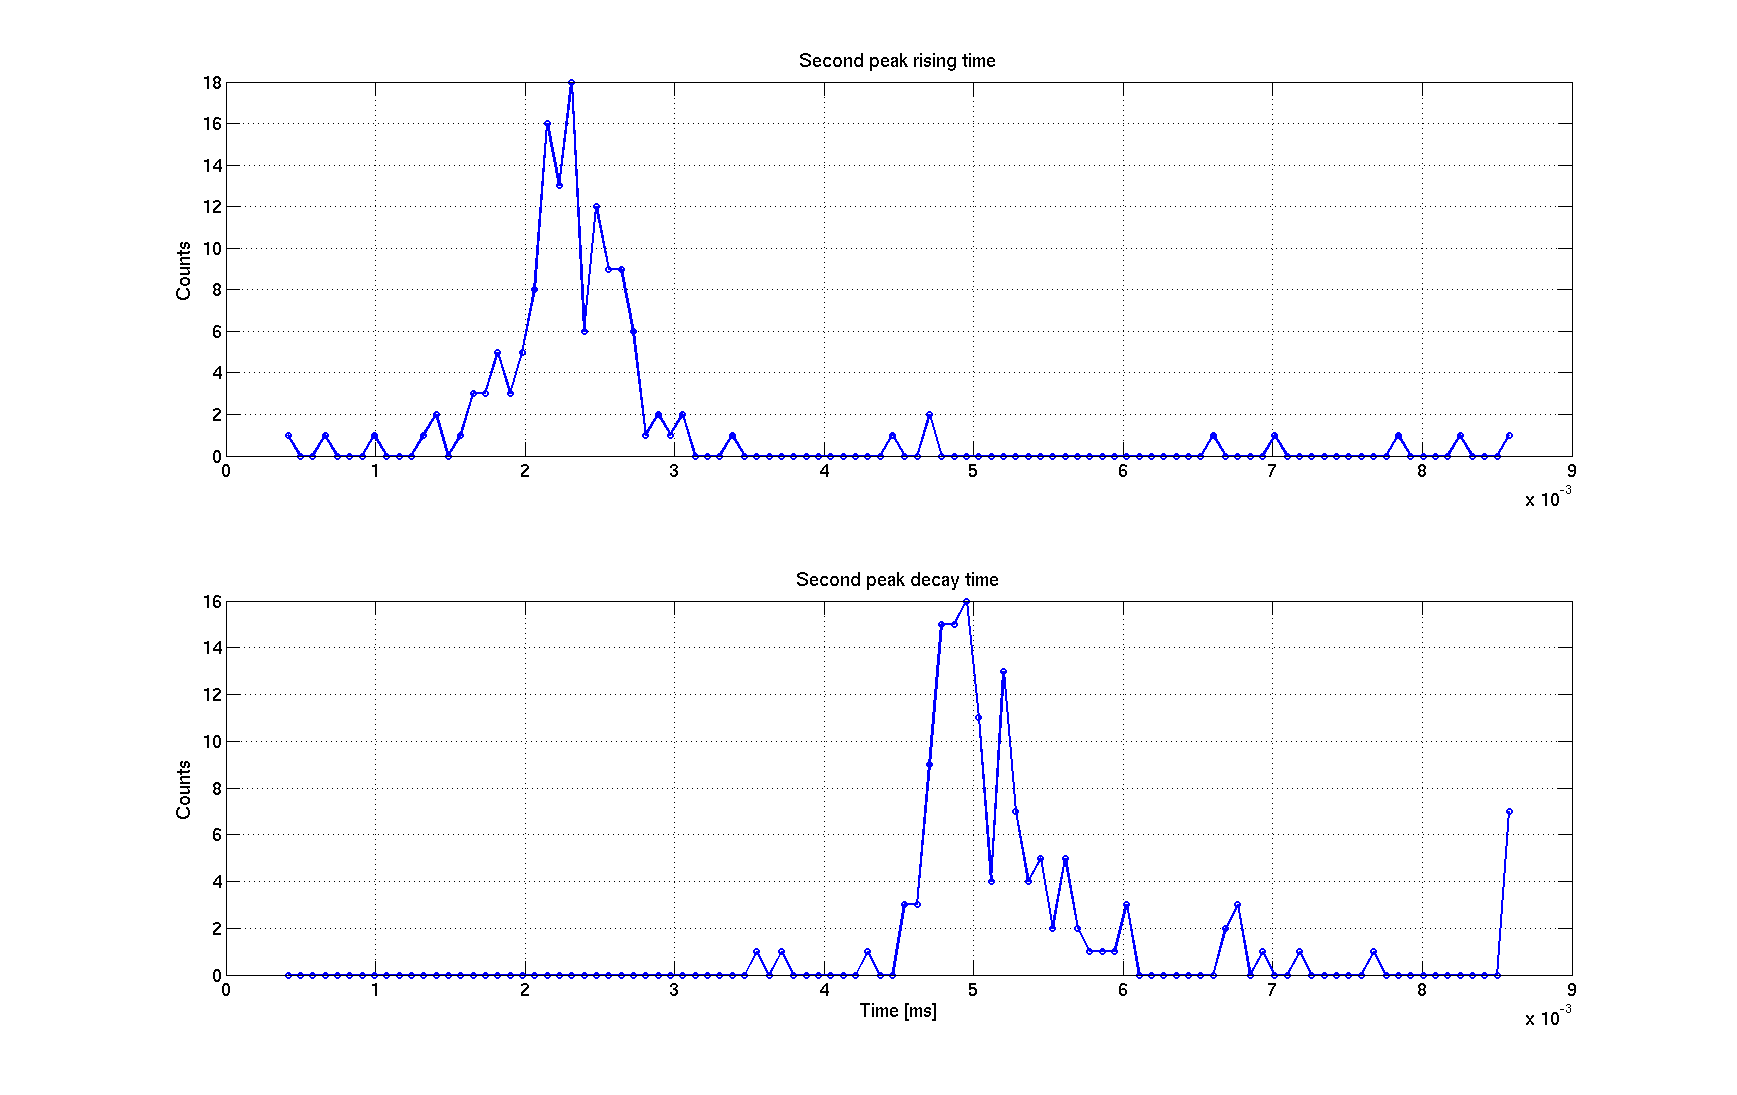
The 6th plot shows the distribution of the rising and decay times of the first peak. The distribution is quite well peaked around 1 ms for the rising time and 1.5 ms for the decay time. For the second peak, rising times are peaked around 2.3 ms and decay times around 5 ms.
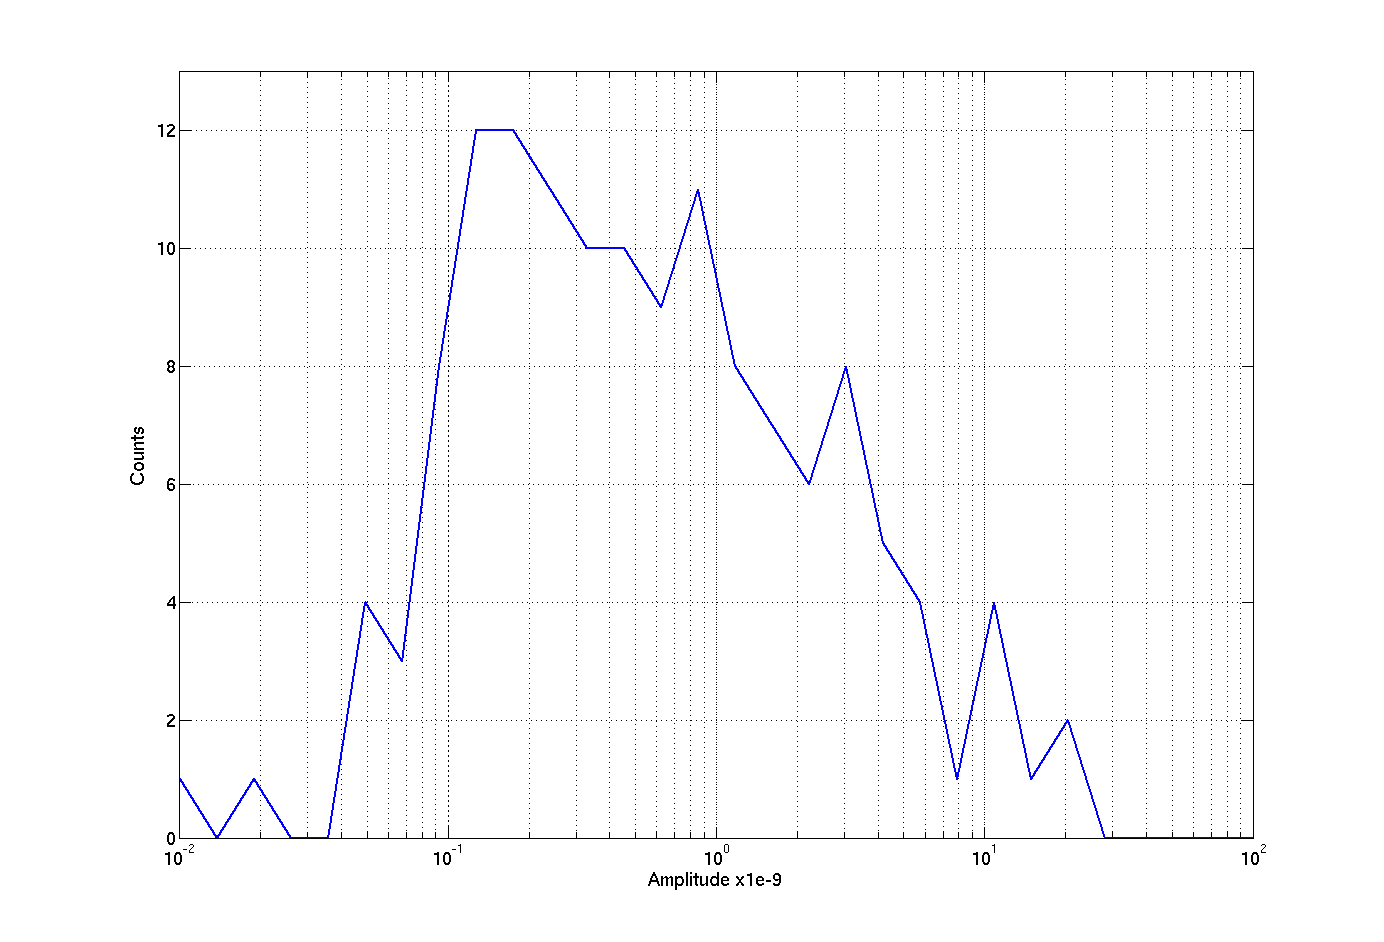
The last attached plot shows a distribution of the absolute value of the glitch amplitudes, in log scale. The low amplitude cut-off is likely due to my inability to detect the smallest glitches (and the threshold of 5 Mpc drop in the range). The amplitudes span a couple of orders of magnitude, with a quite smooth distribution. I see no reason why we shouldn't believe that there are many more low amplitude glitches with the same shape (and maybe origin) that we simply can't detect in this way.
The attached text file contains all the results of the analysis:
Column 1: GPS time
Column 2: amplitude of the first peak
Column 3: rising time of the first peak [ms]
Column 4: decay time of the second peak [ms]
Column 5: amplitude of the second peak
Column 6: rising time of the second peak [ms]
Column 7: decay time of the second peak [ms]
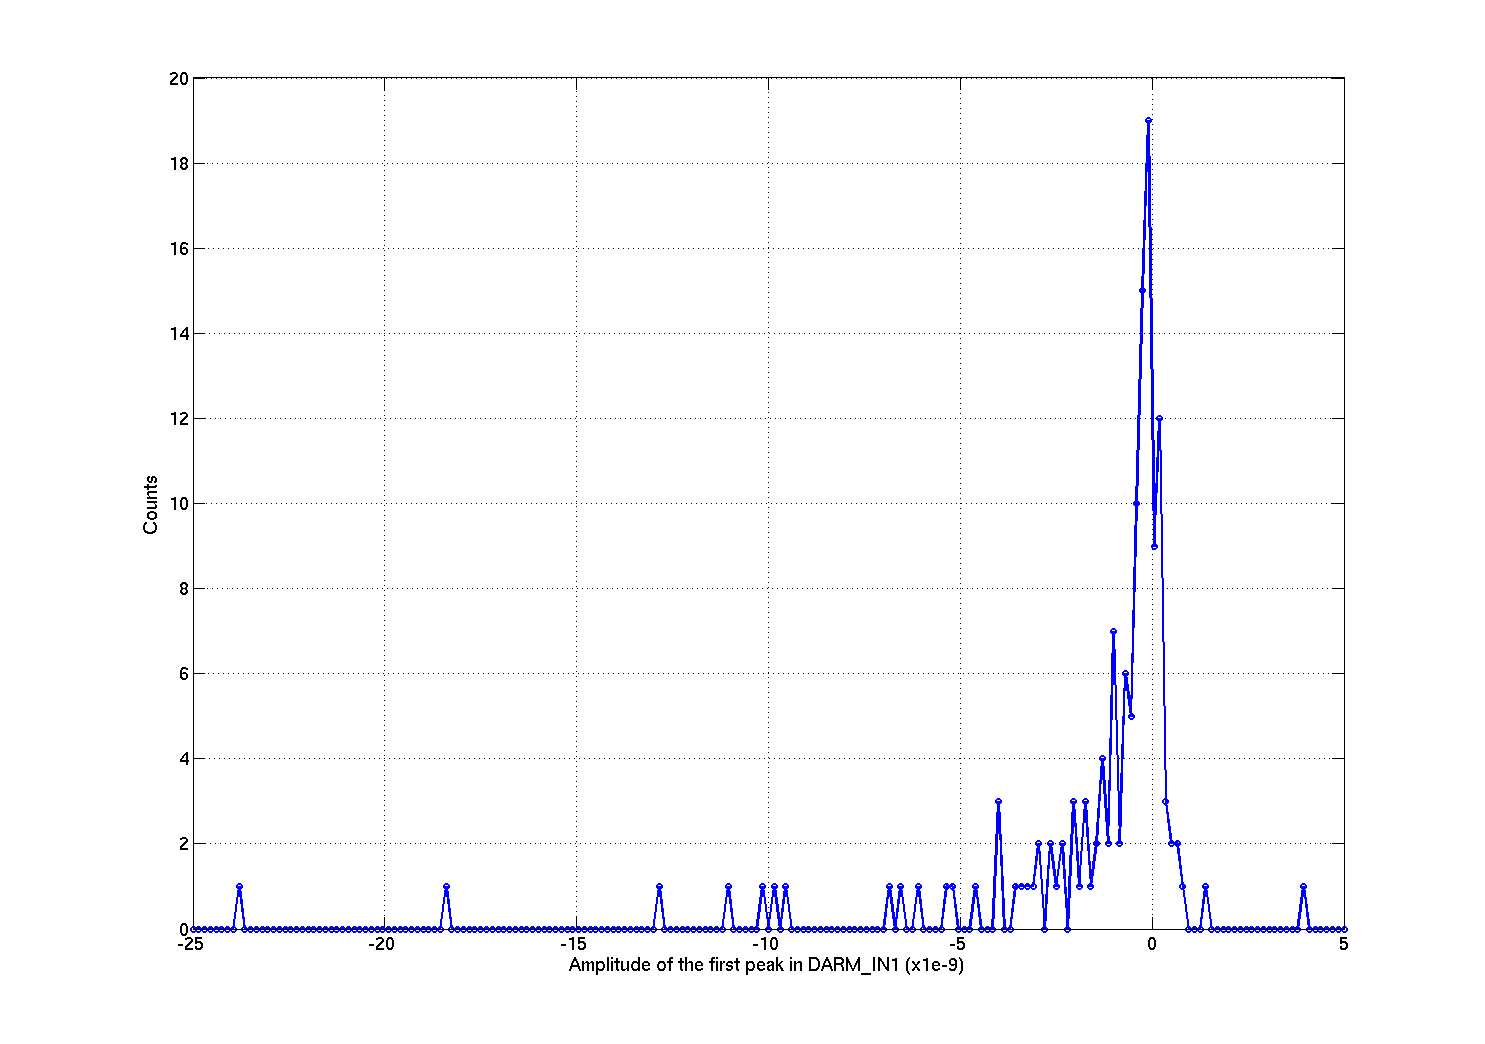


Note that positive spike in DC current = negative spike in DARM_IN1.
So it seems like DC current always spikes up for large glitches.