I injected particulate by tapping on the beam tube at various locations with a scissors, imitating the taps that the cleaners make by accident. The acceleration measured on the beam tube for similar taps was around 0.1 g with a frequency peak at about 1000 Hz (Link). At each location I made the first tap at the top of the minute and made a tap at every multiple of 5 seconds for 1 or 2 minutes. My tapping uncertainty was about 1 second.
To observe the glitches in DARM I filtered the time series of H1:CAL-DELTA_RESIDUAL_DQ to be dominated by the 120-1000 Hz band, with violin modes notched. The table shows the time and the fraction of taps that made glitches. The distribution of glitch sizes is shown in the Figure. There were roughly the same number of glitches in each size decade.
In summary:
1) Glitches were produced from most regions of the beam tube.
2) Only about 20% of taps produced glitches
3) 9/252 taps produced multiple glitches
4) Only 1 glitch of size comparable to the particulate glitches was observed more than 1s from a tap time in the entire 2 hour lock (DetChar may want to double check this). Thus the data suggest that there is not a reservoir of particles that are freed by the taps but fall later at an exponentially decreasing rate (so it is very unlikely that midnight glitches are particles freed by cleaning and cleaning is unlikely to have increased the background rate).
5) The figure shows that the number of glitches in each size decade was about the same, not increasing with smaller size.
|
Location on beamtube |
Time of first tap. Aug. 8 UTC |
Tap spacing (seconds) |
Duration (minutes) |
Number of taps |
Large glitches in DARM within 1s |
Large glitches not within 1s |
|
Y2-8 double |
15:52:00 |
5 |
1 |
12 |
4 |
0 |
|
Y2-2 double |
15:57:00 |
5 |
1 |
12 |
2 |
1, 2s |
|
Y1-2 double |
16:02:00 |
5 |
1 |
12 |
5 |
0 |
|
X2-8 double |
16:22:00 |
5 |
2 |
24 |
7 |
0 |
|
X2-2 double |
16:27:00 |
5 |
2 |
24 |
1 |
0 |
|
X1-2 double |
16:33:00 |
5 |
2 |
24 |
0 |
0 |
|
Y2-8 +1Y single |
16:44:00 |
5 |
2 |
24 |
0 |
0 |
|
Y2-4 +1Y single |
16:48:00 |
5 |
2 |
24 |
1 |
0 |
|
Y1-4 +1Y single |
16:53:00 |
5 |
2 |
24 |
13 |
0 |
|
X2-8 +1X single |
17:05:00 |
5 |
2 |
24 |
13 |
0 |
|
X2-4 +1X single |
17:12:00 |
5 |
2 |
24 |
5 |
0 |
|
X1-4 +1X single |
17:18:00 |
5 |
2 |
24 |
5 |
0 |
|
Number of taps that produced glitches (percentage) |
|
|
|
|
42 (17%) |
|
|
Total number of glitches |
|
|
|
|
56 |
|

This is very interesting. Can you sort and plot the raw time series of the larger glitches according to X vs. Y arm? (The attack should be unipolar and of opposite sign for the two arms.)

It will also be interesting to note if there is a FWHM dependence on axial position.
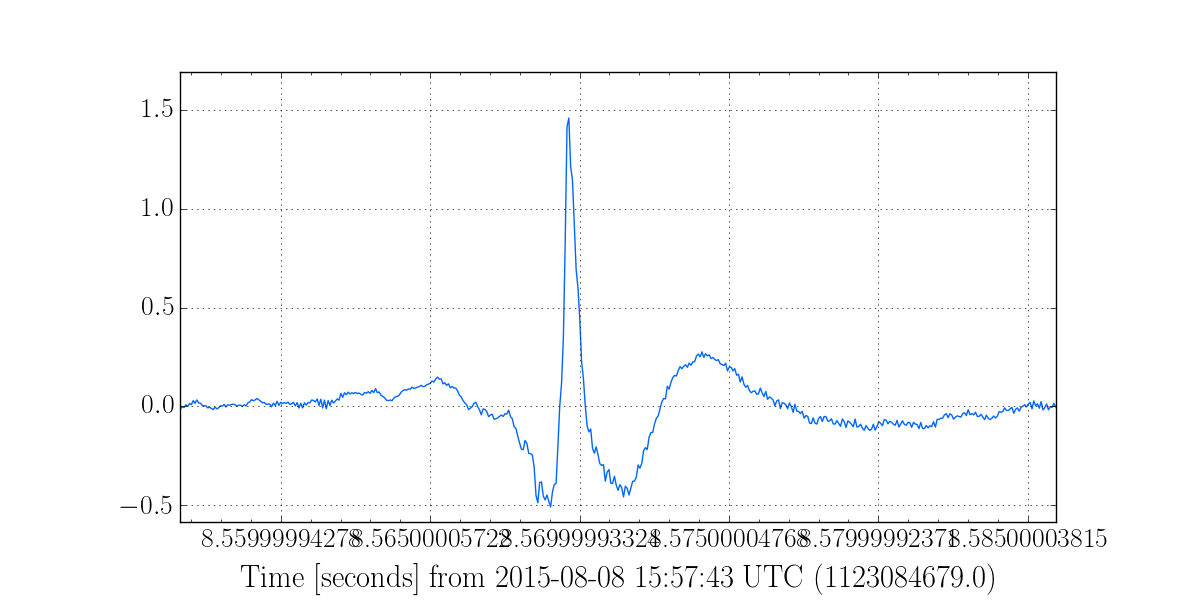
I've attached a list of all Omicron triggers in the lock with SNRs above 100. The columns are the GPS time, peak frequency, and SNR. Rows marked with an X have an ADC overflow in the OMC DCPDs, so they may not be as useful for determining the shape of the glitches. Several of the glitches have very messy shapes in OMC DCPD. There's a few in the Y arm that have a fairly unambiguous single upward spike, for instance 1123084687.570. The whitened timeseries is attached. The shape is a triangle with a base of roughly 1 or 2 milliseconds. I haven't found anything in the X arm yet with a simple unambiguous shape, but I haven't checked everything.