leonid.prokhorov@LIGO.ORG - posted 17:50, Monday 10 August 2015 (20387)
OPLEV charge measurements
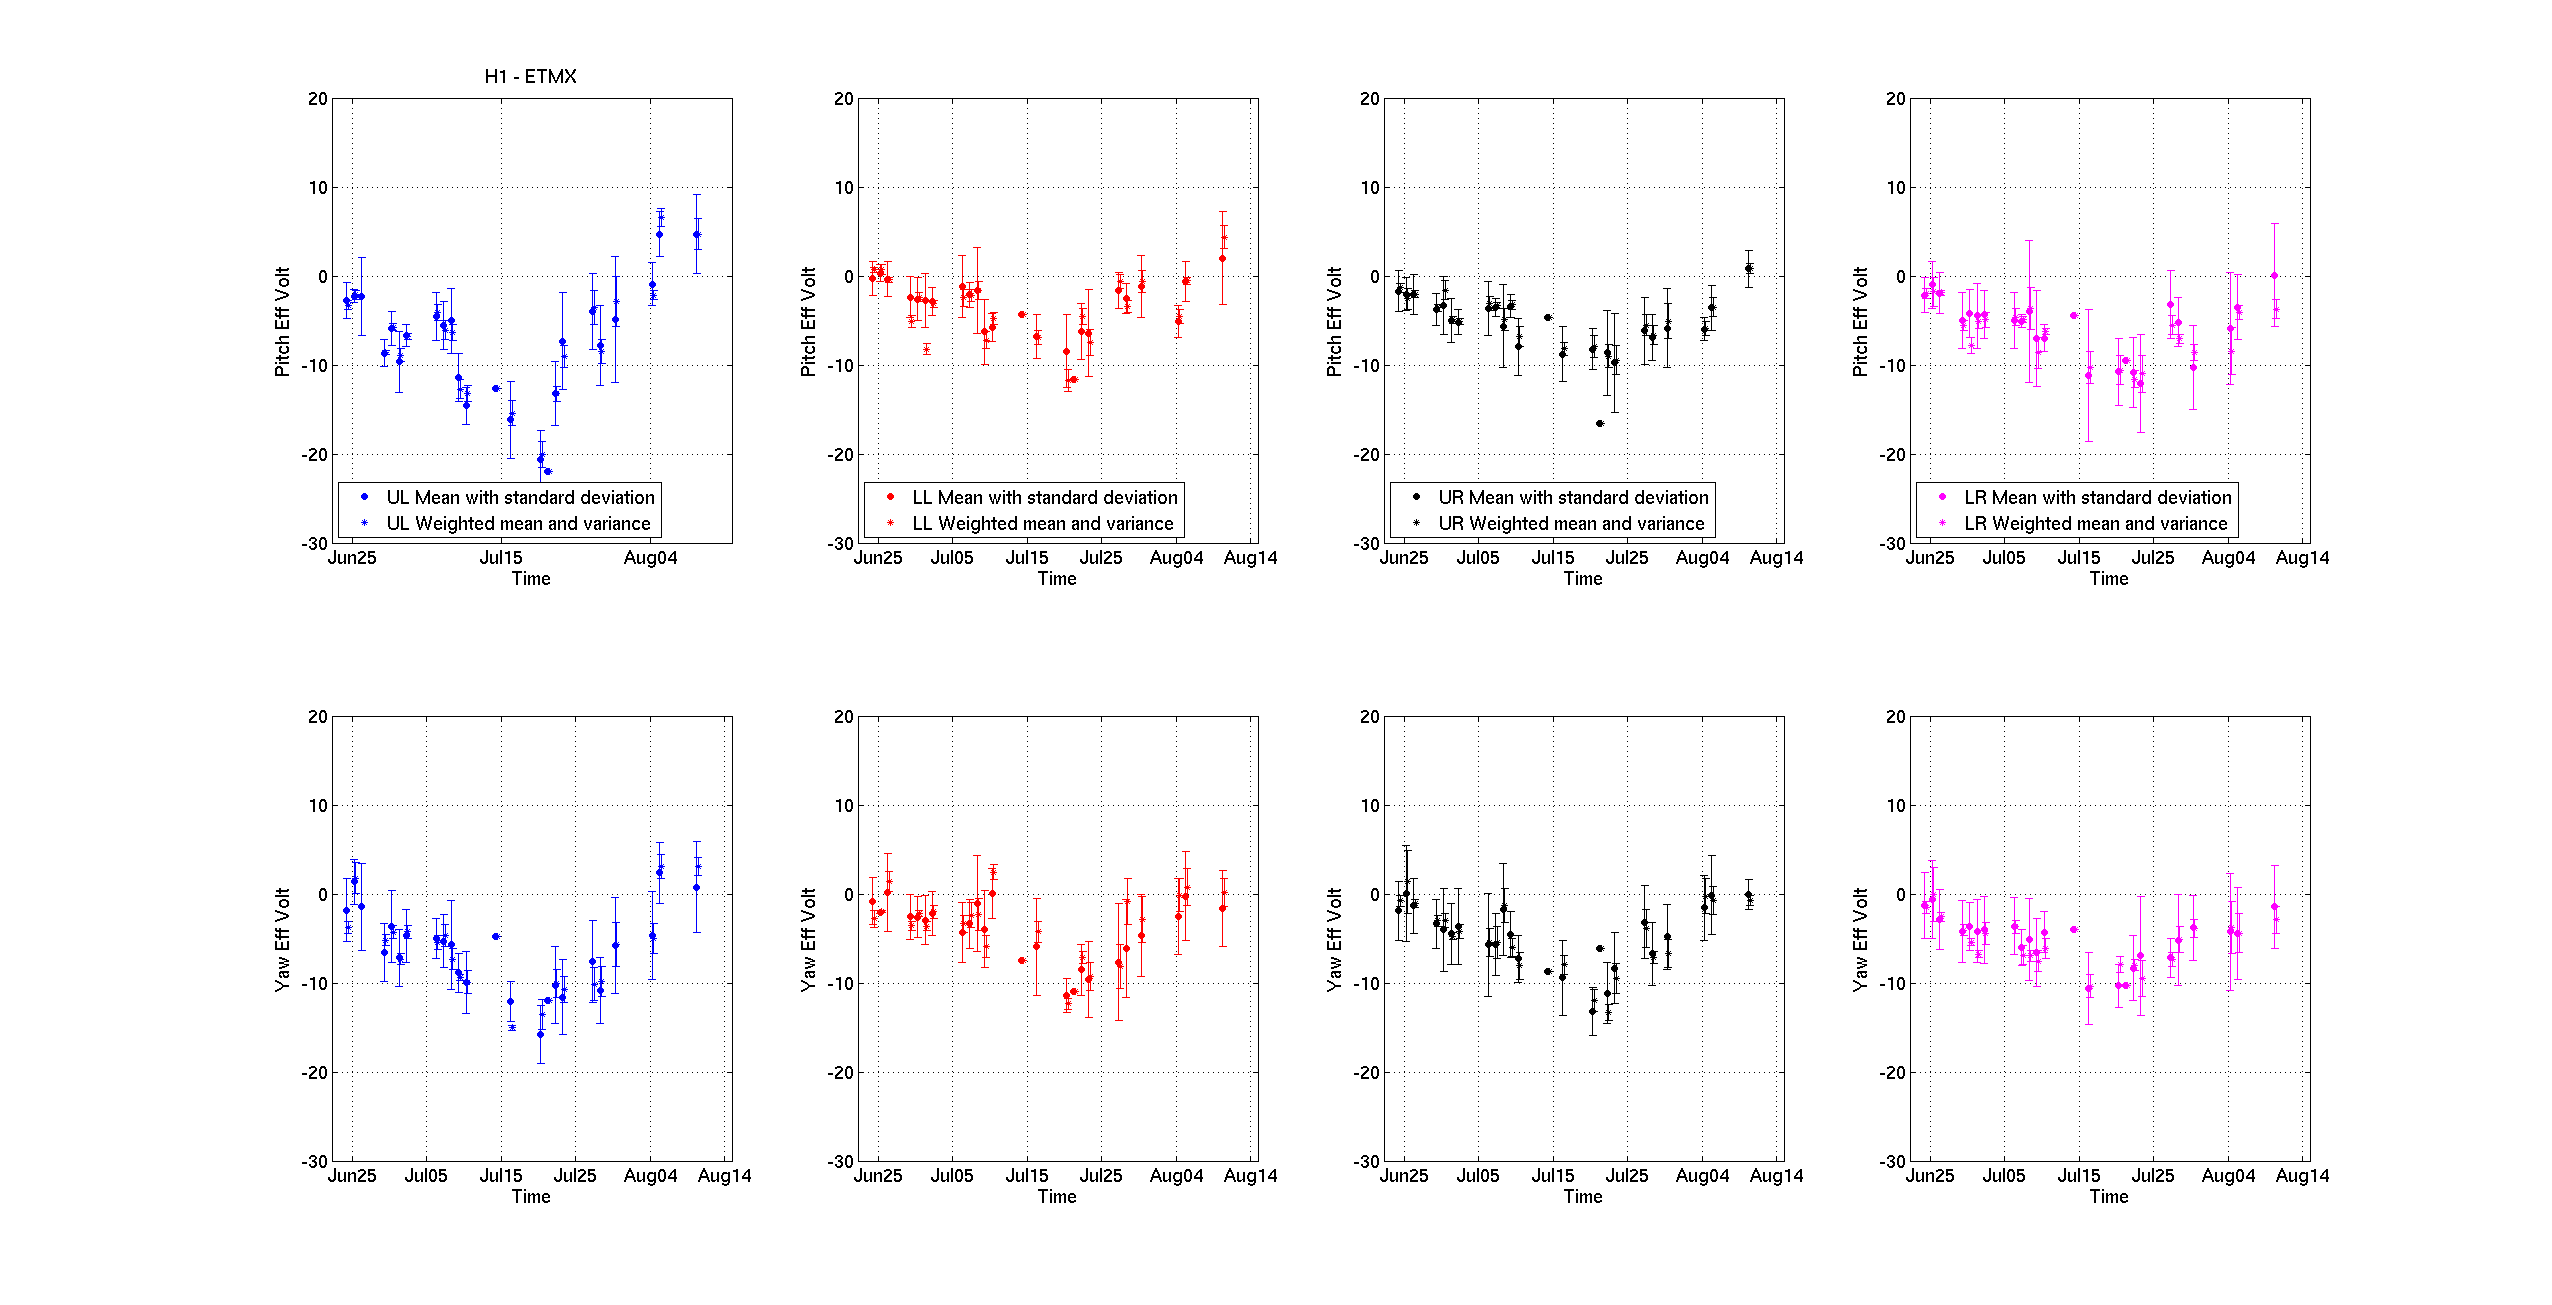
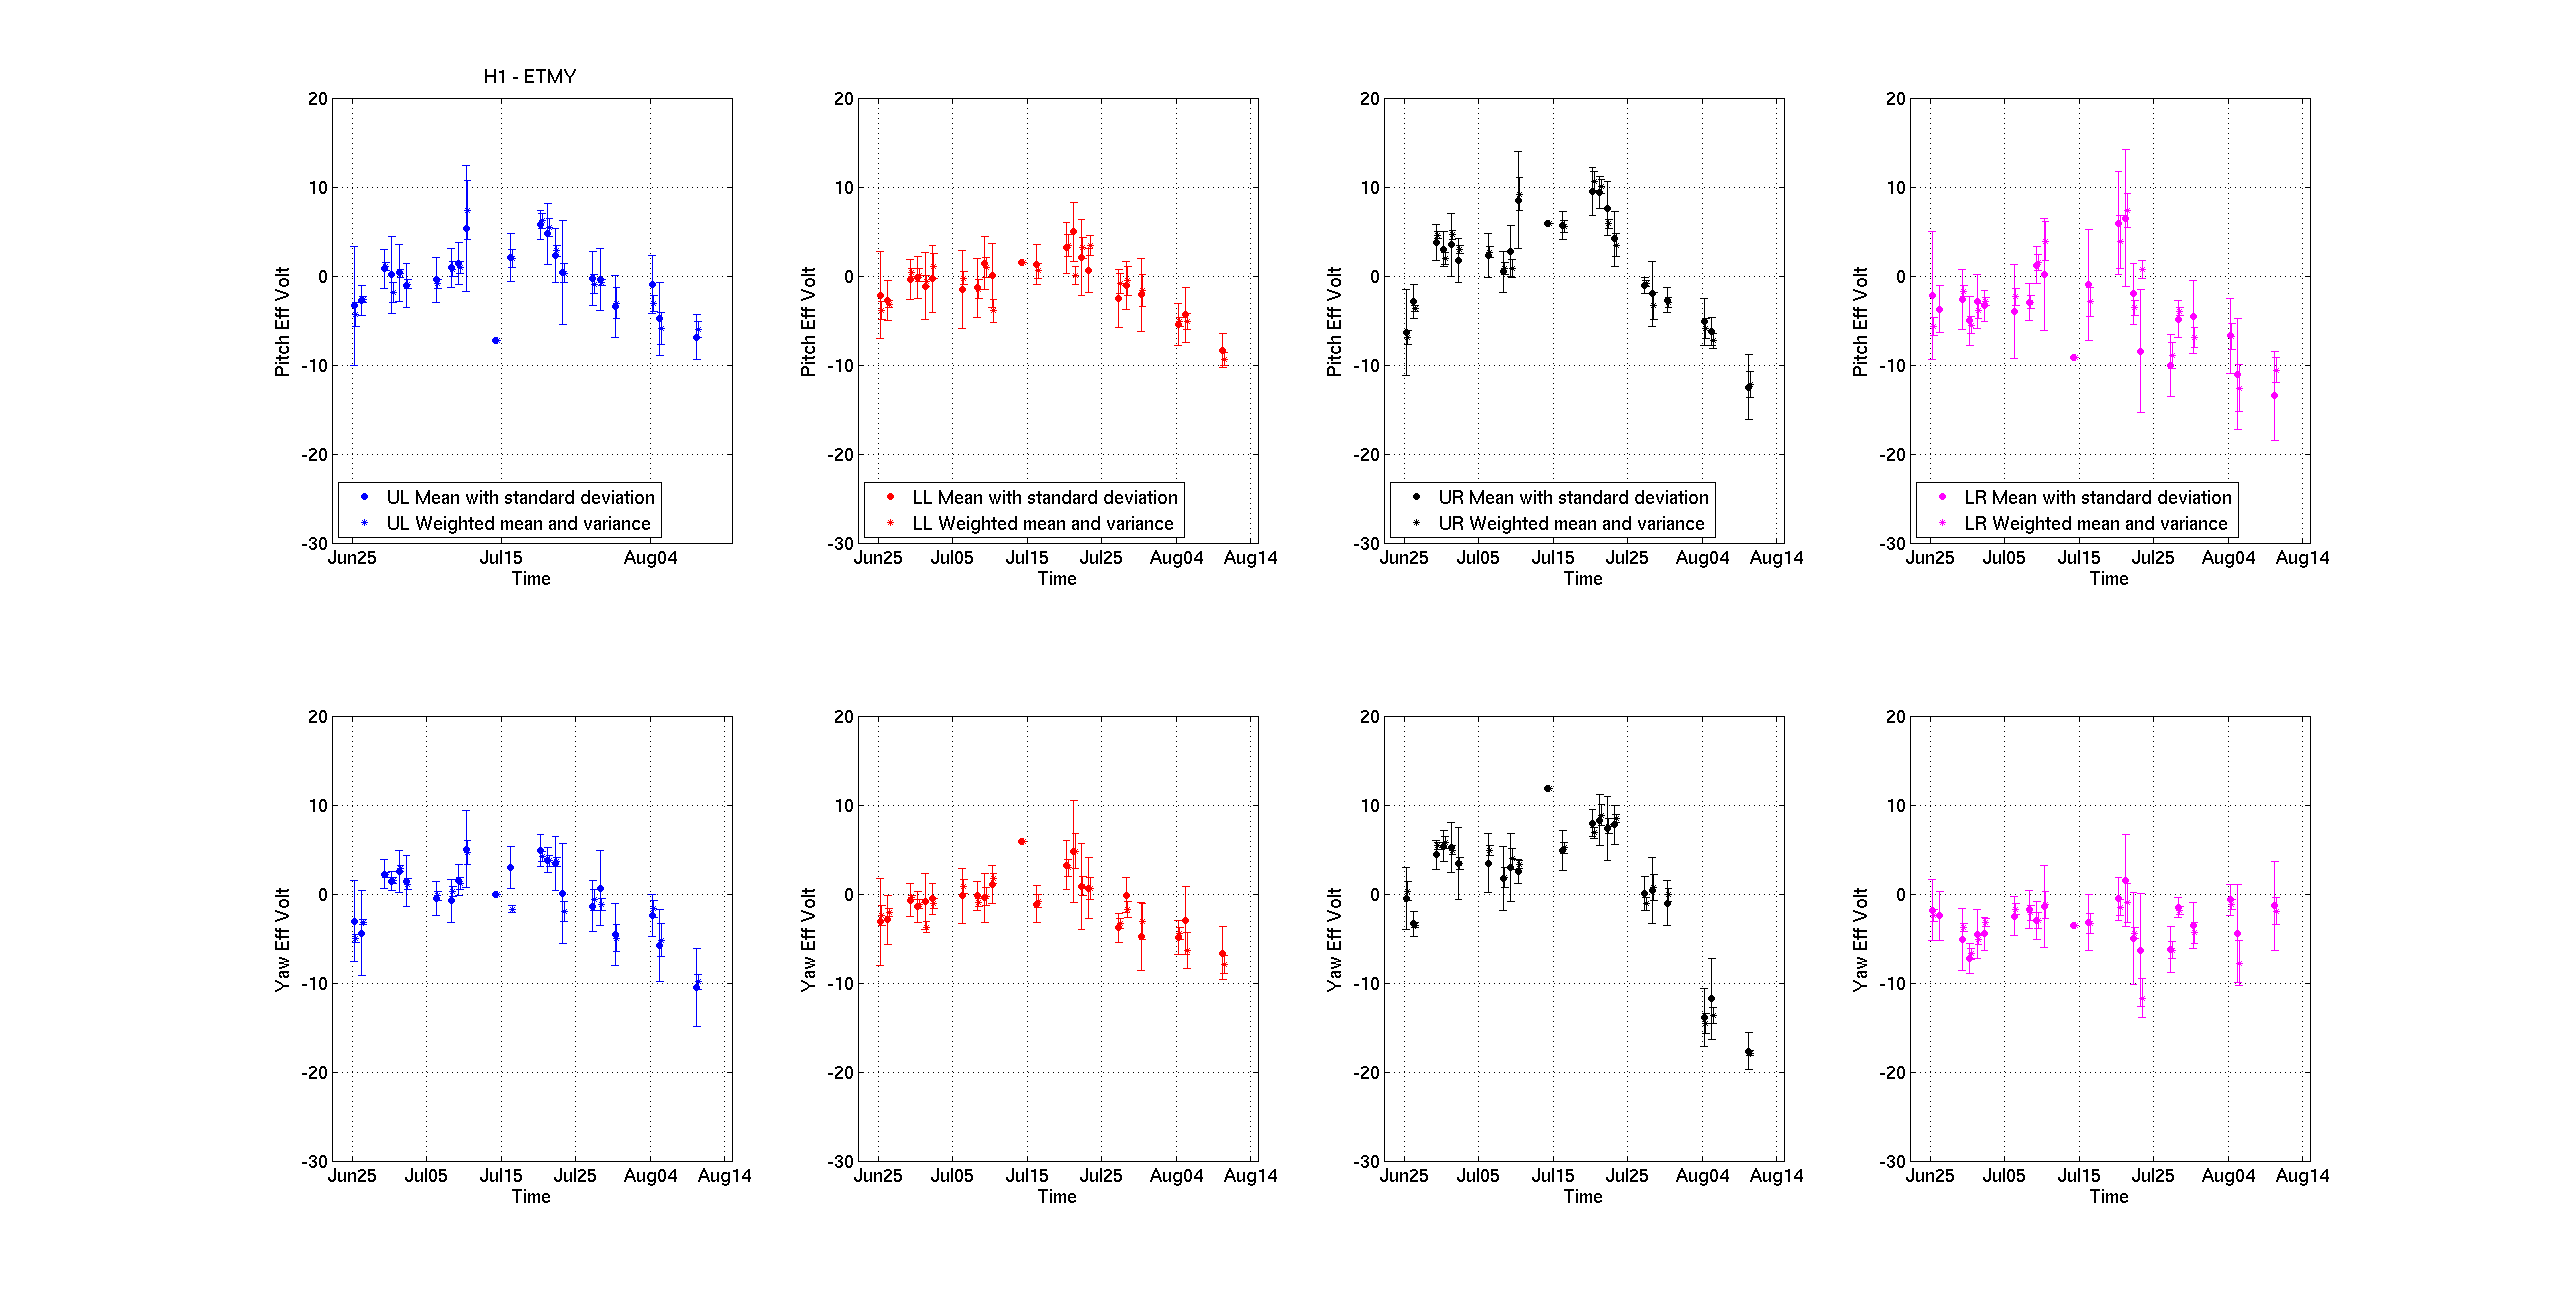
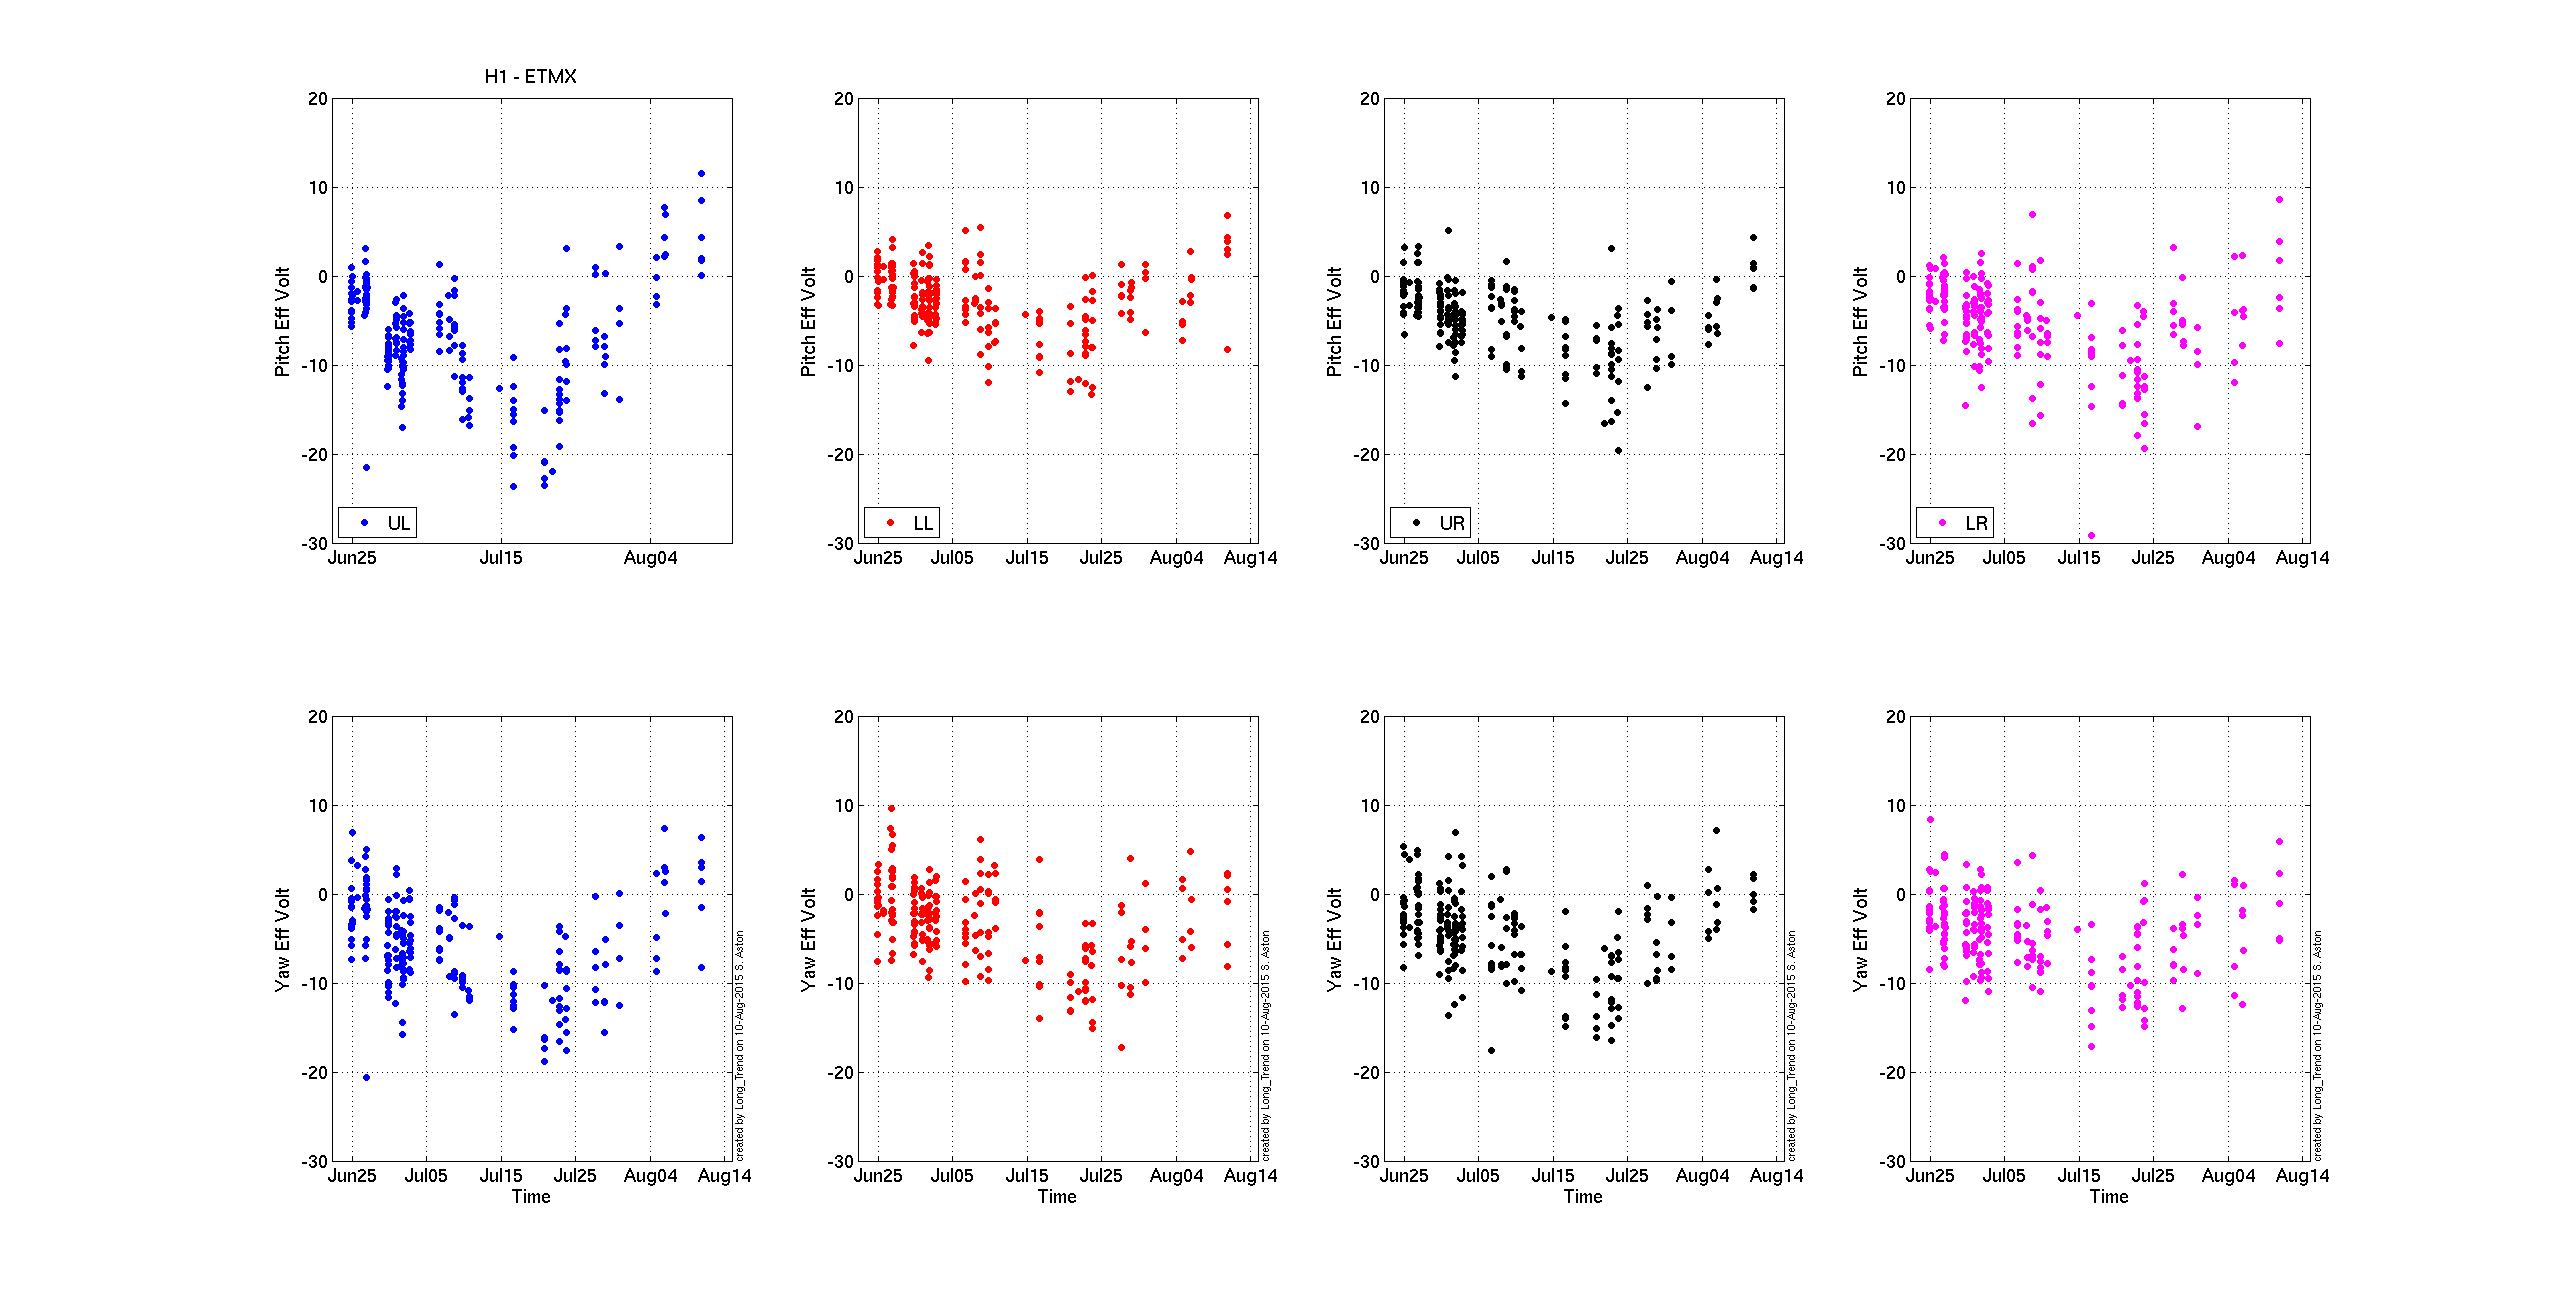
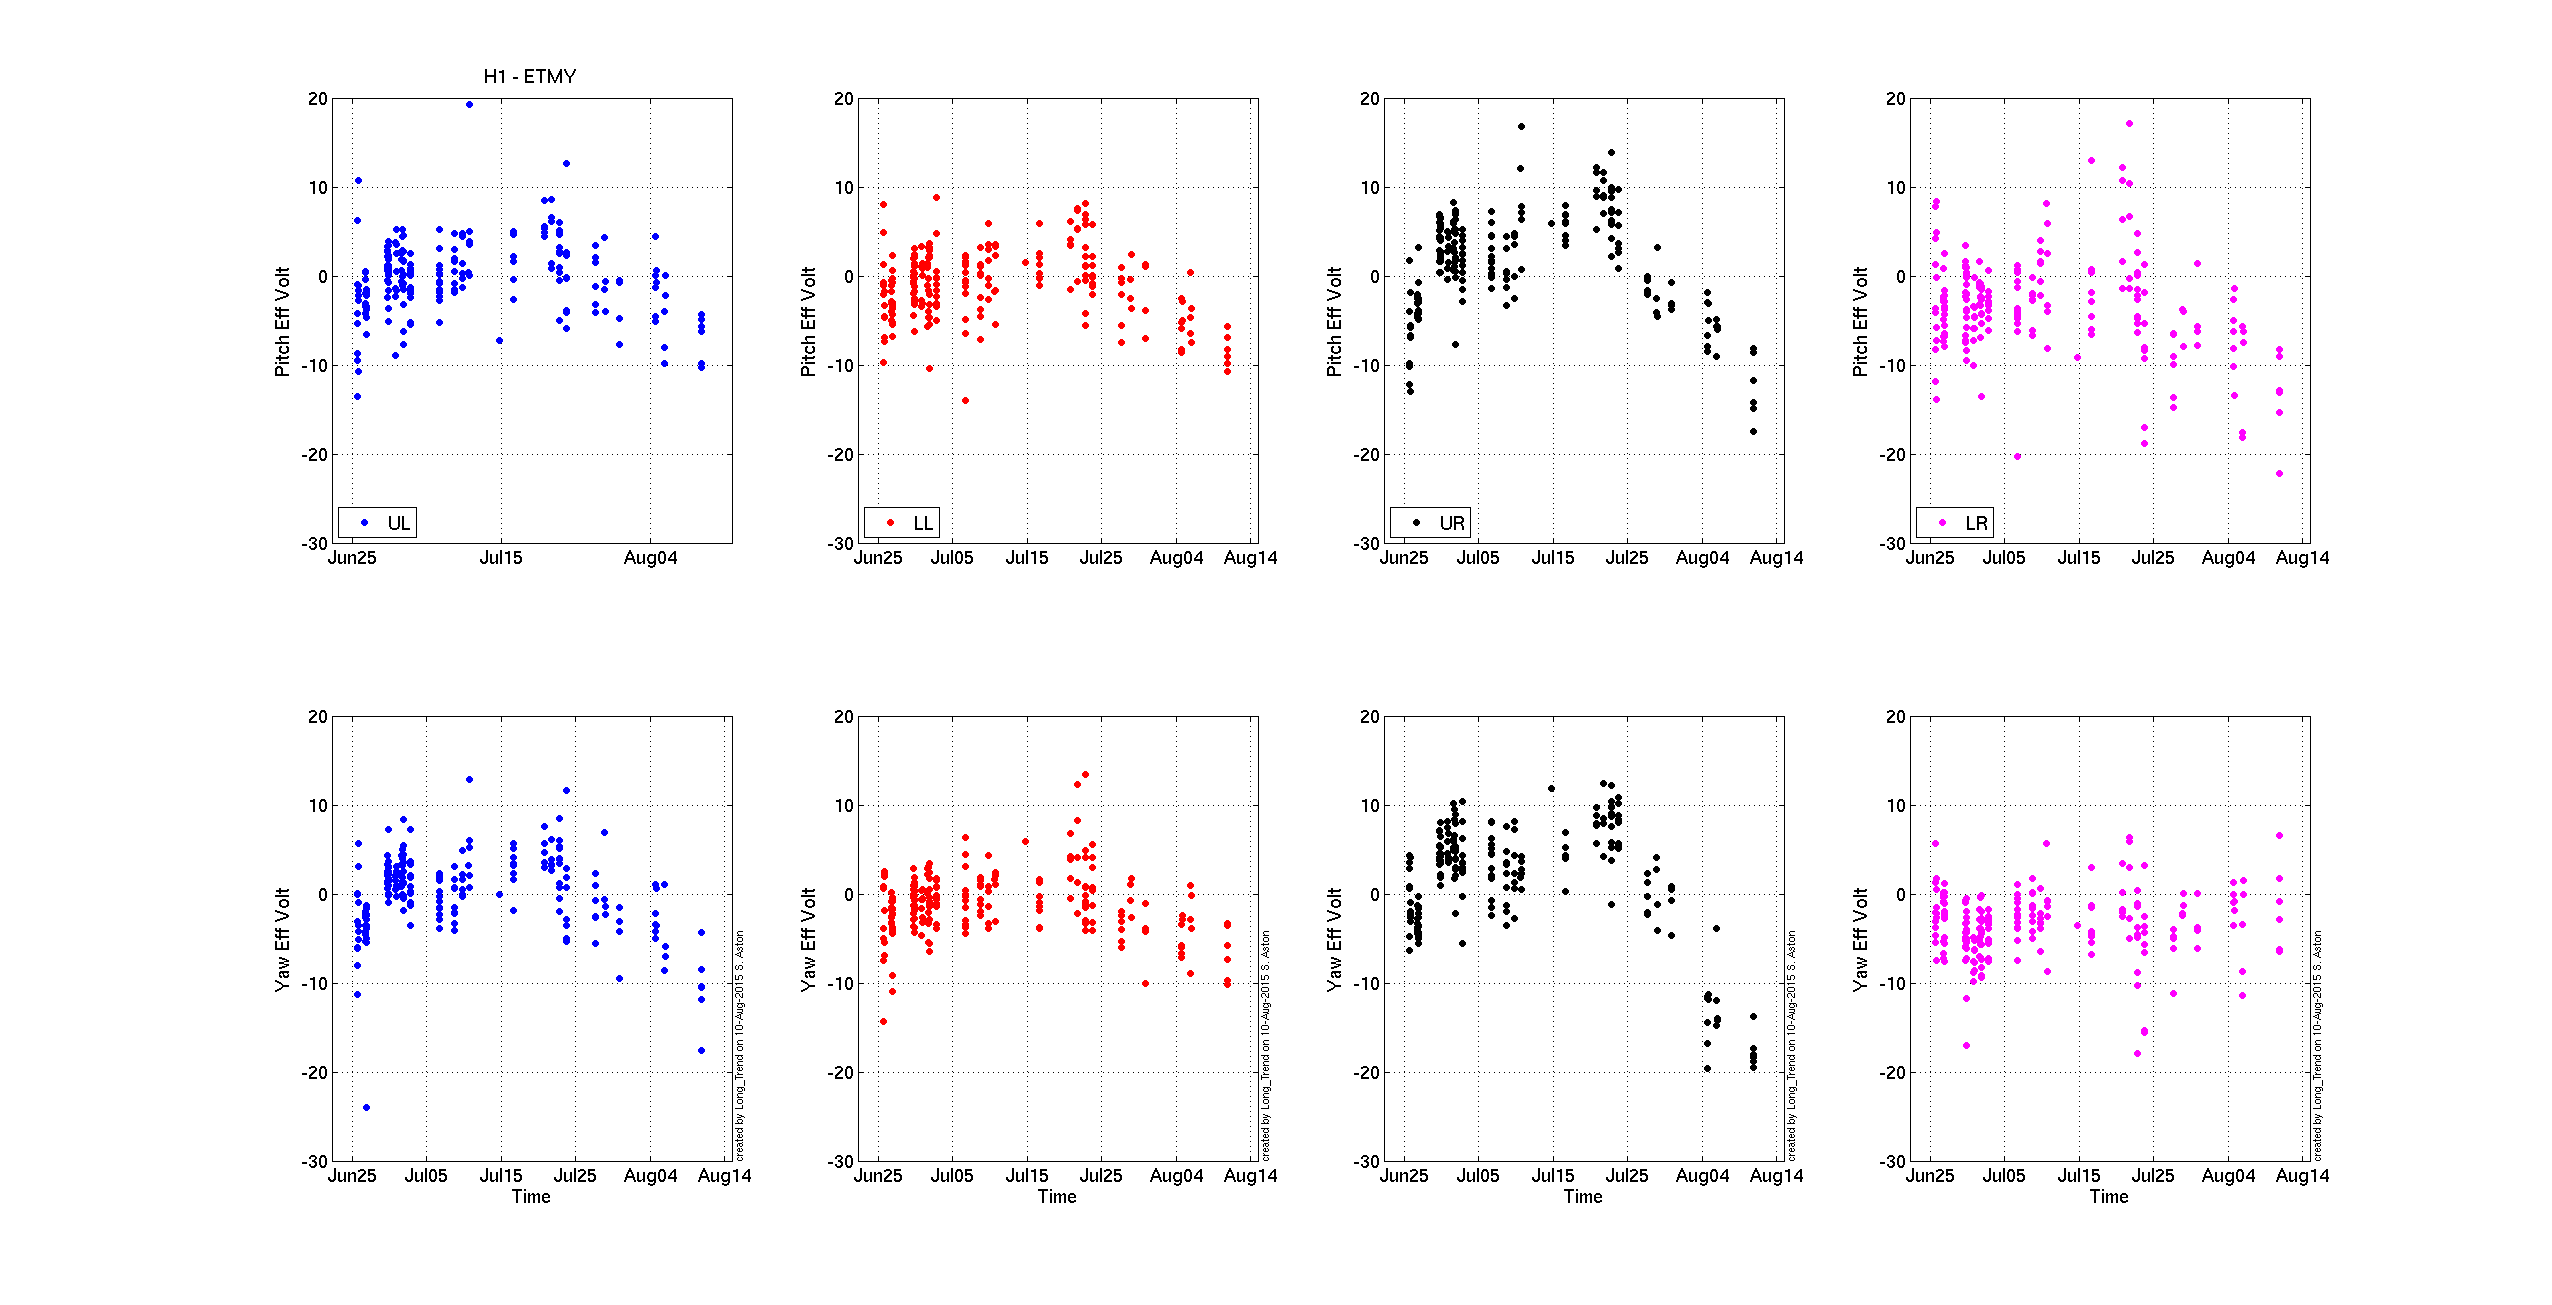
Leonid.Prokhorov, Jeffrey.Kissel
Charge measurements was done on both ETMs.
Results are in attachments. For most quadrants we have follow trend:

From June, 24 to July, 21 (from discharging to changing the bias sign) data are consistent with positive charging for ETMY and negative charging for ETMX.
ETMX Bias: +9.5V, Mean charging rate: -10 V/month (st. dev. +/- 3 V/mon)
ETMY Bias: -9.5V, Mean charging rate: +7 V/month (st. dev. +/- 3 V/mon)

From July, 22 to Aug, 10 (from changing the bias sign to today's measurements) data for most of quadrants are consistent with the changed sign of charging - negative for ETMY and positive for ETMX.
ETMX Bias: -9.5V, Mean charging rate: +17 V/month (st. dev. +/- 9 V/mon)
ETMY Bias: +9.5V, Mean charging rate: -20 V/month (st. dev. +/- 14 V/mon)
Note, because the standard deviation is less that the mean, it shows that the rate is roughly the same for each quadrant. However, there are outliers (see, e.g. Right quadrants of ETMY).

Now the effective bias voltage is about few volts for ETMX, and about 10 volts for most quadrants of ETMY, but ETMY UR shows as much as 15-20 Volts.
Probably, it's a good time to reverse the bias sign at ETMY.


There are two sets of plots, each which show the same data in a different way:
(1) ETMX_Mean.png & ETMY_Mean.png shows both the mean and standard deviation, and weighted mean and sqrt(weighted variance) of the charge measurements for a given day (which can be from ~4 to ~15 of these 12 minute measurements per mean point). We believe this better shows the long-term trend of the charge.
(2) ETMX.png & ETMY.png show the "raw" data, where the result of each estimate of the effective bias voltage shown *since* the discharging. Each single data point is an estimate of the effective bias voltage, i.e. the charge, as determined by driving the test mass while varying the requested bias voltage and measuring the response with the optic's optical lever.

Related alogs: 19848, 19821
Images attached to this report